


We recently launched data processing pipelines (in Public Preview) for Google Security Operations, which provides security teams with pre-parsing control for their log ingestion. This new capability gives you granular control over your logs before they are shipped to Google SecOps for ingestion, allowing you to:
- Manage Cost & Reduce Noise – Automatically drop high-volume, low-value events so you only pay for the ingestion of events that are relevant to your security operations capabilities.
- Redact Sensitive Data – Mask or hash PII and confidential data like sensitive document names in Google Workspace logs.
- Accelerate Detection – Send cleaner, higher-fidelity data to Google SecOps, making it easier to find the signal in the noise.
In this blog post, I’ll demonstrate how to filter and redact data from your logs leveraging data pipeline processing with Bindplane and Google SecOps. This feature is available to Enterprise and Enterprise+ customers.
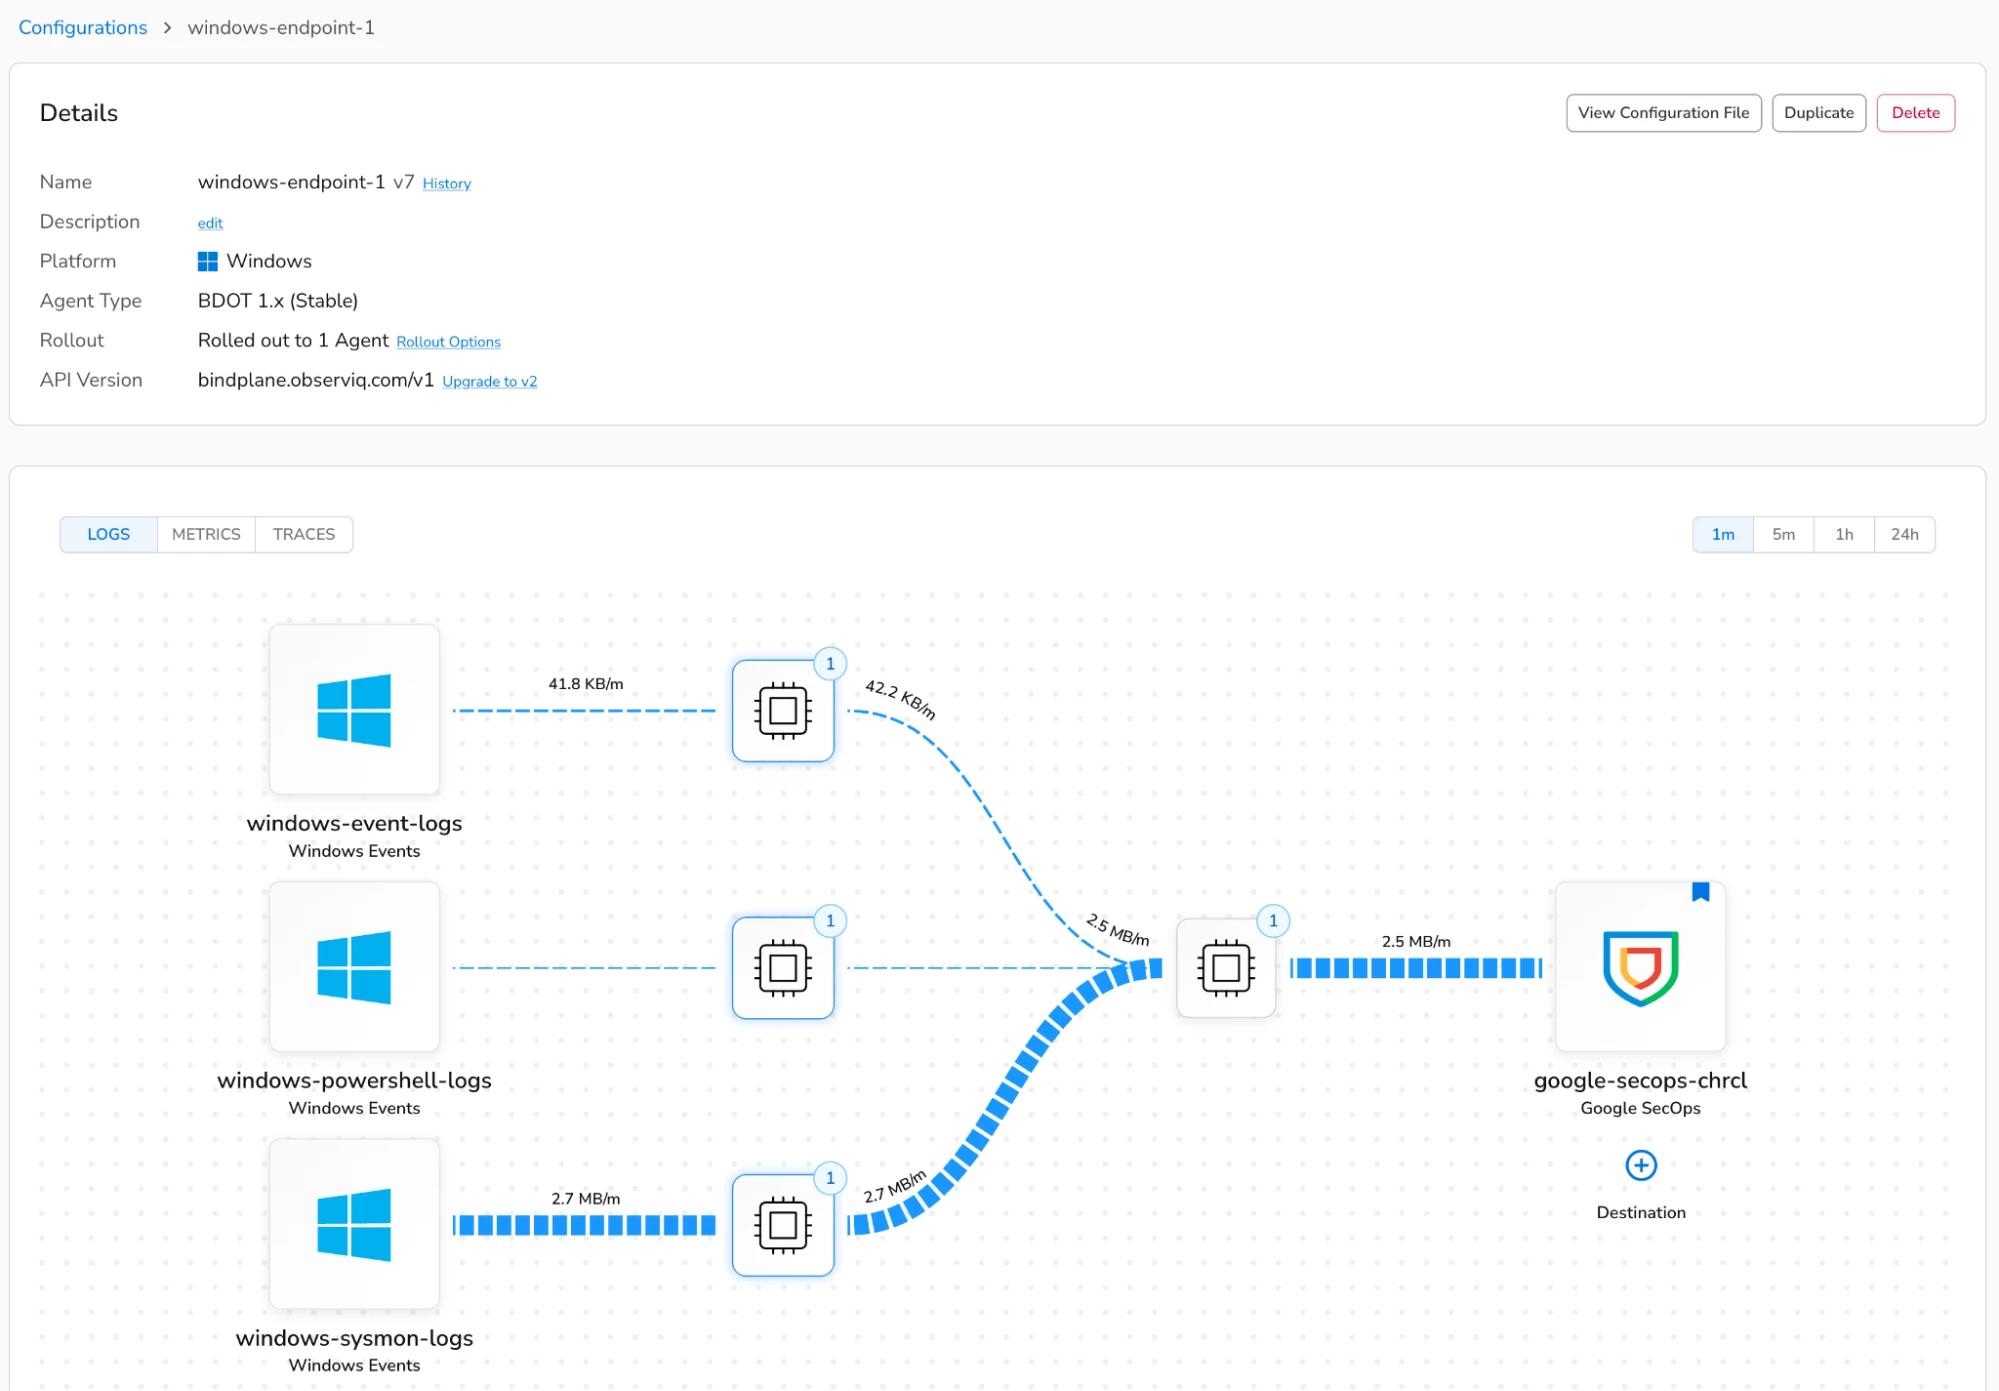
In my Bindplane management console, I’ve configured an agent configuration to collect Windows event logs, Sysmon, and PowerShell logs from my Windows hosts and ship them to Google SecOps for ingestion.
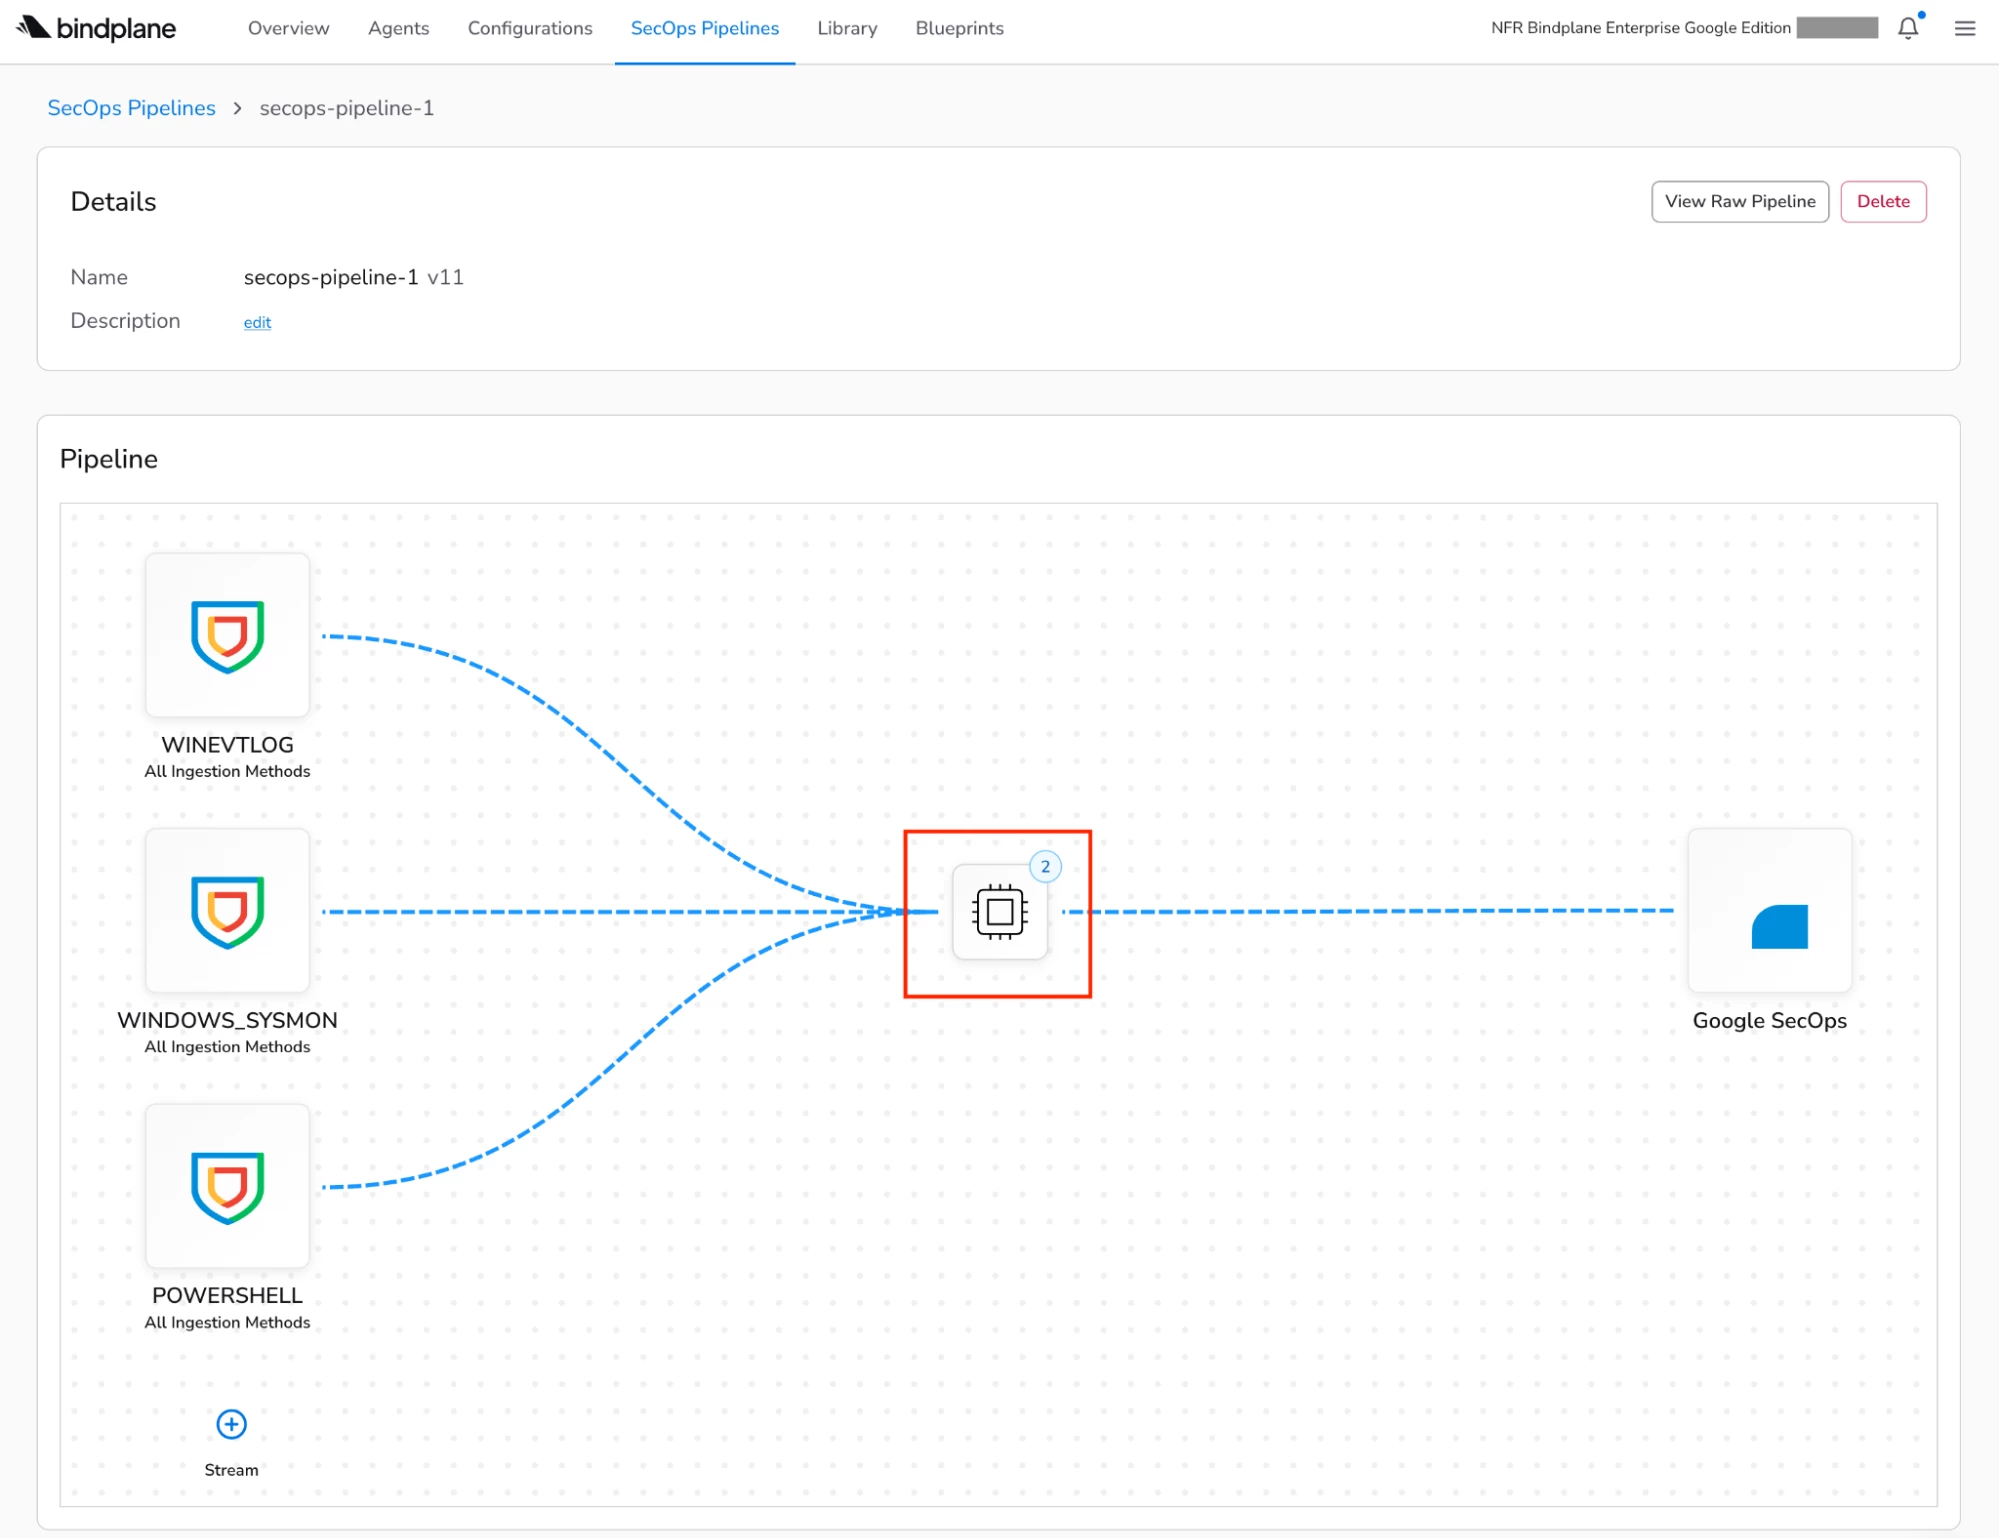
In the new SecOps Pipelines page within Bindplane, I’ve configured a new pipeline with a processor node, which is highlighted in the diagram below. A processor node can contain one or more processors that are responsible for carrying out actions such as transforming, filtering, or redacting data in your log events before they’re shipped to Google SecOps for ingestion. A list of the available processors can be found in our documentation.
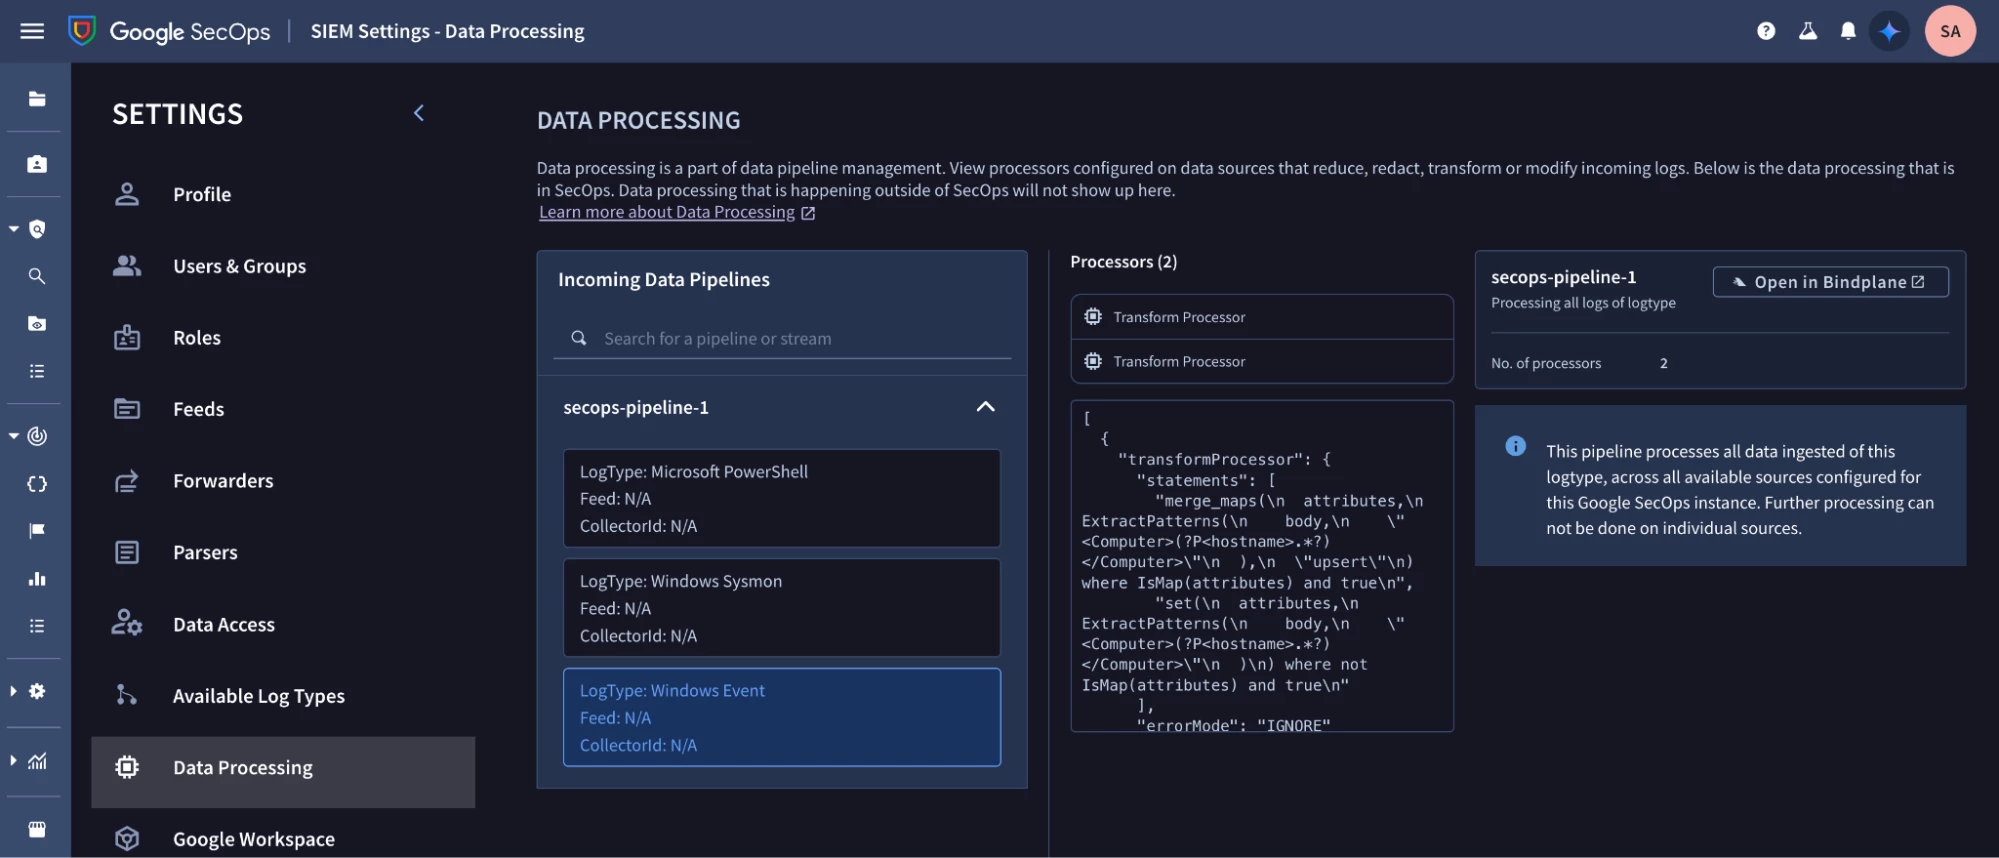
Data pipeline processing configuration can also be viewed in Google SecOps by navigating to SIEM Settings - Data Processing.
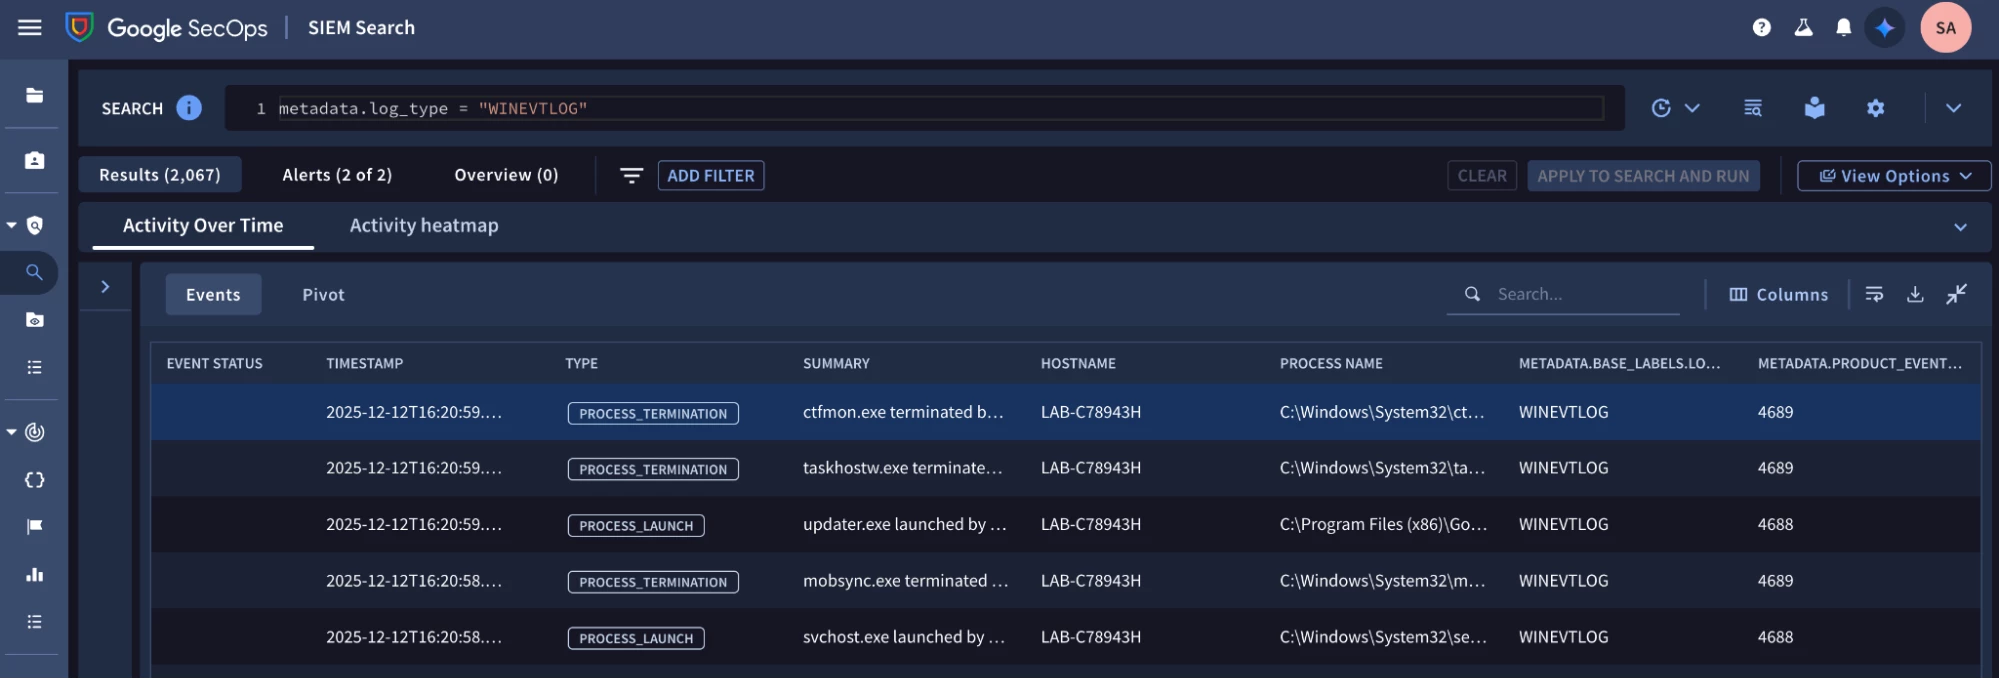
Running the query below in Google SecOps validates that I’m ingesting Windows event logs.
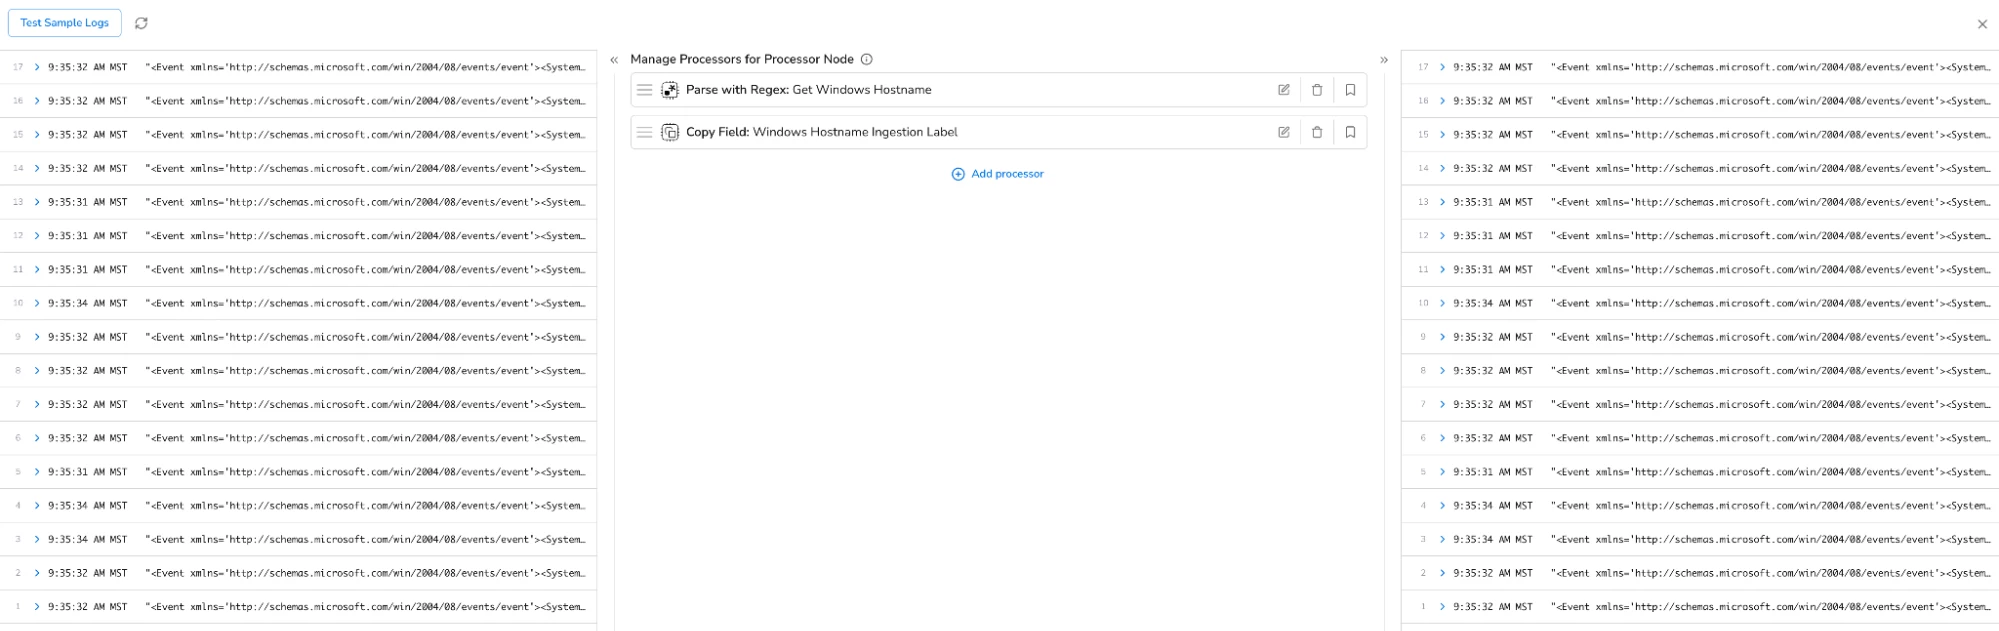
I can review the configuration of my processors in the Bindplane management console by clicking on the processor node. I have two processors configured. One processor uses a regular expression to extract the Windows hostname from my Windows event logs. The second processor adds the Windows hostname as an ingestion label field before the events are sent to Google SecOps for ingestion. It’s important to note that processors are executed in the order that they’re listed.
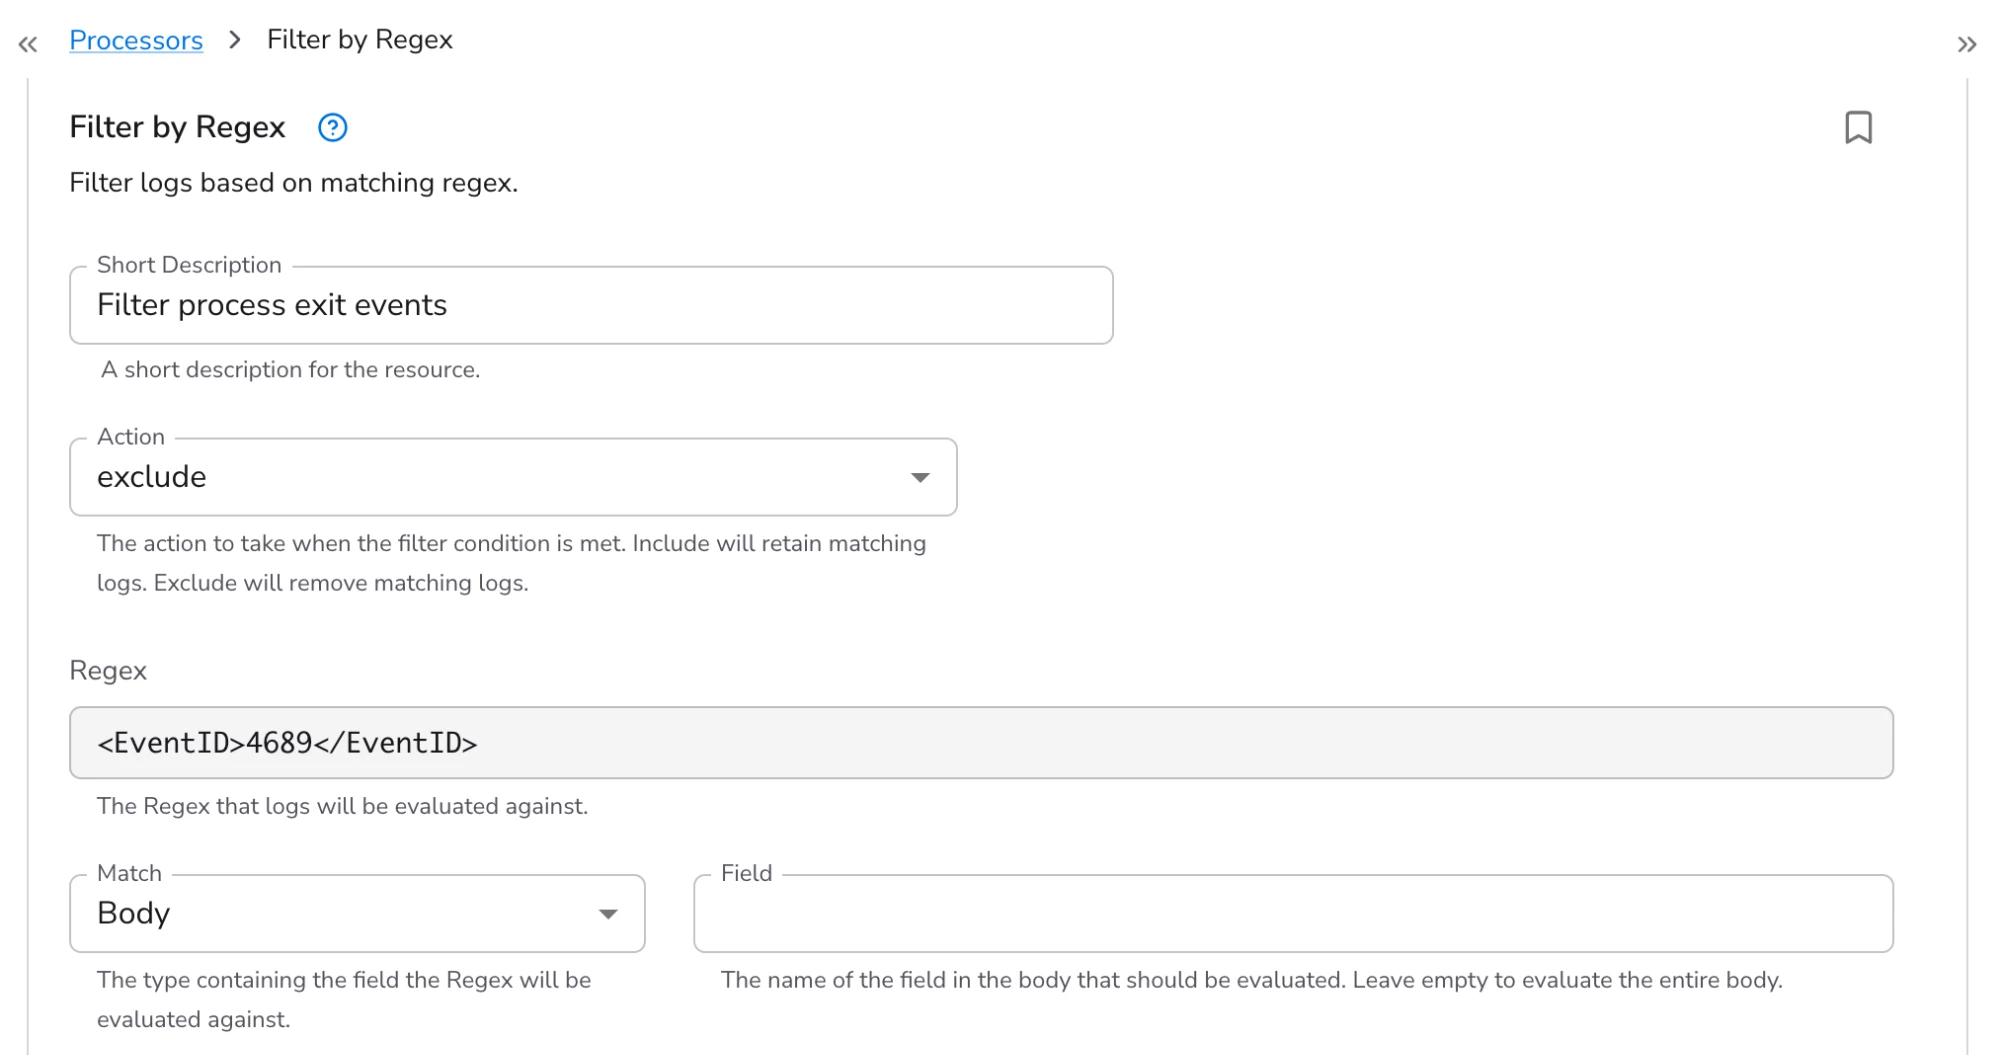
For today’s example, let’s say that I want to filter process exit events (event ID 4689) that are logged by my Windows hosts (i.e. I want my Windows hosts to still log these events locally, but I don’t want to ingest them into Google SecOps). I click “add processor” and choose the “Filter by Regex” processor. I give the new processor a short description and leave the action set to “exclude” so that logs that match my regular expression are removed.
Bindplane uses Go’s regex engine. I’m using the regular expression, “<EventID>4689</EventID>”.
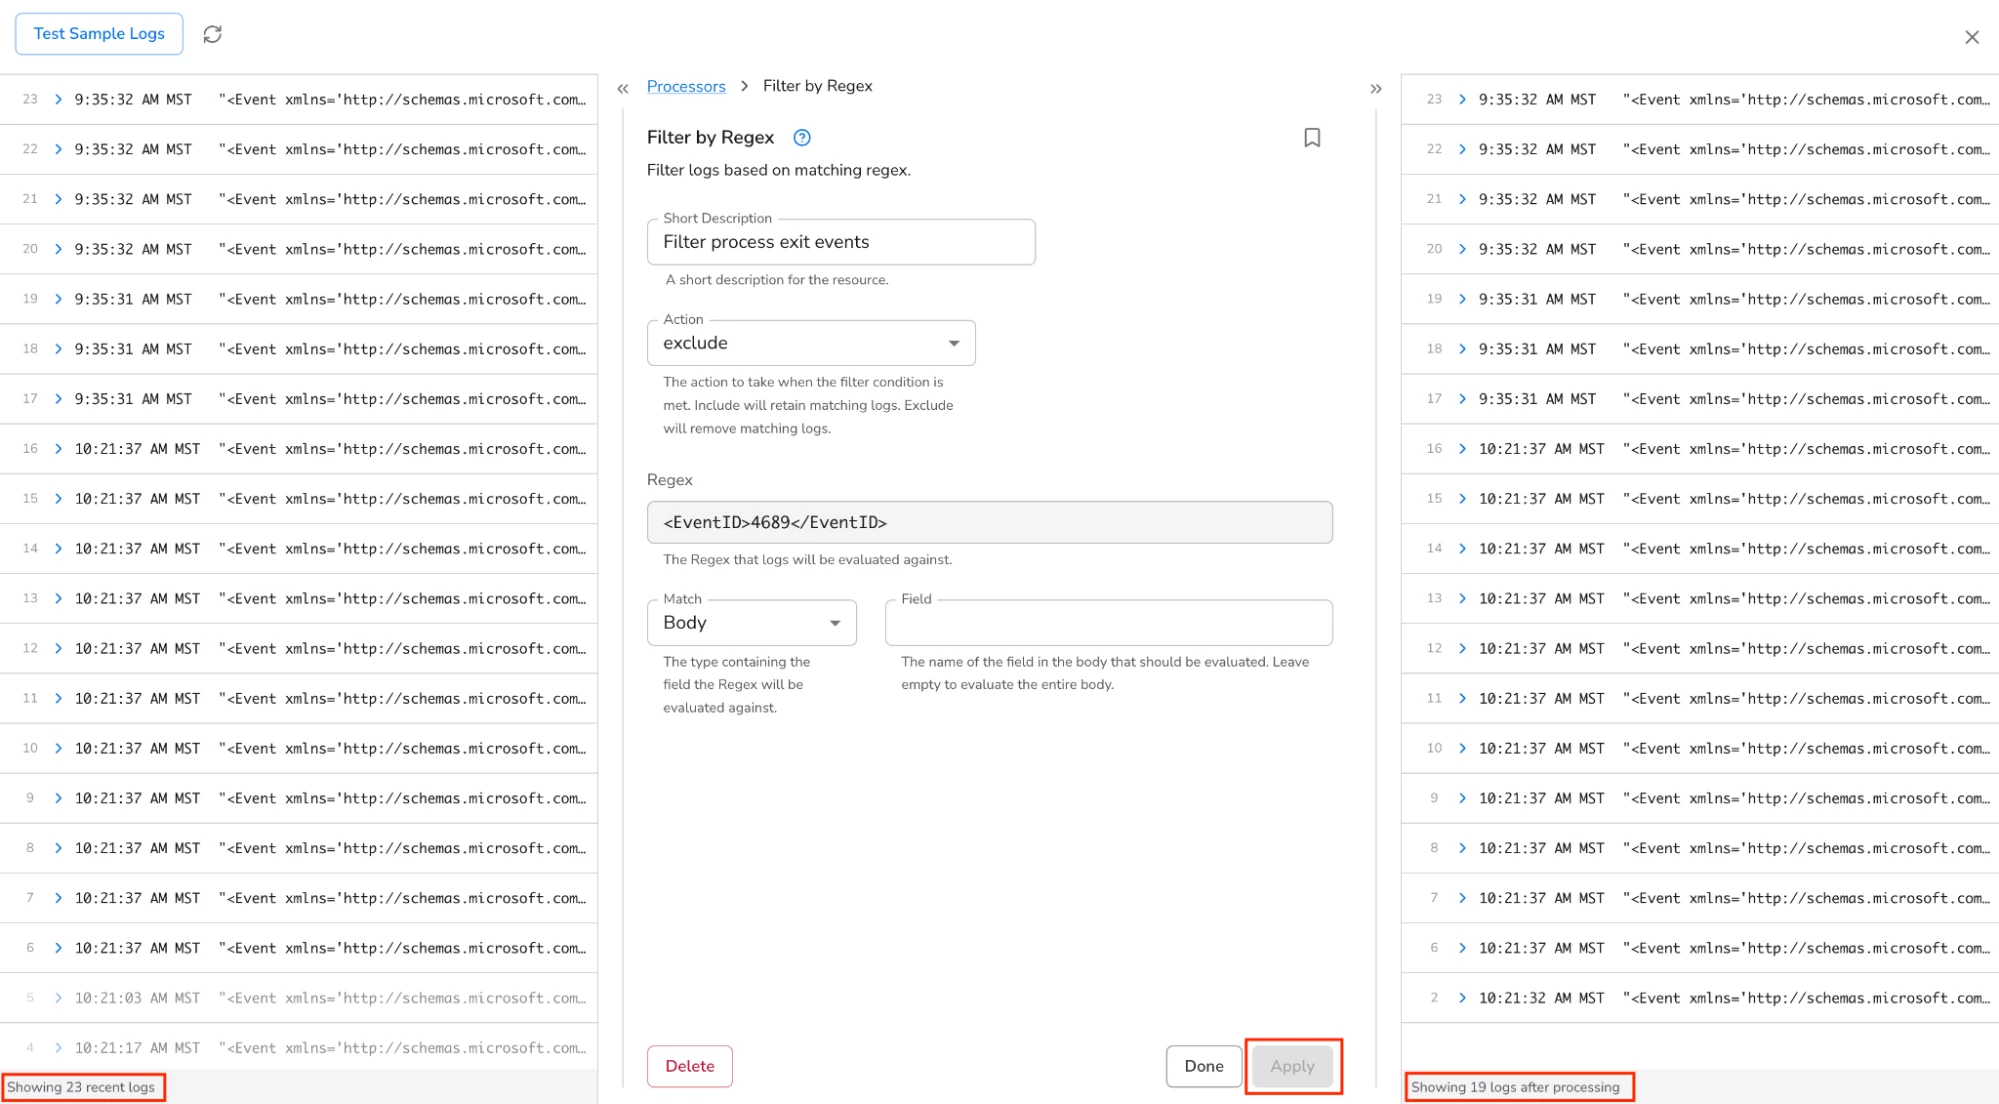
Bindplane has a neat feature where you can see a sampling of logs on the left and the same logs on the right after the processors have been executed. Clicking “Apply” executes my new processor against the sample logs. I can see that 4 events were filtered using my regular expression.
After clicking “Done” and “Save”, I can see that a “rollout” of my pipeline configuration is pending.

After clicking “Start Rollout”, the new pipeline configuration is deployed and Windows events with the event ID of 4689 are filtered and no longer sent to Google SecOps for ingestion.
That’s it for today’s post where we learned how to use Bindplane’s data pipeline processing feature to filter logs from being ingested into Google SecOps.


