

Blog Authors:
Daniel Wachdorf, Engineer Detections Platform
Kyle Champlin, Product Manager Detections Platform
The Challenge
For any modern Security Operations (SecOps) team, tracking Mean Time To Detection (MTTD) is a critical measure of efficiency and effectiveness. However, achieving granular, reliable MTTD tracking often presents a challenge: many products lack the necessary built-in metrics to accurately link the moment an event occurred or was ingested with the final detection time. This gap makes it difficult to assess rule efficiency and ensure timely threat response.
The Solution
To address this common pain point, the Google SecOps Detection team has introduced new fields to the Collection proto in our APIs. This enhancement allows customers to perform fine-grained MTTD tracking for every Detection or Alert created, directly supporting the goal of enhancing how security professionals protect their environments. These new fields, which are referenced in Yara-L based search and dashboards, unlock comprehensive metrics calculation across a multitude of dimensions.
Specificity and Depth: Unlocking Latency Metrics
The new fields are added to the Collection proto, which represents each SecOps Detection and/or Alert.
1. LatencyMetrics
This message calculates crucial timing data for the events involved in a detection:
-
oldestIngestionTime: The oldest ingestion time of any event that participated in the Detection.
-
newestIngestionTime: The most recent ingestion time of any event that participated in the Detection.
-
oldestEventTime: The oldest event time of any event that participated in the detection.
-
newestEventTime: The newest (most recent) ingestion time of any event that participated in the Detection.
2. DetectionTimingDetails
This field indicates if a Detection was created by a rule execution that operated in a delayed fashion, helping to filter out irrelevant metrics.
-
DETECTION_TIMING_DETAILS_UNSPECIFIED: Generated through a normally timed rule execution.
-
DETECTION_TIMING_DETAILS_REPROCESSING: Generated through a reprocessing run (due to late arriving data, re-processing enrichments, or entity graph context).
-
DETECTION_TIMING_DETAILS_RETROHUNT: Generated through a rule Retro-Hunt, not normal execution.
3. RuleRunFrequency
This indicates the execution cadence of the generating rule:
-
RUN_FREQUENCY_REALTIME: Realtime or near-Realtime (10min) frequency.
-
RUN_FREQUENCY_HOURLY: Hourly frequency.
-
RUN_FREQUENCY_DAILY: Daily frequency.
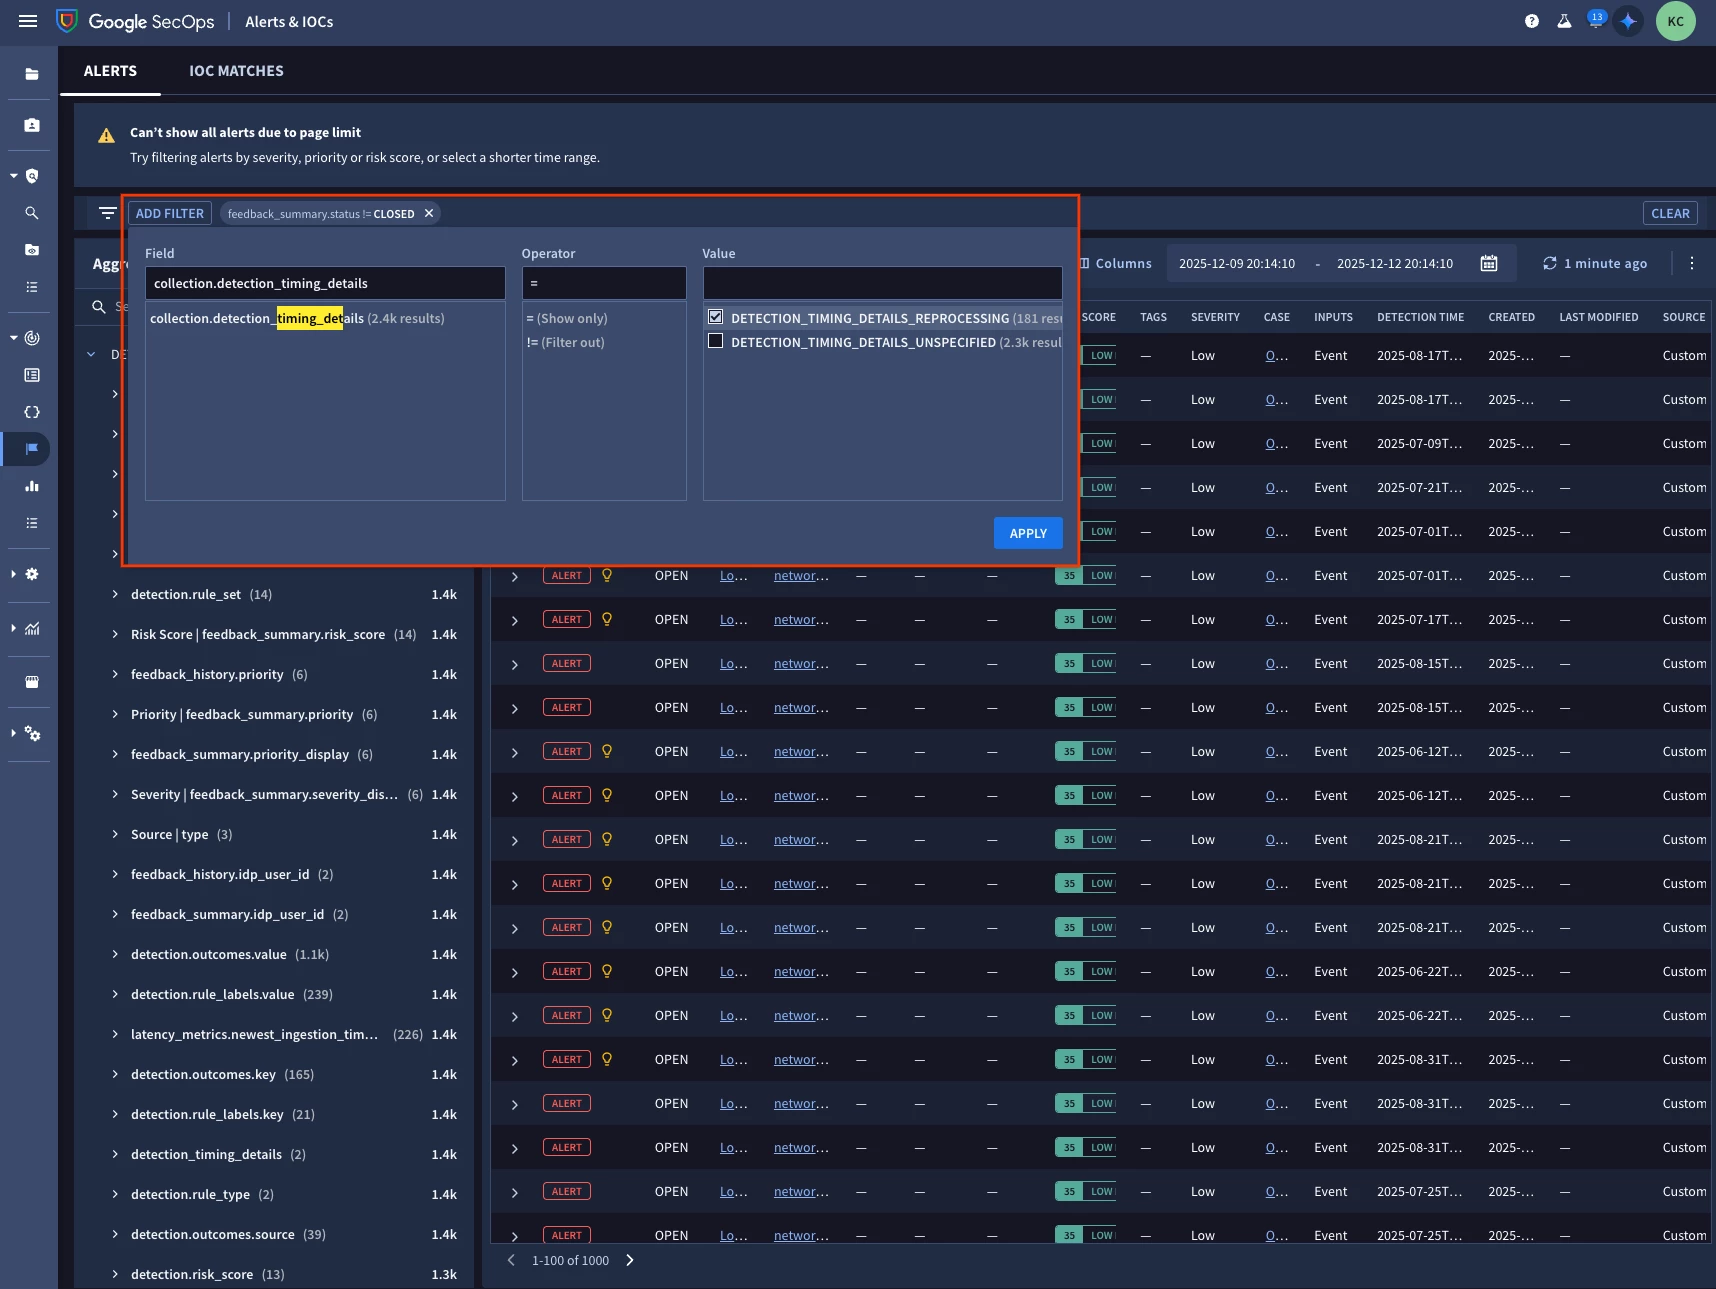
We have also plumbed these metrics into key areas of SecOps, such as the Alerts lister page, allowing you to filter on facets like “detectiontimingdetails”. Notice the yellow lightbulb will also decorate rule replay cases wherever alerts are consumed (ex. Cases, Alert detail page, etc.).
Calculating Latency
Basic analysis of detection latency and ingestion latency can be calculated using the following formulas:
-
$event_to_detection_latency = detection.created_time.seconds - detection.latency_metrics.newest_event_time.seconds
-
$ingestion_to_detection_latency = detection.created_time.seconds - detection.latency_metrics.newest_ingestion_time.seconds
Yara-L Dashboard Example
A simple dashboard to display latency metrics per rule can be created using this Yara-L:
detection.type = "RULE_DETECTION"
$rule_name = detection.detection.rule_name
$rule_type = detection.detection.rule_type


detection.latency_metrics.newest_ingestion_time.seconds != 0
detection.latency_metrics.newest_event_time.seconds != 0


$did = detection.id


match:

    $rule_name, $rule_type


outcome:

    $avg_ingest_delay = math.round((avg(detection.latency_metrics.newest_ingestion_time.seconds - detection.latency_metrics.newest_event_time.seconds)) / 60, 1)

    $avg_ingest_to_detection_delay = math.round((avg(detection.created_time.seconds - detection.latency_metrics.newest_ingestion_time.seconds)) /60, 1)

    $avg_event_to_detection_delay = math.round((avg(detection.created_time.seconds - detection.latency_metrics.newest_event_time.seconds)) / 60, 1)

    $max_ingest_to_detection_delay = math.round((max(detection.created_time.seconds - detection.latency_metrics.newest_ingestion_time.seconds)) /60, 1)

    $max_event_to_detection_delay = math.round((max(detection.created_time.seconds - detection.latency_metrics.newest_event_time.seconds)) /60, 1)


order:

    $avg_event_to_detection_delay desc
The DetectionTimingDetails field is crucial here, as it provides a mechanism to filter out detections generated due to enrichment reprocessing runs, ensuring your latency metrics reflect only normal execution.
We have also shipped a curated dashboard with SecOps called “Rule Observability” that you can also leverage for reference.
The Takeaway
You can now leverage these new metrics to establish granular and accurate MTTD tracking in your environment. Start by implementing the provided Yara-L dashboard template in your environment. Understanding the latency of your detection rules is the first step toward improving your security posture and modernizing your security processes, aligning with Google's approach to cloud security.
For further reading we have also provided updated product documentation:
https://docs.cloud.google.com/chronicle/docs/detection/detection-delays
https://docs.cloud.google.com/chronicle/docs/detection/rule-replays