


Previously, we looked at building a composite rule using specific producer rules. In that example, all producer rules must create a detection for the composite rule to generate an alert. This is a great start, but chances are you don’t want to have to worry about defining specific sets of 2 or 3 or 5 or 10 producer rules to trigger for every composite rule use case you want to alert on.
In fact, it would be simpler if we could leverage descriptors from our producer rules that could then be part of a composite rule. That’s what we will be doing in this blog to build composite rules!
Let’s start by reviewing a few system level descriptors that are generated for every detection that is created. When a detection is created, it is stored as a collection object. This object contains metadata about a detection like the rule name, rule ID and in the case of curated detections, severity, rule set category and rule set names.
In addition to these values, detections are described as originating from a single or multi event rule, as well as if the detection is alerting or not. This is the tip of the iceberg as you will see in future blogs, but these additional attributes associated with a detection can be used to build out composite rules.
I could just tell you the fields you should care about and move on to rule writing, but this blog series is intended to teach you how to fish (not phish 😀 to be clear), so let’s look at the underlying collection endpoint where the detection fields are written.
At present, the best way to view this data is by using the native dashboard function in Google Security Operations (SecOps). This isn’t the first time we have covered detections and dashboards, we used this data set to build a time chart in a previous blog. That said, let’s walk through a few fields to familiarize ourselves and then refine from there.
Here is a nice starter query to look at values in the detections data set.
$ruleName = detection.detection.rule_name
$detection_time = timestamp.get_timestamp(detection.detection_time.seconds)

match:
   $ruleName, $detection_time

outcome:
  $rule_type = array_distinct(detection.detection.rule_type) //single or multi event
  $alerting = array_distinct(detection.detection.alert_state) //alerting or not alerting
  $severity = array_distinct(detection.detection.severity)
  $description = array_distinct(detection.detection.description) // meta.description value
The filtering statement of the query is just creating placeholder variables for the rule name and a nice timestamp format for the detection time, so we are returning all detections within the time range specified in the chart or dashboard. The match section is aggregated by these two variables. In this case, I don’t really care about the number of detections being returned but if I wanted to, I could add a count in the outcome section. Instead, we are using the array_distinct aggregation function to output the type of rule, state of alert, severity and description.
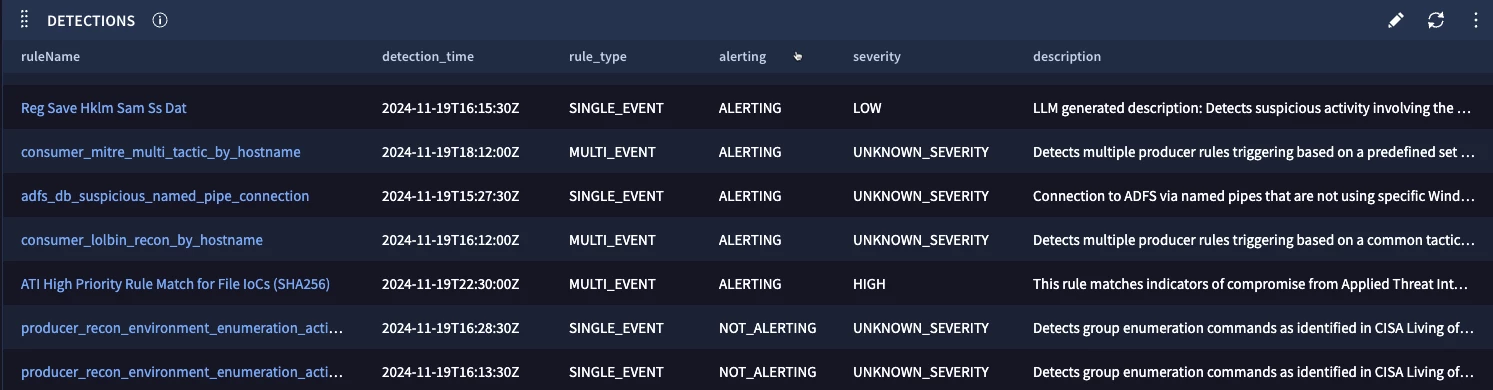
Our dashboard chart returns a listing of detections and we can see the rule type is one of two values, SINGLE_EVENT or MULTI_EVENT. The alert state is either ALERTING or NOT_ALERTING. Notice the severity has values like LOW and HIGH, but a number of detections have a severity of UNKNOWN_SEVERITY. Detections with this value originate from custom rules; only curated detections are populated with a severity other than unknown severity in this field.
The query above can be further tuned to add additional fields or narrow the listing of detections to specific types of rules. Use this query as a template to explore your detections!
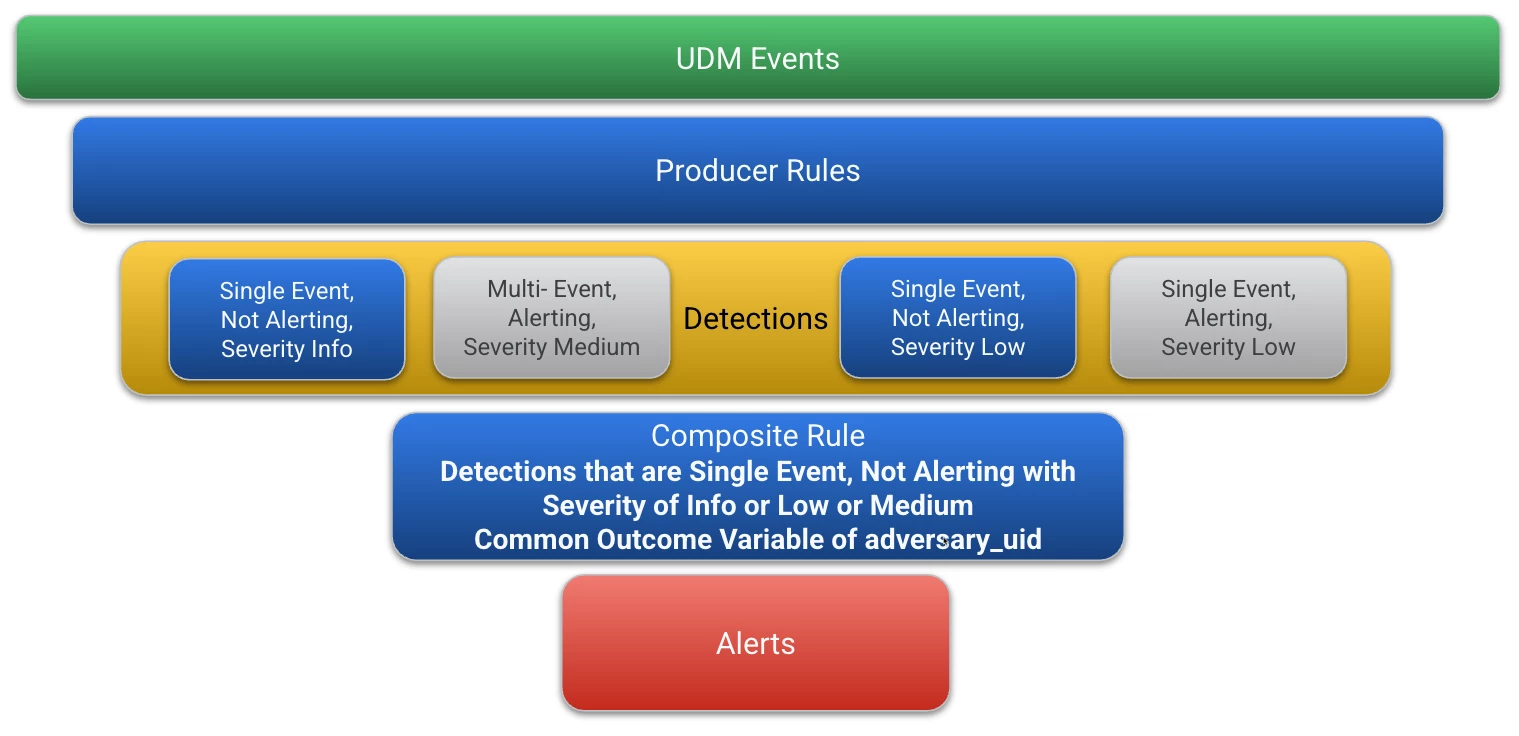
With that background, let’s use these detection descriptors to build a composite rule. Our rule will alert when we observe multiple single event detections that have not triggered an alert, have a severity of informational, low or medium and have a common outcome variable named adversary_uid.
Let’s take a look at our rule. In the events section, the first detail to draw your attention to is that we have a single event variable, $detect_prod. In the previous blog, we had three event variables, one for each detection because the criteria for each producer rule was unique. This time, all of the detections we are looking for have the same characteristics, that is, they are not alerting, single event detections with an informational, low or medium severity. Because of that, we only have one event variable which is represented in the condition section as well.
Our match variable $user, is based on a common value in our detections’ outcome variable named $adversary_uid. This is similar to what we built in the previous blog, except we used a hostname. We will be leaning in further to outcome and match variables in future blogs, so just know that we have a common outcome variable with the name of adversary_uid and all common values in that variable will be associated together based on a two hour time window.
rule composite_info_low_medium_severity_detections_by_userid {

 meta:
   author = "Google Cloud Security"
   description = "Detects multiple single event, non-alerting, medium, low or info severity rules triggering based on a common adversary uid"
   severity = "High"
   priority = "High"
   type = "composite"

 events:
   $detect_prod.detection.detection.alert_state = "NOT_ALERTING"
   $detect_prod.detection.detection.rule_type = "SINGLE_EVENT"
   (
      $detect_prod.detection.detection.severity = "INFORMATIONAL" or
      $detect_prod.detection.detection.severity = "LOW" or
      $detect_prod.detection.detection.severity = "MEDIUM"
   )
   $detect_prod.detection.detection.outcomes ["adversary_uid"] = $user

 match:
   $user over 2h

 outcome:
   $risk_score = 60
   $uniq_detection_count = count_distinct($detect_prod.detection.detection.rule_id)
   $total_detection_count = count($detect_prod.detection.detection.rule_id)
   $rules_triggered = array_distinct($detect_prod.detection.detection.rule_name)

 condition:
   $detect_prod and $uniq_detection_count > 3
}
The rule contains a few outcome variables. The two I want to highlight are $uniq_detection_count and $total_detection_count. These are using the count_distinct and count aggregation functions, respectively. We are using the $uniq_detection_count in our condition section to set a threshold for our composite rule to trigger. The reason I’m doing this is because if I only had one information, low, or medium severity detection, I really don’t want to generate an alert on that, if I’m not alerting on it as a standalone detection. So by using outcome variables and counting both unique and total detections, I have additional values that I can use to build thresholding into my detection engineering process. If I have one to three of these lower severity detections, don’t alert, but if we get more than three, let’s alert!
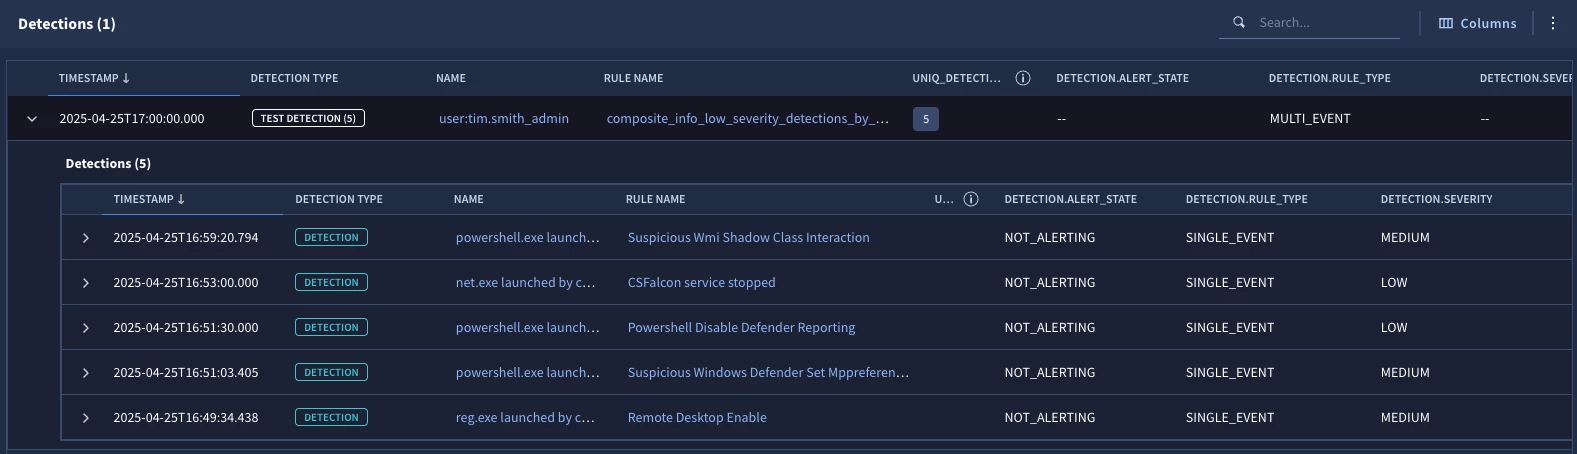
When we test our composite rule, we can see that we have five detections that have a common user, tim.smith_admin and we can use the column manager, accessed by clicking the Columns button on the right side of the image above, to select the detection fields to display.
In this blog, we used detection descriptors created by Google SecOps to build a composite rule. We used curated detections because the severity for these detections is written into the detection.detection.severity field. Keep in mind that while we showed named detections last time and detection system descriptors this time, there is no reason we can’t mix and match these into our composite rules.
In fact, for those of you who have custom rules and want to use the severity value in your rules, we will look at how labels in the meta section can be used in composite rules next time!