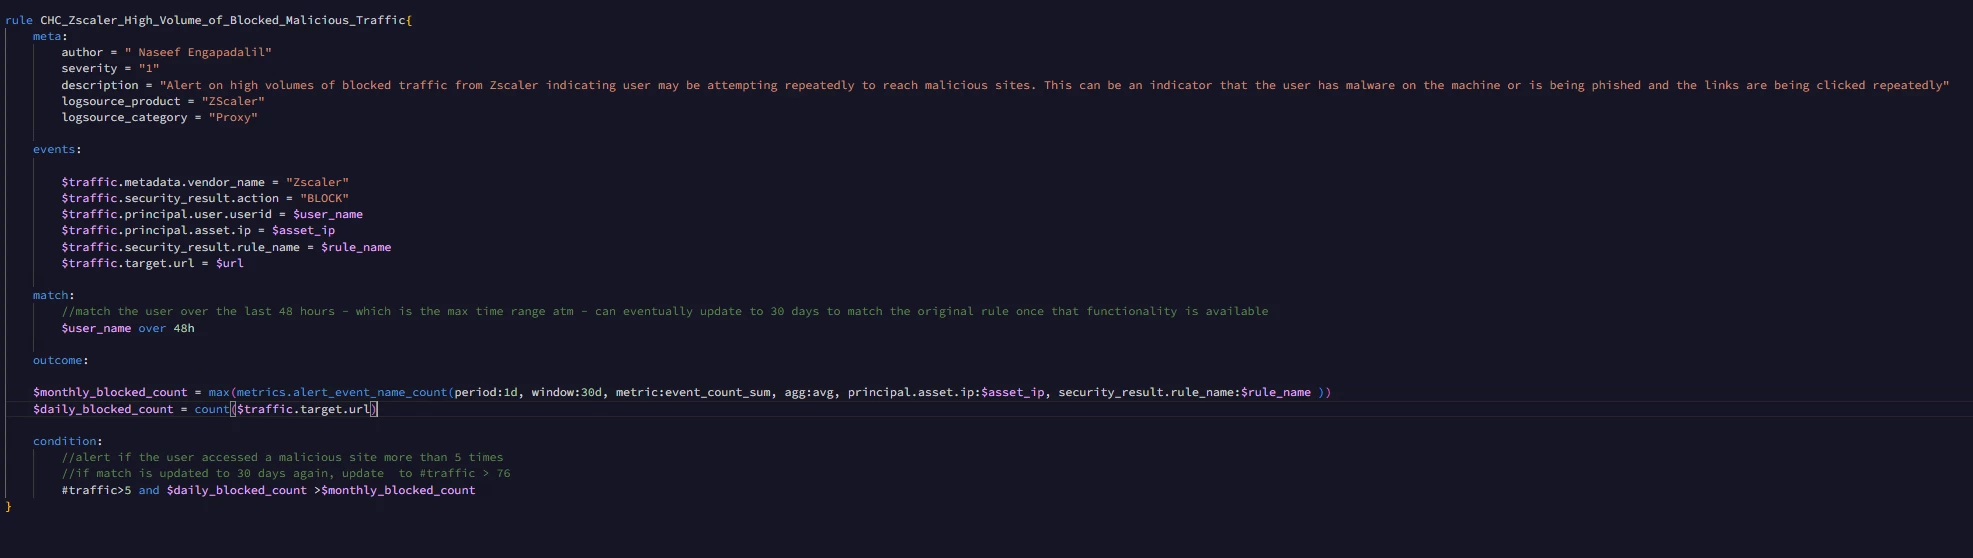
Welcome back to exploring metrics within Google SecOps. For those just tuning in, we’ve introduced the metric concept and used aggregations to build a detection in our previous blogs. Last time we focused on the metric of value_sum, which is used to create a sum of bytes in events across the metric time period and window. This is great when we are using metrics and working with bytes, but if we want to explore event counts or first and last seen, we need some additional metrics. That’s what we are going to explore today!
Let’s start by looking at our metric functions, which are found in the outcome section of our YARA-L rule. All metrics follow the same general layout. To unlock these additional metrics, we are going to modify the value next to metric: in the function and depending on the function, we may change the type of aggregation (the value next to agg: ) but we will get to that in due time.
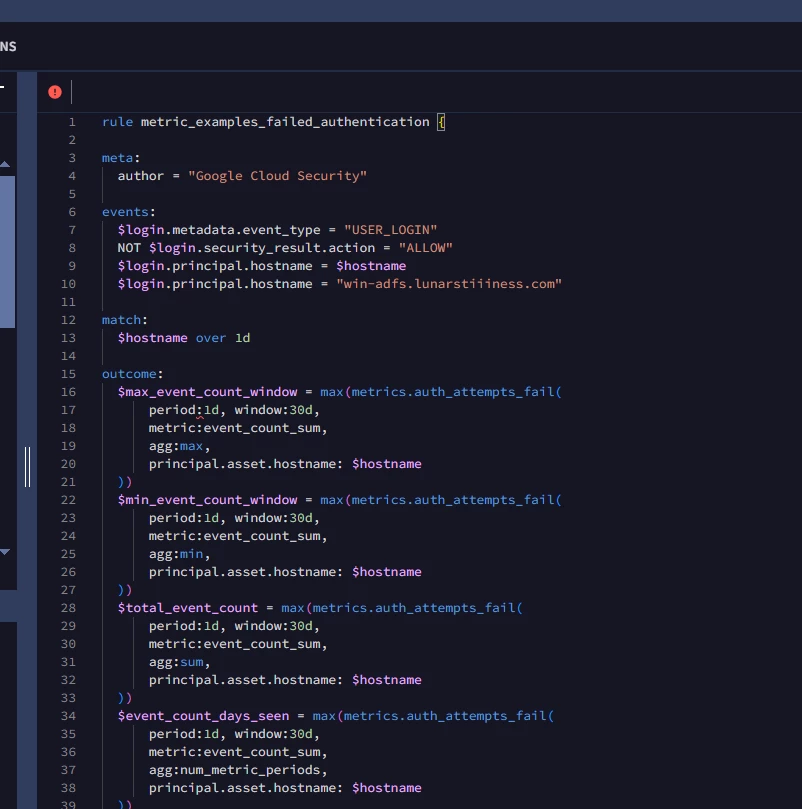
We are going to change our example and rather than focus on network metrics, we’ll look at failed authentication attempts. Our example rule is gathering user login events where the action is not allowed. This generally aligns with the metrics we are working with. Much like our network examples, we are only focusing on a single hostname and we are aggregating our UDM events over the course of a day.
rule metric_examples_failed_authentication {
meta:
author = "Google Cloud Security"
events:
$login.metadata.event_type = "USER_LOGIN"
NOT $login.security_result.action = "ALLOW"
$login.principal.hostname = $hostname
$login.principal.hostname = "win-adfs.lunarstiiiness.com"
match:
$hostname over 1d
outcome:
$max_event_count_window = max(metrics.auth_attempts_fail(
period:1d, window:30d,
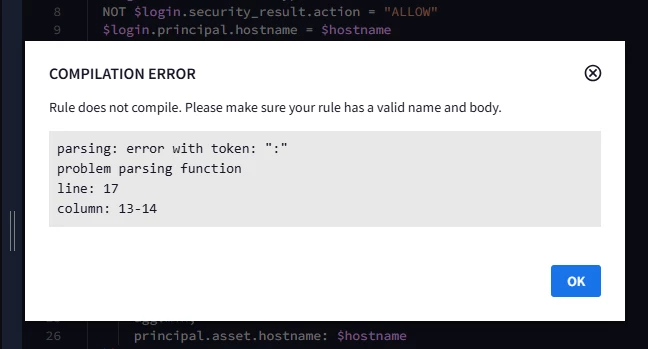
metric:event_count_sum,
agg:max,
principal.asset.hostname: $hostname
))
$min_event_count_window = max(metrics.auth_attempts_fail(
period:1d, window:30d,
metric:event_count_sum,
agg:min,
principal.asset.hostname: $hostname
))
$total_event_count = max(metrics.auth_attempts_fail(
period:1d, window:30d,
metric:event_count_sum,
agg:sum,
principal.asset.hostname: $hostname
))
$event_count_days_seen = max(metrics.auth_attempts_fail(
period:1d, window:30d,
metric:event_count_sum,
agg:num_metric_periods,
principal.asset.hostname: $hostname
))
$avg_event_count_window = max(metrics.auth_attempts_fail(
period:1d, window:30d,
metric:event_count_sum,
agg:avg,
principal.asset.hostname: $hostname
))
$stddev_event_count_window = max(metrics.auth_attempts_fail(
period:1d, window:30d,
metric:event_count_sum,
agg:stddev,
principal.asset.hostname: $hostname
))
condition:
$login
}
Our outcome section contains the same six aggregations we saw in the network metric example in our last blog, but this time our metric is set to metrics.auth_attempts_fail and our metric is set to event_count_sum which is going to count the events in each period that meet the criteria of the metric and then calculate a max, min, sum (total for the window), average, standard deviation and the number of days this activity is seen. Notice how our group by in the metric function is now principal.asset.hostname based on the placeholder value of $hostname.
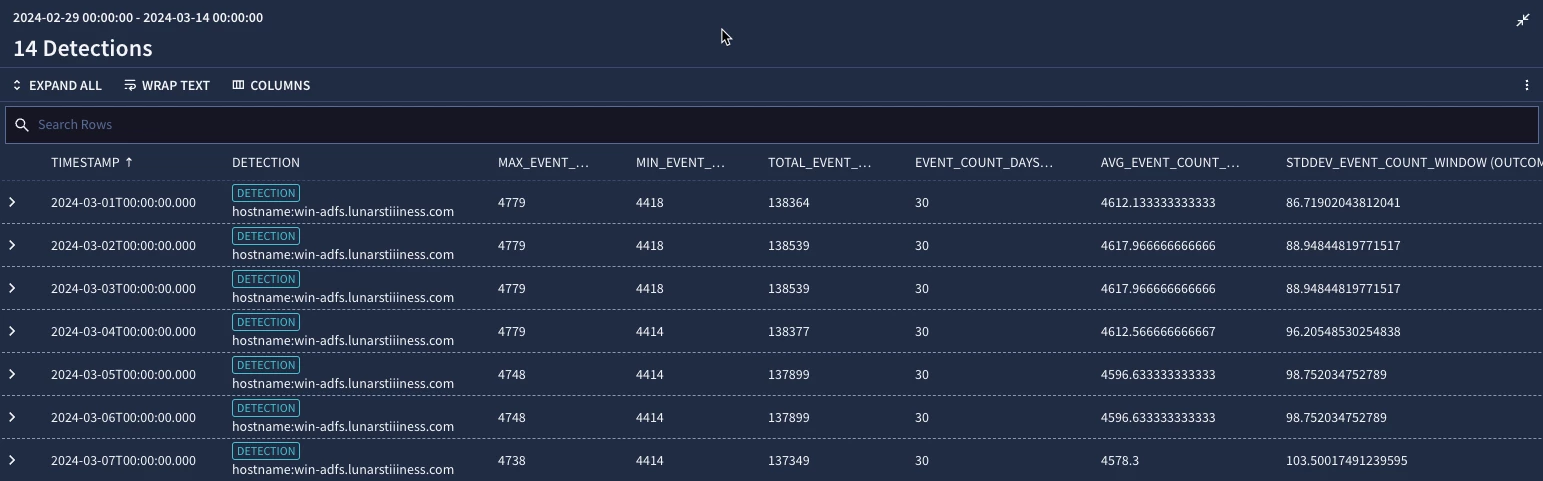
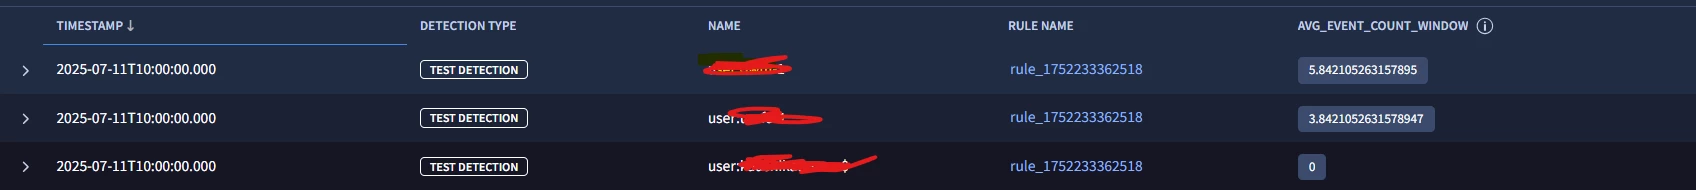
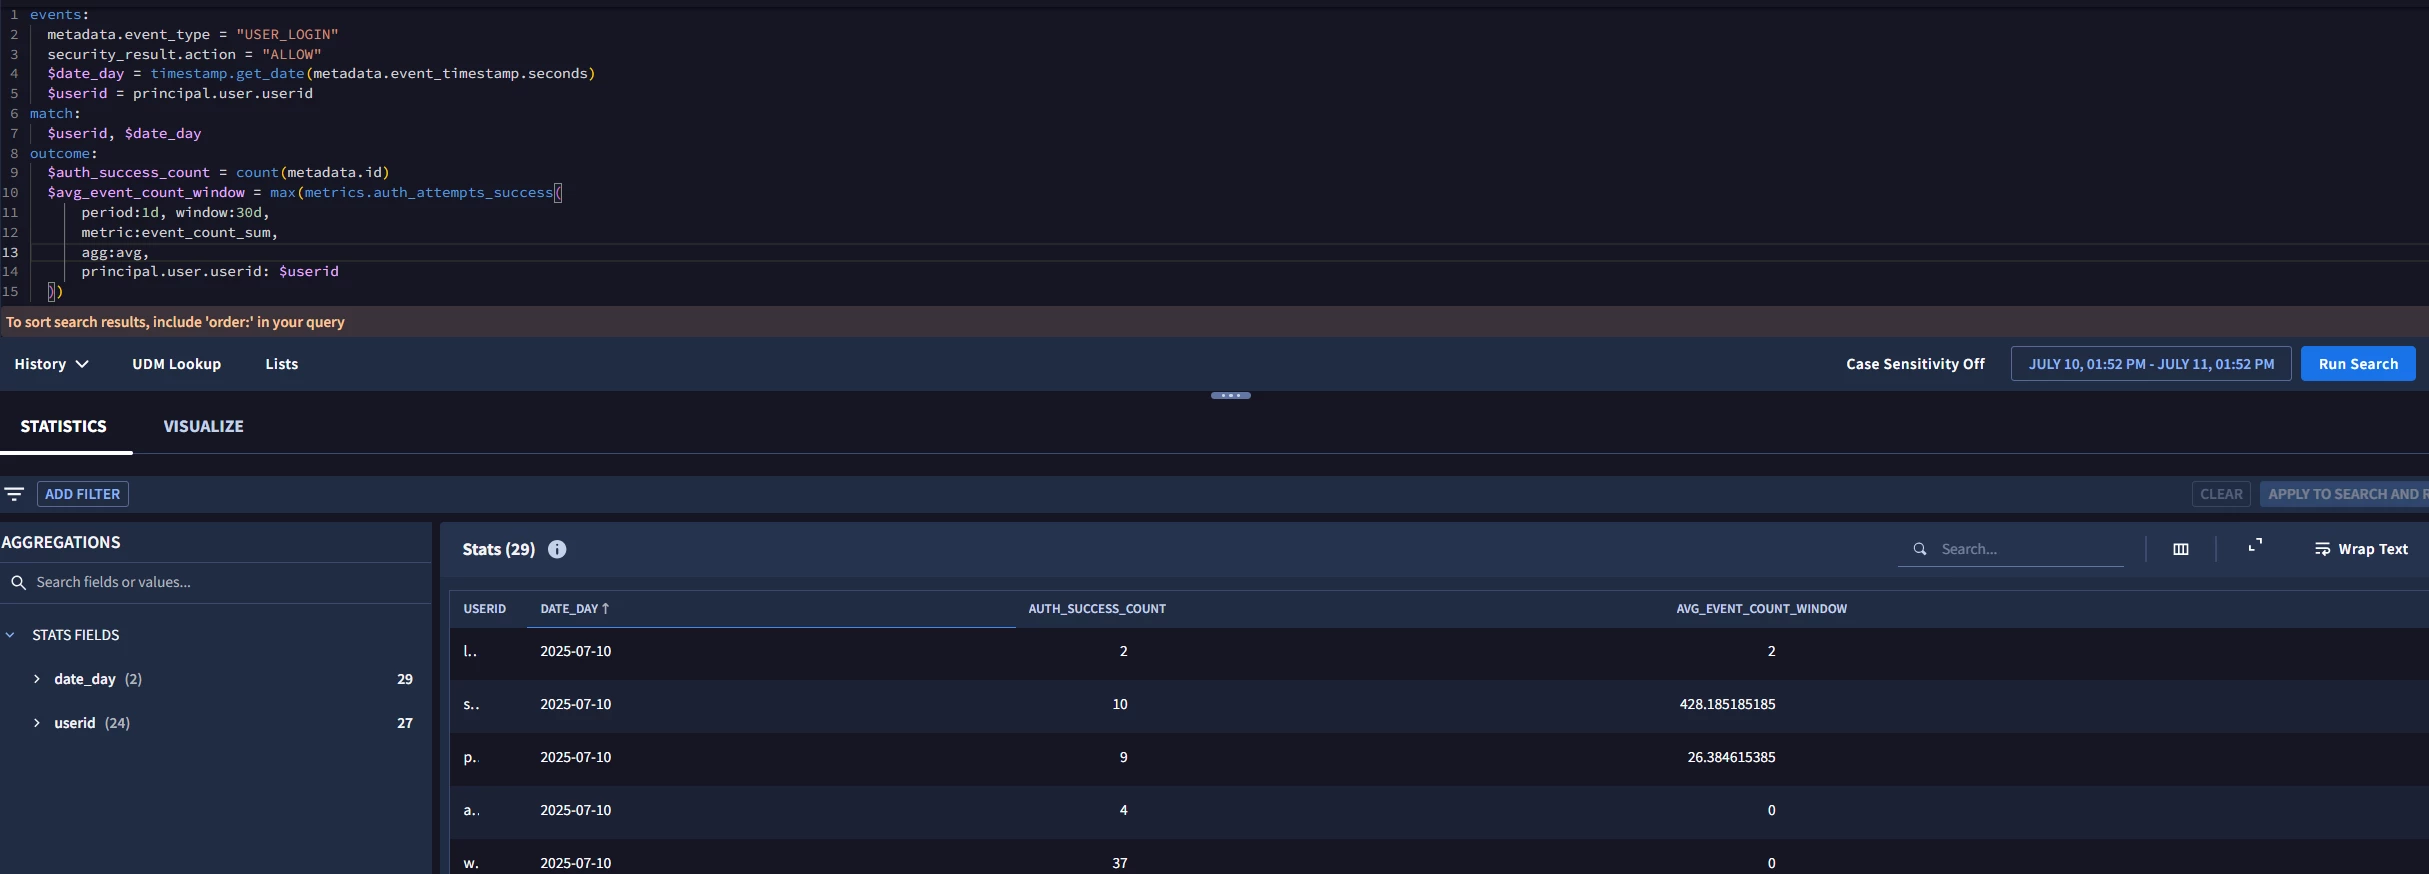
When we test our rule, we get a series of metrics, much like our byte count example, but this time our results are associated with failed authentication events over the past 30 days and their statistical measures. Notice how our max and min changed over the window.
To put these metrics to work, let’s modify our rule a bit. We’ll start by broadening our rule to identify more than one host by using a regex expression that focuses the principal.hostname to a specific domain. Otherwise the events and match sections remain the same.
rule metric_examples_failed_authentication {

meta:
  author = "Google Cloud Security"

events:
  $login.metadata.event_type = "USER_LOGIN"
  NOT $login.security_result.action = "ALLOW"
  $login.principal.hostname = $hostname
  $login.principal.hostname = /\\.lunarstiiiness\\.com$/

match:
  $hostname over 1d

outcome:
  $max_event_count_window = max(metrics.auth_attempts_fail(
      period:1d, window:30d,
      metric:event_count_sum,
      agg:max,
      principal.asset.hostname: $hostname
  ))
  $daily_failed_logins = count($login.metadata.event_type)

condition:
  $login and $daily_failed_logins > $max_event_count_window
}
Our outcome section just contains our max metric function and an outcome variable that calculates a count of failed logins for the match window. It’s worth noting that there is additional tuning that can be performed on the events section to get higher fidelity in the detections, but as we familiarize ourselves with metrics, we will keep the tuning to a minimum.
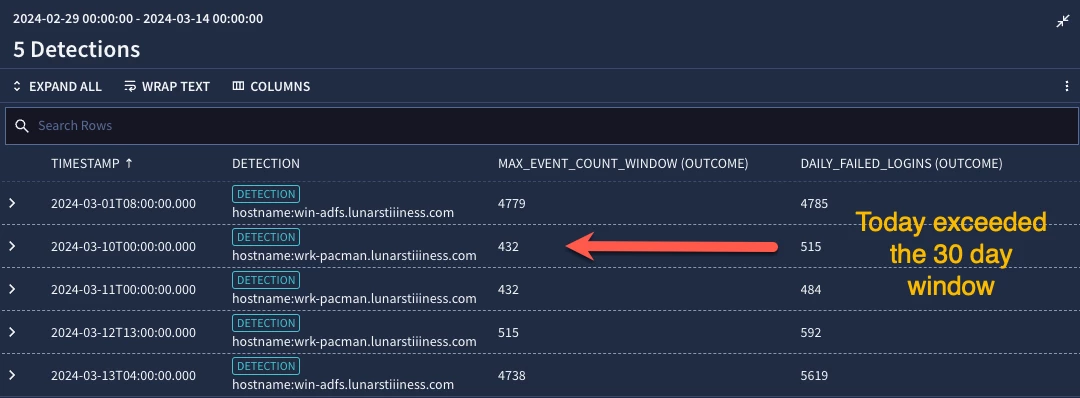
Finally, our condition section contains an additional statement that will only trigger our detection when the current day’s failed login event count exceeds the maximum of the 30 day window. Essentially, we want to know when today is exceeding the most we’ve seen in the past 30 days. When we test our rule, we can see that two systems appear to have exceeded the prior 30 day maximum, in fact they both have done that at least twice in the past two weeks, so we may want to dig into those two systems to understand why we are seeing more excessive amounts of login failures.
The event_count_sum metric is pretty straightforward, particularly if you are already comfortable with value_sum which is what we used for bytes.
Now let’s look at a few additional metrics; first_seen and last_seen. These are fairly self explanatory based on their names but are bound to the time window. Their output will be in epoch format. That also means that if we have not seen an event that aligns to a metric within the 30 day window, the value would be 0. One additional note about this. When using the metric first_seen, the aggregation should be min and for last_seen, the aggregation should be max.
$first_seen_login_window = max(metrics.auth_attempts_success(
      period:1d, window:30d,
      metric:first_seen,
      agg:min,
      target.user.userid: $userid
  ))
$last_seen_login_window = max(metrics.auth_attempts_success(
      period:1d, window:30d,
      metric:last_seen,
      agg:max,
      target.user.userid: $userid
  ))
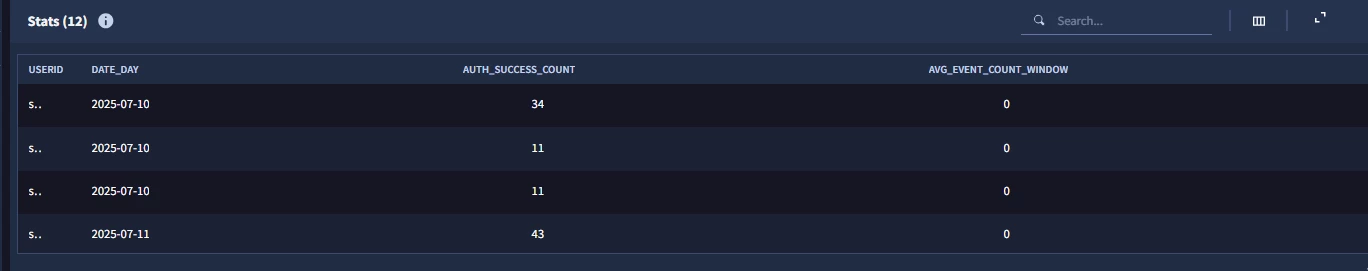
Notice when we test our rule, we get our detections with our epoch times in our outcome variables.
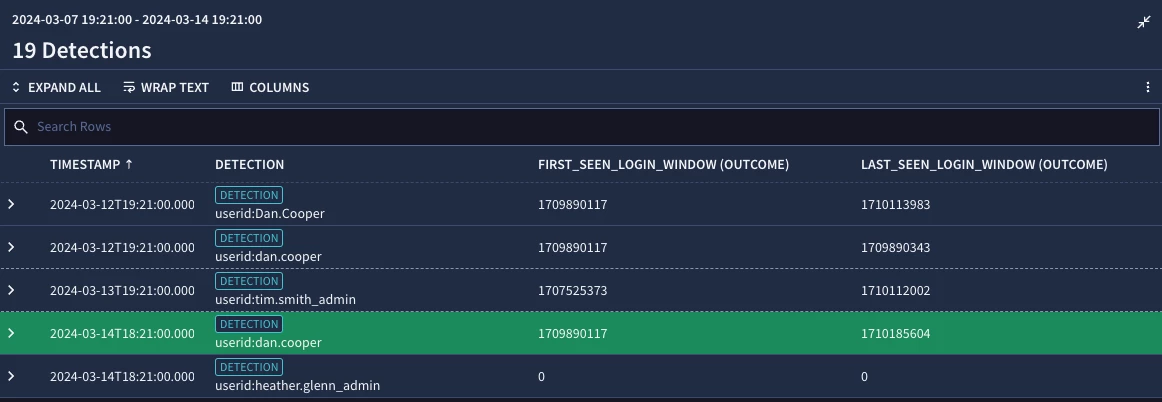
Let’s apply these concepts to a detection like first seen logon events. We will use the metric associated with successful authentications and generate a detection if this is the first time we are seeing that user login. Since the window is 30 days, we may have previously had a metric for first seen but if it is outside of that 30 day window, we won’t have one and therefore our result would be zero. It’s worth noting that in this example we are just looking at a metric that is based on the user login, not the user login on a specific system or a specific application, that’ll come later (how’s that for foreshadowing!)
The events section of our rule has criteria for successful login events and we added some additional criteria to remove system accounts and to handle user logins with mixed case versus lower case. This is the kind of tuning that you may find yourself doing with your rules, so hopefully these tips and tricks are helpful!
rule metric_examples_success_authentication {

meta:
  author = "Google Cloud Security"

events:
  $login.metadata.event_type = "USER_LOGIN"
  $login.security_result.action = "ALLOW"
  $login.target.user.userid != /\\$$/
  strings.to_lower($login.target.user.userid) = $userid
  $login.principal.hostname = /\\.lunarstiiiness\\.com$/
  $login.target.user.company_name = "LunarS"

match:
  $userid over 1d

outcome:
  $first_seen_login_window = max(metrics.auth_attempts_success(
      period:1d, window:30d,
      metric:first_seen,
      agg:min,
      target.user.userid: $userid
  ))
  $systems_accessed = array_distinct($login.principal.hostname)

condition:
  $login and $first_seen_login_window = 0
}
Our metric function in the outcome section is calculating the first_seen metric for the target.user.userid. Additionally, we added another outcome variable to capture the systems the logins are associated with. Finally, in the condition section, we specified that our $first_seen_login_window value is 0, that is we have not seen a successful login from this user during our window before.
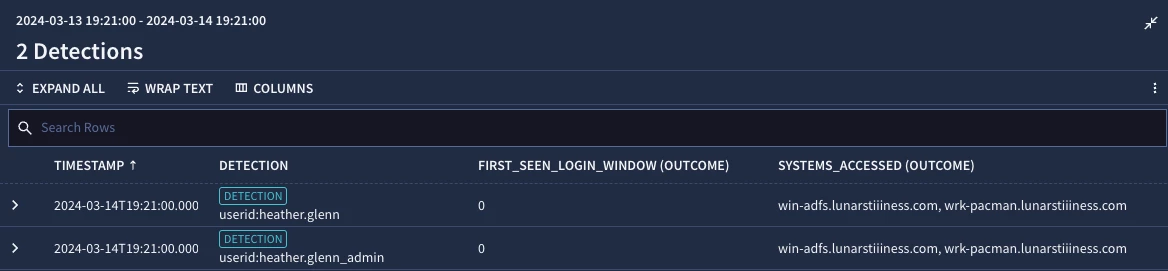
When we test our rule, we can see that both heather.glenn and heather.glenn_admin successfully logged into win-adfs and wrk-pacman for the first time within our 30 day window. If we haven’t seen a specific user logging into specific systems before, perhaps that suspicious behavior is something we need to look into.
This blog introduced three additional metrics to our function, event_count_sum, first_seen and last_seen. We were able to use these metrics to identify suspicious activity within authentication activities but remember there are more metrics that these concepts can be applied to. Our next blog will get into the final section of the metric function which is the grouping and filtering components.