

Author:
Simone Bruzzechesse, Strategic Cloud Engineer @ Google Cloud Security
In any modern SOC, data is the lifeblood of threat detection and incident response. If a critical log source silently stops sending data, or if an API integration supporting your SIEM automation or ingestion layer starts failing, your SOC is suddenly operating with blind spots.
With Google Security Operations being deeply integrated into the Google Cloud ecosystem, security teams can leverage the native capabilities of Google Cloud Monitoring to track the health of both their data ingestion pipelines and their API integrations.
In this article, we’ll explore how you can use Cloud Monitoring to create alerting policies and custom dashboards using the telemetry available in your linked Google SecOps project. We will also introduce a Terraform-based automation available in secops-toolkit to help you deploy these observability resources “As Code”. If you are interested in digging deeper into Google Logging and Cloud Monitoring I definitely recommend this article on how to use Google’s Logging and Monitoring MCP servers for Google SecOps.
Overview of Cloud Monitoring and Alerting
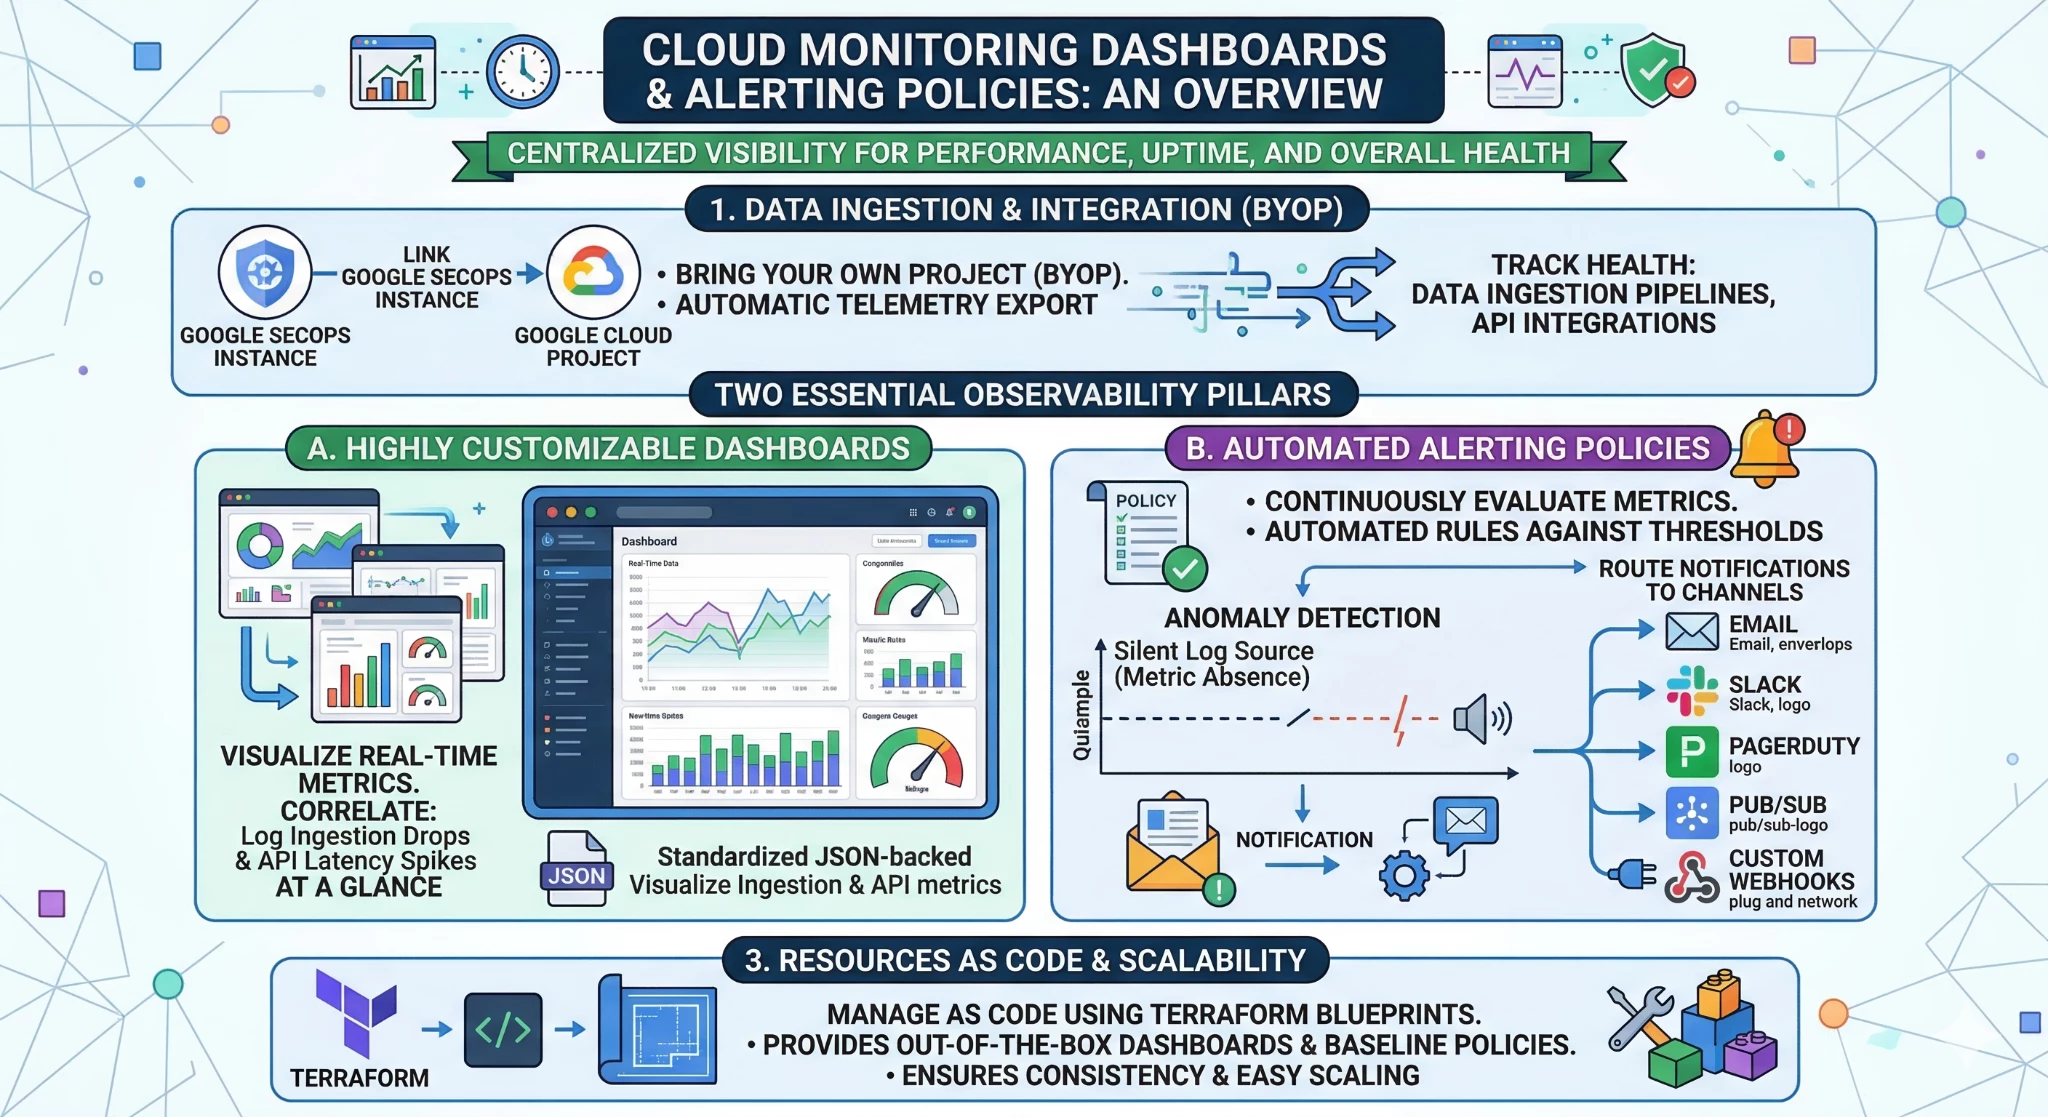
Google Cloud Monitoring provides centralized visibility into the performance, uptime, and overall health of cloud-powered applications and infrastructure. By linking your Google SecOps instance to a Google Cloud Project, a feature known as Bring Your Own Project (BYOP), critical operational telemetry is automatically exported to Cloud Monitoring.
This integration allows security teams to leverage native Google Cloud capabilities to track the health of both data ingestion pipelines and API integrations. Within Cloud Monitoring, you can build two essential observability pillars for your SecOps environment:
-
Dashboards: Highly customizable visual planes that display real-time metrics, allowing you to correlate log ingestion drops with API latency spikes at a glance. Standardized JSON-backed dashboards can visualize both ingestion and API metrics.
-
Alerting Policies: Automated rules that continuously evaluate metrics against specific thresholds or detect metric absences. When an anomaly occurs, such as a silent log source, Cloud Monitoring can route notifications to various channels, including Email, Slack, PagerDuty, Pub/Sub, or custom Webhooks.
The following sections provide a detailed guide on configuring observability for your Google SecOps environment. We will first explore the manual configuration of Cloud Monitoring dashboards and alerting policies through the Google Cloud console, and subsequently, how to achieve the same results at scale using automated Terraform code.
Data Health Metrics for Google SecOps
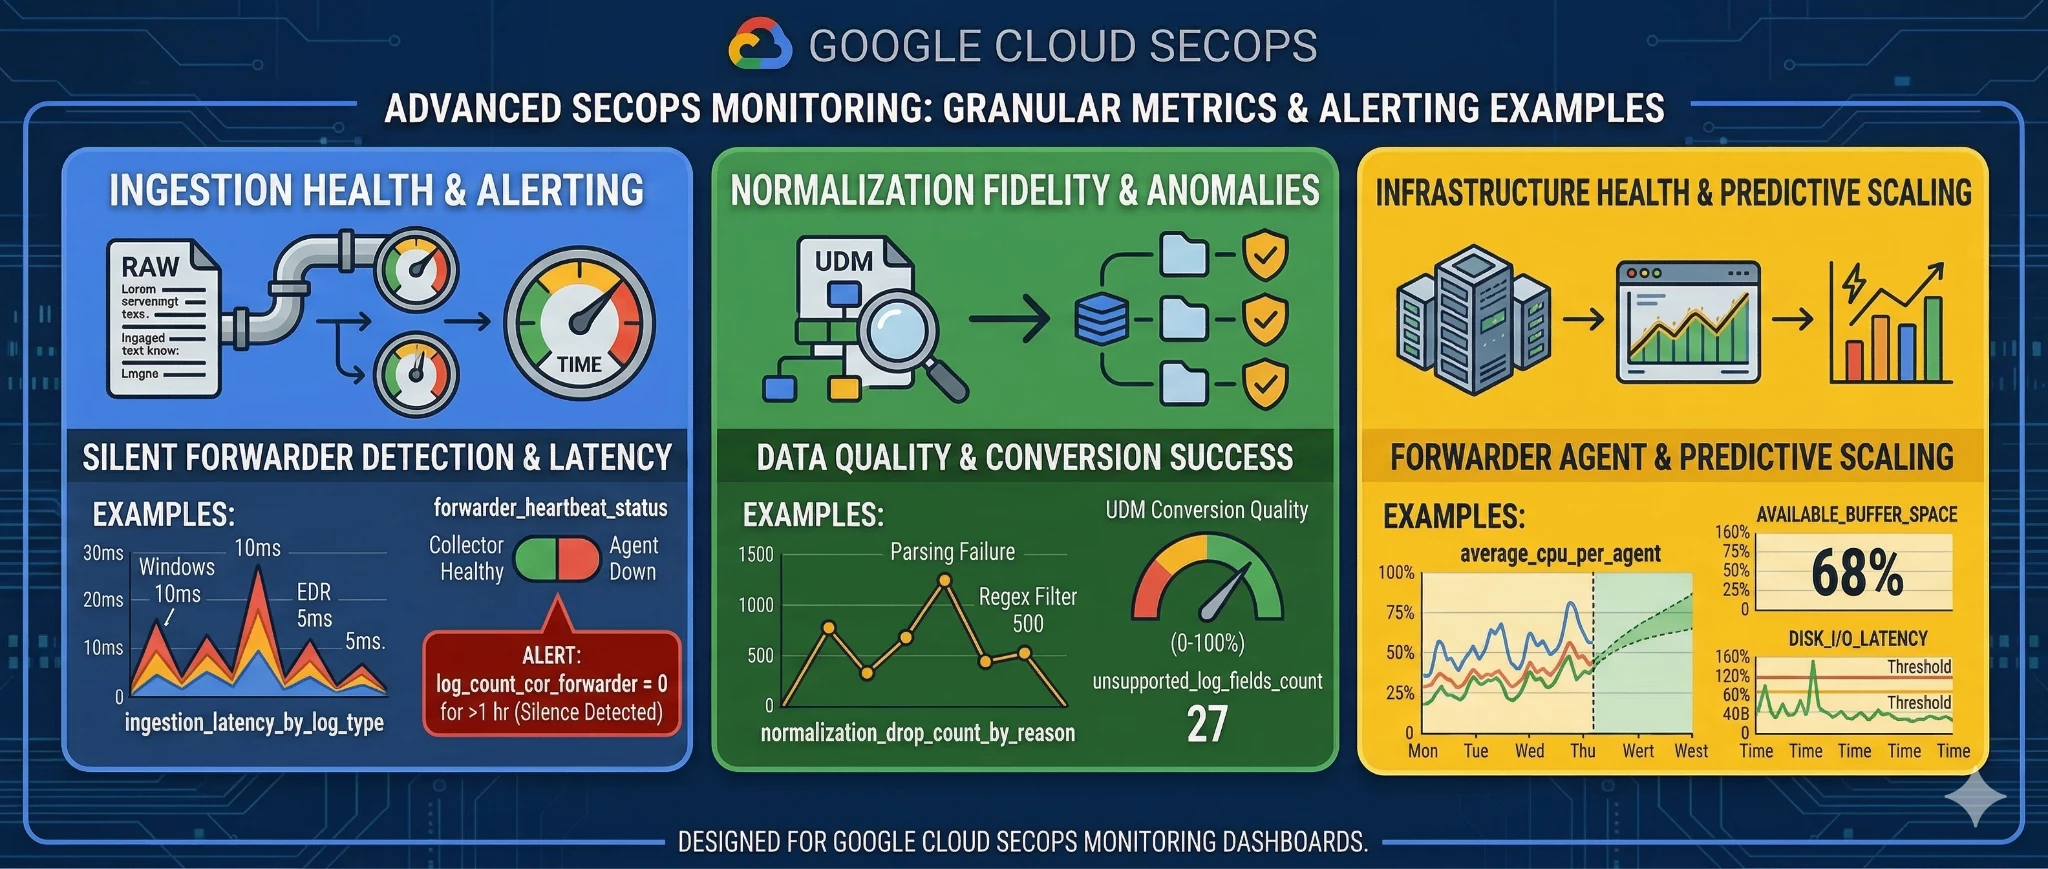
Maintaining visibility into log source health is critical; a silent log source represents a significant security blind spot. Google SecOps addresses this by exposing granular ingestion, normalization, and agent-level telemetry directly to Cloud Monitoring. These metrics allow SOC teams to proactively identify parsing errors, stalled data feeds, and infrastructure bottlenecks.
Based on the Google Cloud Monitoring Metrics documentation, the telemetry data automatically exported to your linked GCP project for Google SecOps uses the chronicle.googleapis.com/ prefix. The documentation outlines several different types of metrics for SecOps available within the GCP project, which broadly fall into the categories available in the following infographic and detailed later in this section.
1. Collector and Ingestion Volume Metrics
These metrics allow you to track the raw throughput and overall health of logs being routed into your SecOps instance from various forwarders and collection methods:
-
Ingested log size (ingestion/log/bytes_count): The total size (in bytes) of the logs ingested. This metric is especially critical for tracking whether your data sources are being properly ingested in SecOps or drop in logs being received as well as when ingestion volume is approaching or exceeding your tenant's ingestion burst limits.
-
Ingestion Health Status (ingestion/is_unhealthy): A health state indicator for different ingestion sources, such as Native GCP ingestion, Azure Event Hubs, HTTPS Push or Bindplane agents.
2. Normalizer Metrics
Once raw data reaches Google SecOps, it must be successfully parsed and converted into the Unified Data Model (UDM):
-
Normalized Log and Events Record Count (normalizer/log/record_count normalizer/event/record_count): The total number of logs and corresponding events successfully generated after parsing. By comparing your raw ingested volume against the normalized event count, SOC engineers can instantly detect if an upstream change to a log format has broken their SecOps parsers.
-
Parsing Health Status (normalizer/is_unhealthy) The status of log parsing ratio per logtype.
3. Out-of-Band and Feed Metrics
For data feeds integrated directly via the Google SecOps platform (such as third-party API pull mechanisms):
-
Out-of-band Record Count (outofband/log/record_count): The total count and size of records transferred specifically for out-of-band feeds created using the Feed Management API.
4. Agent Health
To maintain the operational integrity of your on-premise or cloud-based collection infrastructure, SecOps exposes underlying system telemetry for its Bindplane collection agents:
-
Agent CPU & Memory: Metrics such as agent/cpu_seconds track the total CPU time consumed by the Bindplane agent process, alongside memory utilization tracking for the collection agent.
-
Exporter Telemetry: Metrics like agent/exporter_queue_capacity, agent/exporter_queue_size, and agent/exporter_accepted_spans_count allow infrastructure teams to monitor the internal capacity of the exporter queue.
By leveraging these different metric types natively within your GCP project, your security team can build highly targeted PromQL queries or Cloud Monitoring alerting policies, ensuring that silent hosts, stalled feeds, and parser failures are detected within minutes rather than hours or days.
SecOps API Metrics
The Google SecOps platform provides robust APIs (chronicle.googleapis.com) to manage cases, run UDM searches, operate detection rules and orchestrate automated response playbooks. Because these endpoints operate as standard Google Cloud APIs, their telemetry is automatically tracked within your GCP project, typically under the consumed_api monitored resource type. Although Chronicle APIs are accessible to all SecOps clients utilizing a BYOP project, maximizing the utility of the API for SOAR endpoints requires a successful API migration. This process is part of the SOAR Phase 2 migration, which is described in detail on this documentation page.
Based on the official Google Cloud documentation for Service Runtime metrics, the following serviceruntime.googleapis.com metrics are available to monitor the health, performance, and quota consumption of your Chronicle APIs in the Google Cloud project linked to SecOps.
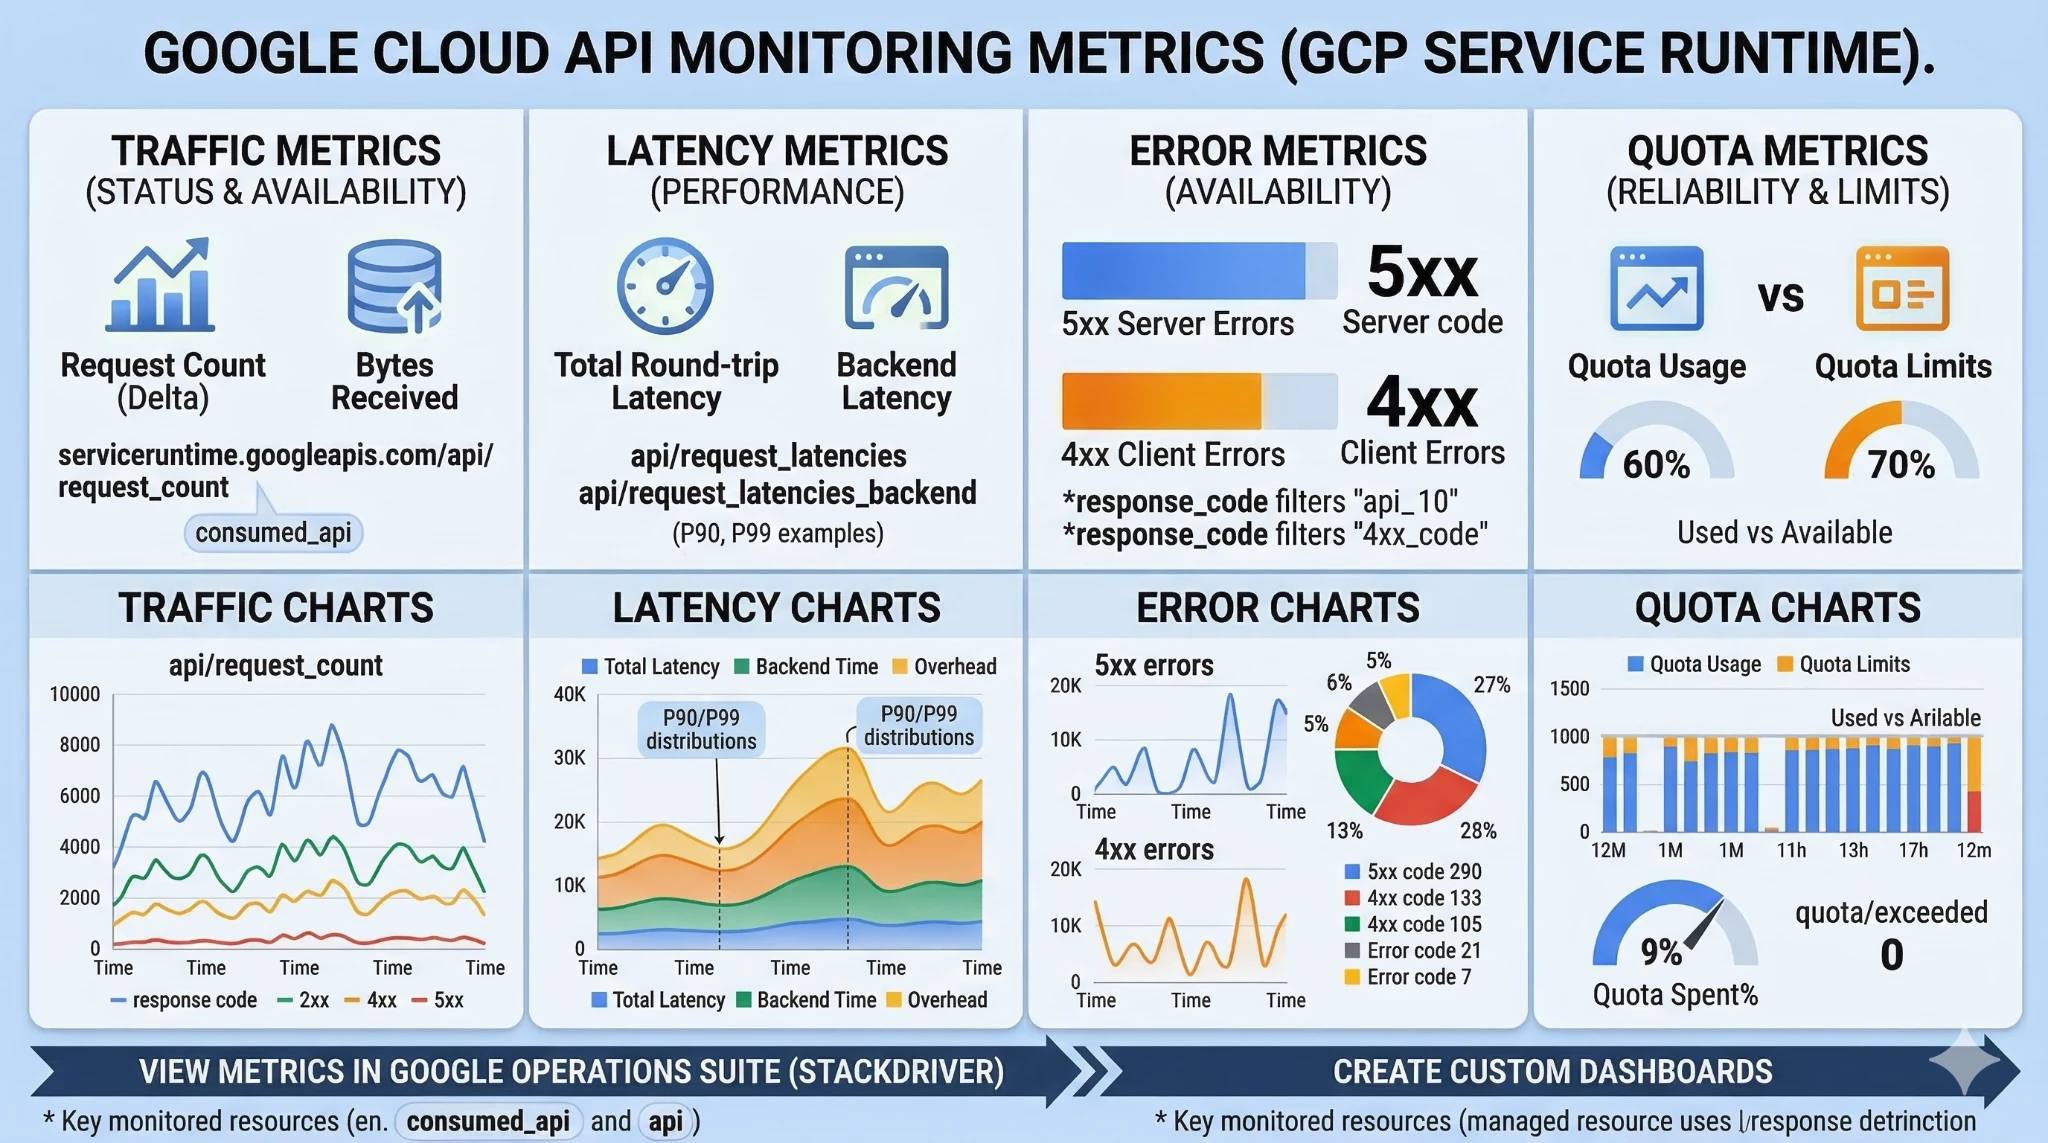
1. API Traffic and Performance Metrics
These metrics track request volume, response codes, latencies (total, backend, and overhead), and request/response sizes. They are essential for monitoring the stability of integrations, identifying bottlenecks in SecOps workflows, and troubleshooting authentication or ingestion quota API errors.
-
serviceruntime.googleapis.com/api/request_count: The total number of API requests made. You can filter and group this by response_code (e.g., 200 vs 4xx/5xx) or by specific API method to monitor for failing playbooks, authentication errors, or broken integrations.
-
serviceruntime.googleapis.com/api/request_latencies: The total distribution of request latencies. This is incredibly useful for identifying bottlenecks in third-party SOAR integrations that might be executing complex or poorly optimized UDM searches.
-
serviceruntime.googleapis.com/api/request_latencies_backend: The specific backend latency of API requests (the time it takes for the SecOps backend itself to process the request).
-
serviceruntime.googleapis.com/api/request_latencies_overhead: The overhead latency distribution for API requests (the time spent routing the request, excluding backend processing time).
-
serviceruntime.googleapis.com/api/request_sizes: The distribution of sizes (in bytes) for the request payloads sent to the API.
-
serviceruntime.googleapis.com/api/response_sizes: The distribution of sizes (in bytes) for the data returned by the API.
2. API Quota Metrics
These metrics monitor your usage against configured limits, including current allocation usage, the rate of net usage, and the count of "quota exceeded" errors. Tracking these is critical for ensuring that automated scripts and integrations do not fail due to rate limits.
-
serviceruntime.googleapis.com/quota/allocation/usage: The current allocation quota usage for the API.
-
serviceruntime.googleapis.com/quota/exceeded: The count of "quota exceeded" errors. Setting an alert on this metric is highly recommended to instantly catch when scripts or integrations are blocked due to rate limits.
-
serviceruntime.googleapis.com/quota/limit: The maximum configured quota limit for your specific API usage.
-
serviceruntime.googleapis.com/quota/rate/net_usage: The rate of quota net usage over time.
By tracking these service runtime metrics—and filtering them specifically for the chronicle.googleapis.com service—your SOC engineering team can ensure that the orchestration pipelines relying on SecOps data remain highly available, performant, and within operational limits.
Getting started with a Sample Dashboard and Alert
In this section, we will provide a comprehensive, step-by-step guide to the manual configuration of a sample Cloud Monitoring dashboard and a sample Alerting Policy. This practical walkthrough leverages Google SecOps ingestion metrics to demonstrate how security teams can gain immediate visibility into their log telemetry health. By the end of this exercise, you will have a functional visualization of your ingestion data and an automated notification system to alert you of potential service disruptions.
Cloud Monitoring custom dashboard for Google SecOps
To create your first custom SecOps Observability dashboard, start by navigating to the Google Cloud console, selecting your BYOP project, and searching for “Monitoring” to open the Dashboards page. In the Dashboards page, click “Create custom dashboard”. To add widgets to your dashboard, do the following:
-
In the dashboard toolbar, click add Add widget.
-
In the Add widget pane, select a widget to add to your dashboard.
You can select a widget based on the type of data to display or how you want to display the data. In all cases, a configuration pane is opened. For example, you can select the Metric widget and then set the visualization to Stacked area. Or, you can select the Stacked area widget and then select the metric.
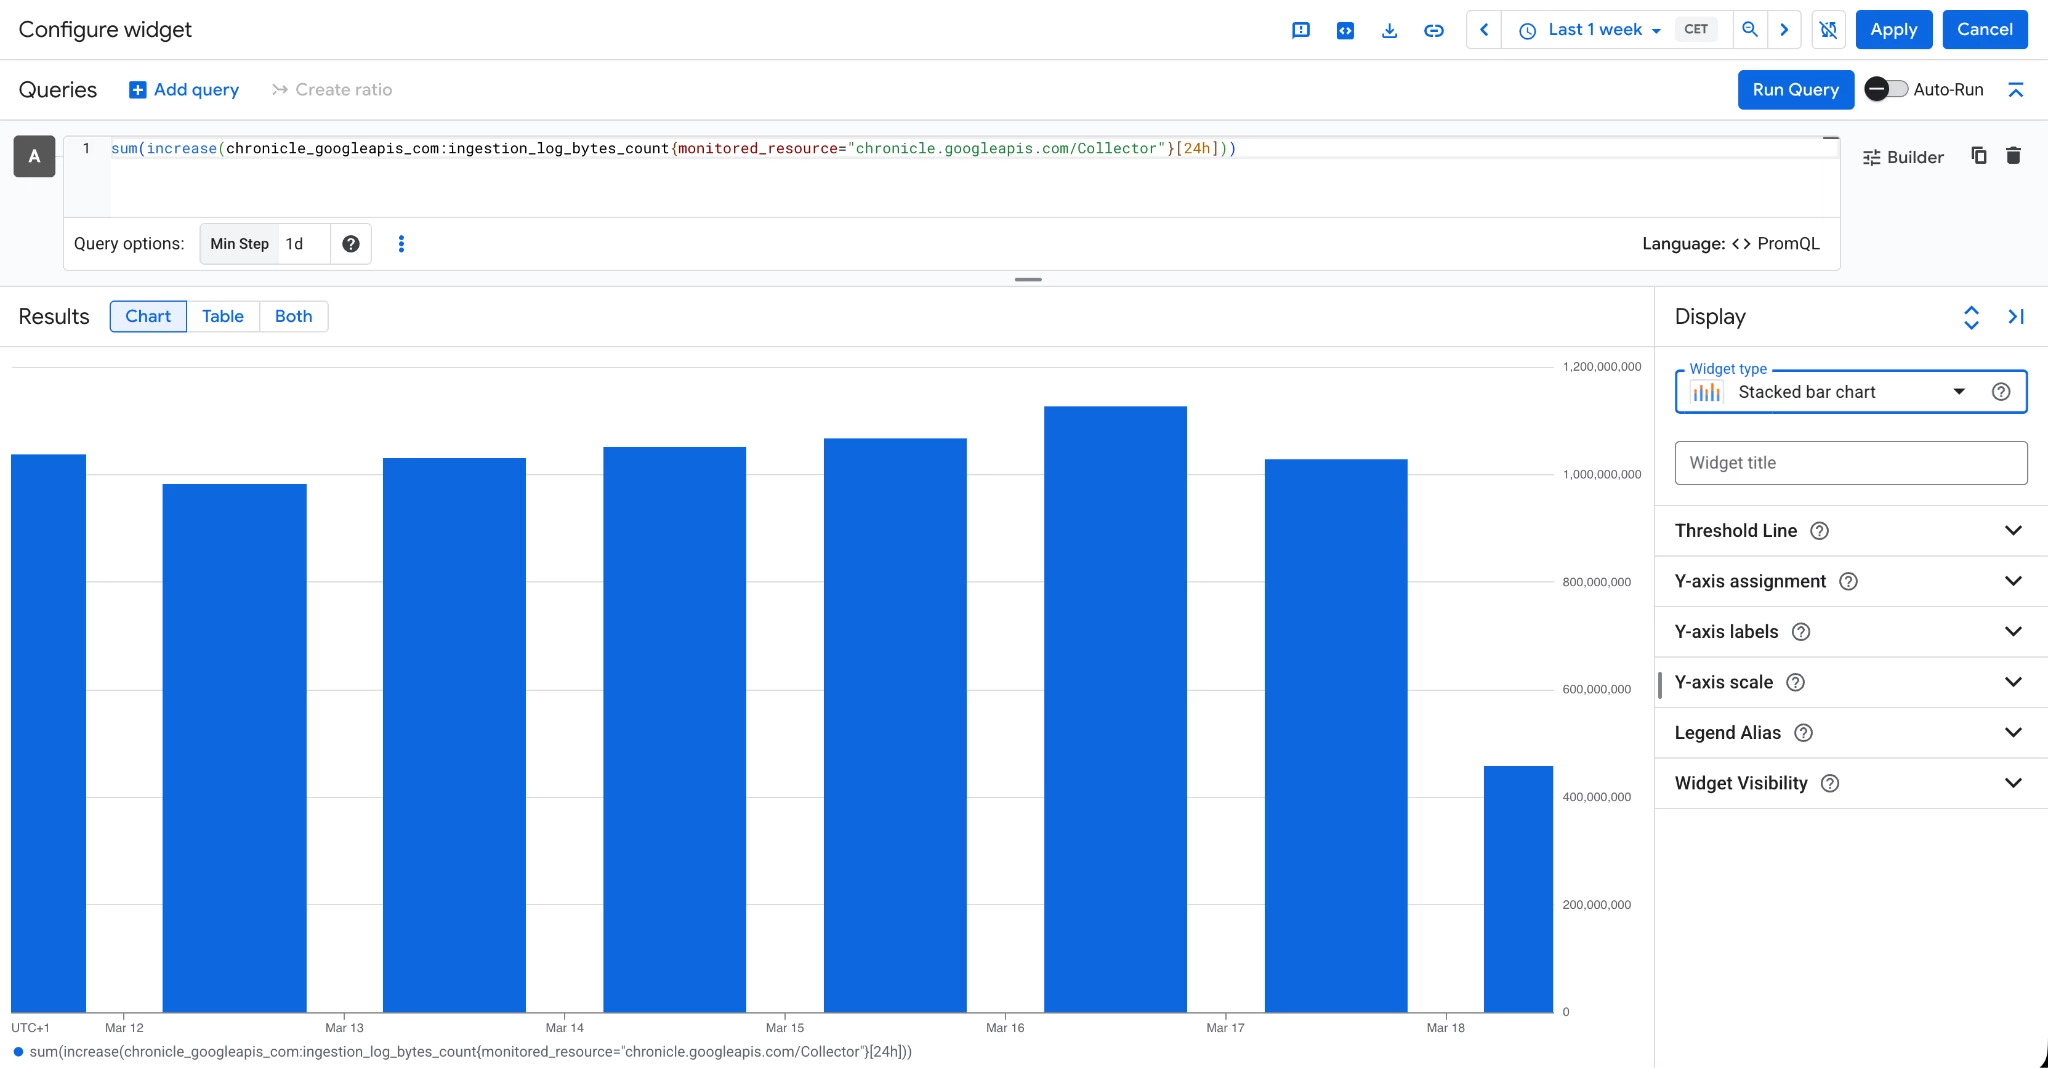
Configure the widget, switch the editor mode to PromQL and paste the following query:
sum(increase(chronicle_googleapis_com:ingestion_log_bytes_count{monitored_resource="chronicle.googleapis.com/Collector"}[24h]))
Then underneath the query, in the Query Options click on the empty space on the right of Min Step and select “1d”, if you previously selected the stacked bar you should see a widget similar to the following one:
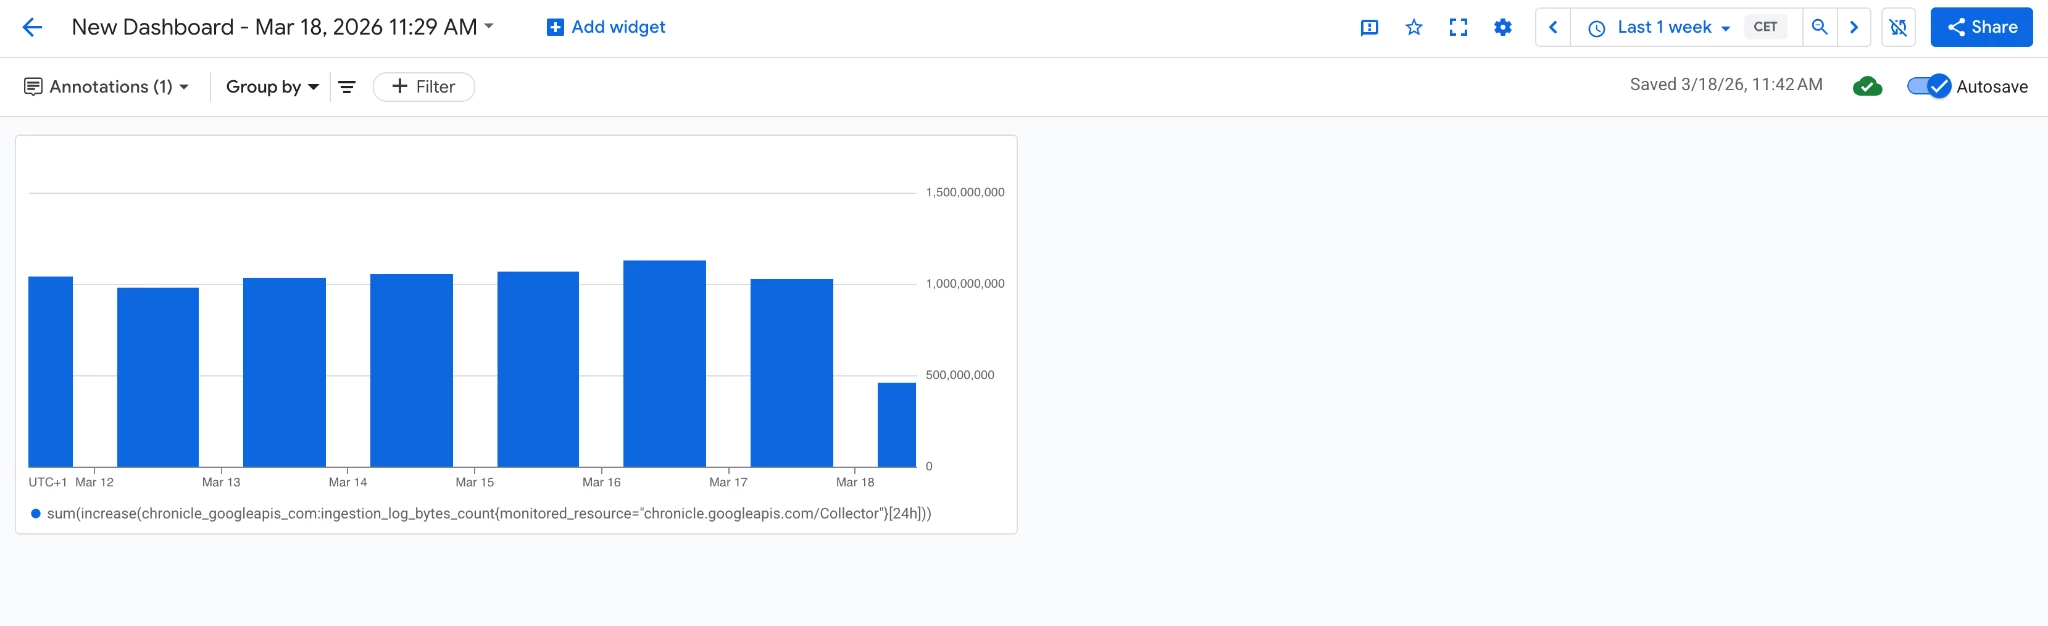
Then clicking “Apply” the following dashboard should be configured and automatically saved:
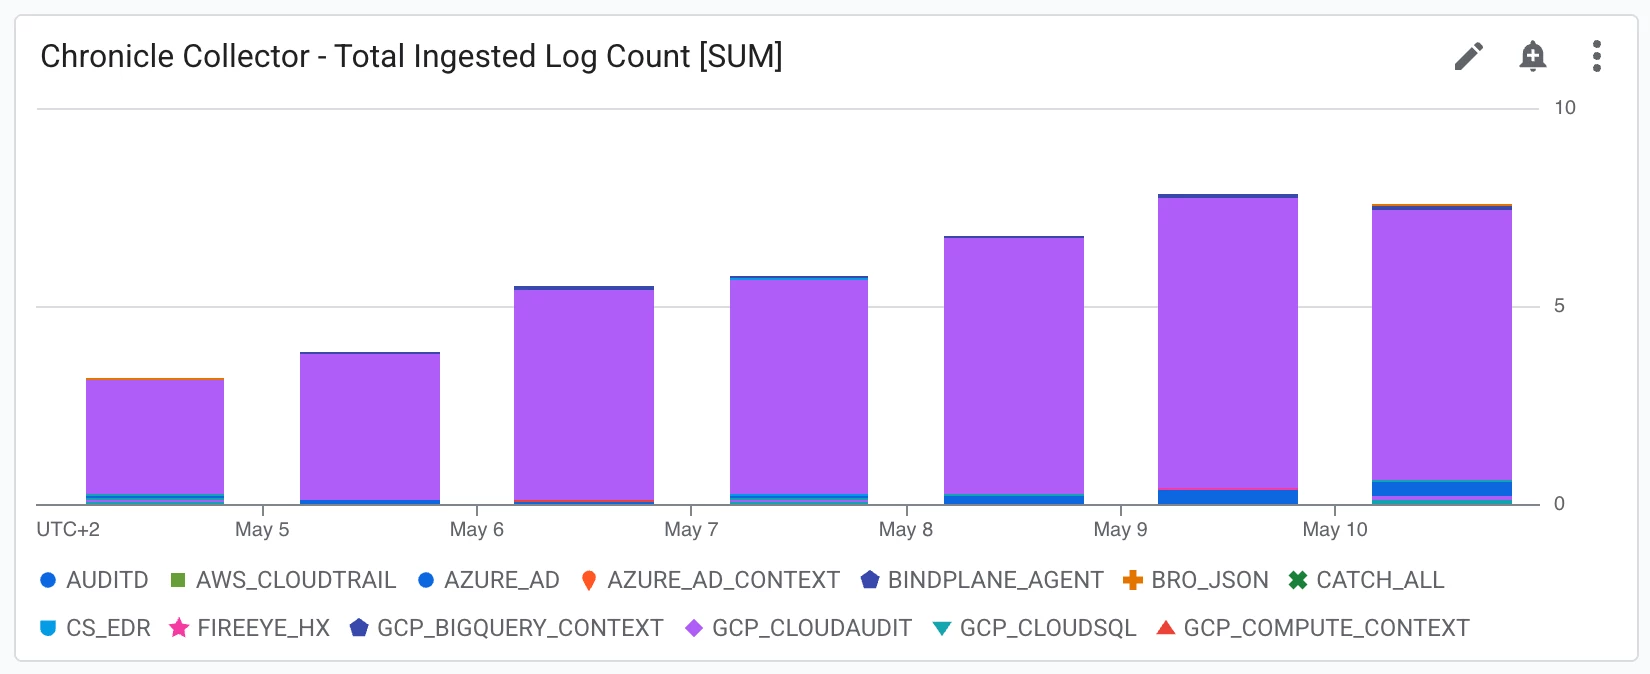
If you want to visualize the log ingested on a per log_type basis please update the query with the following one:
sum by ("log_type",${__groupby})(rate({"__name__"="chronicle.googleapis.com/ingestion/log/record_count","monitored_resource"="chronicle.googleapis.com/Collector"}[${__interval}]))
And the widget will be updated as follows:
Once all widgets are arranged to your preference, click Save in the dashboard toolbar (or ensure Autosave is enabled) to finalize your SecOps Dashboard. After creating the first observability dashboard we move on to the next sample configuration about Alerting policy for Google SecOps.
Sample Alerting Policy for Google SecOps
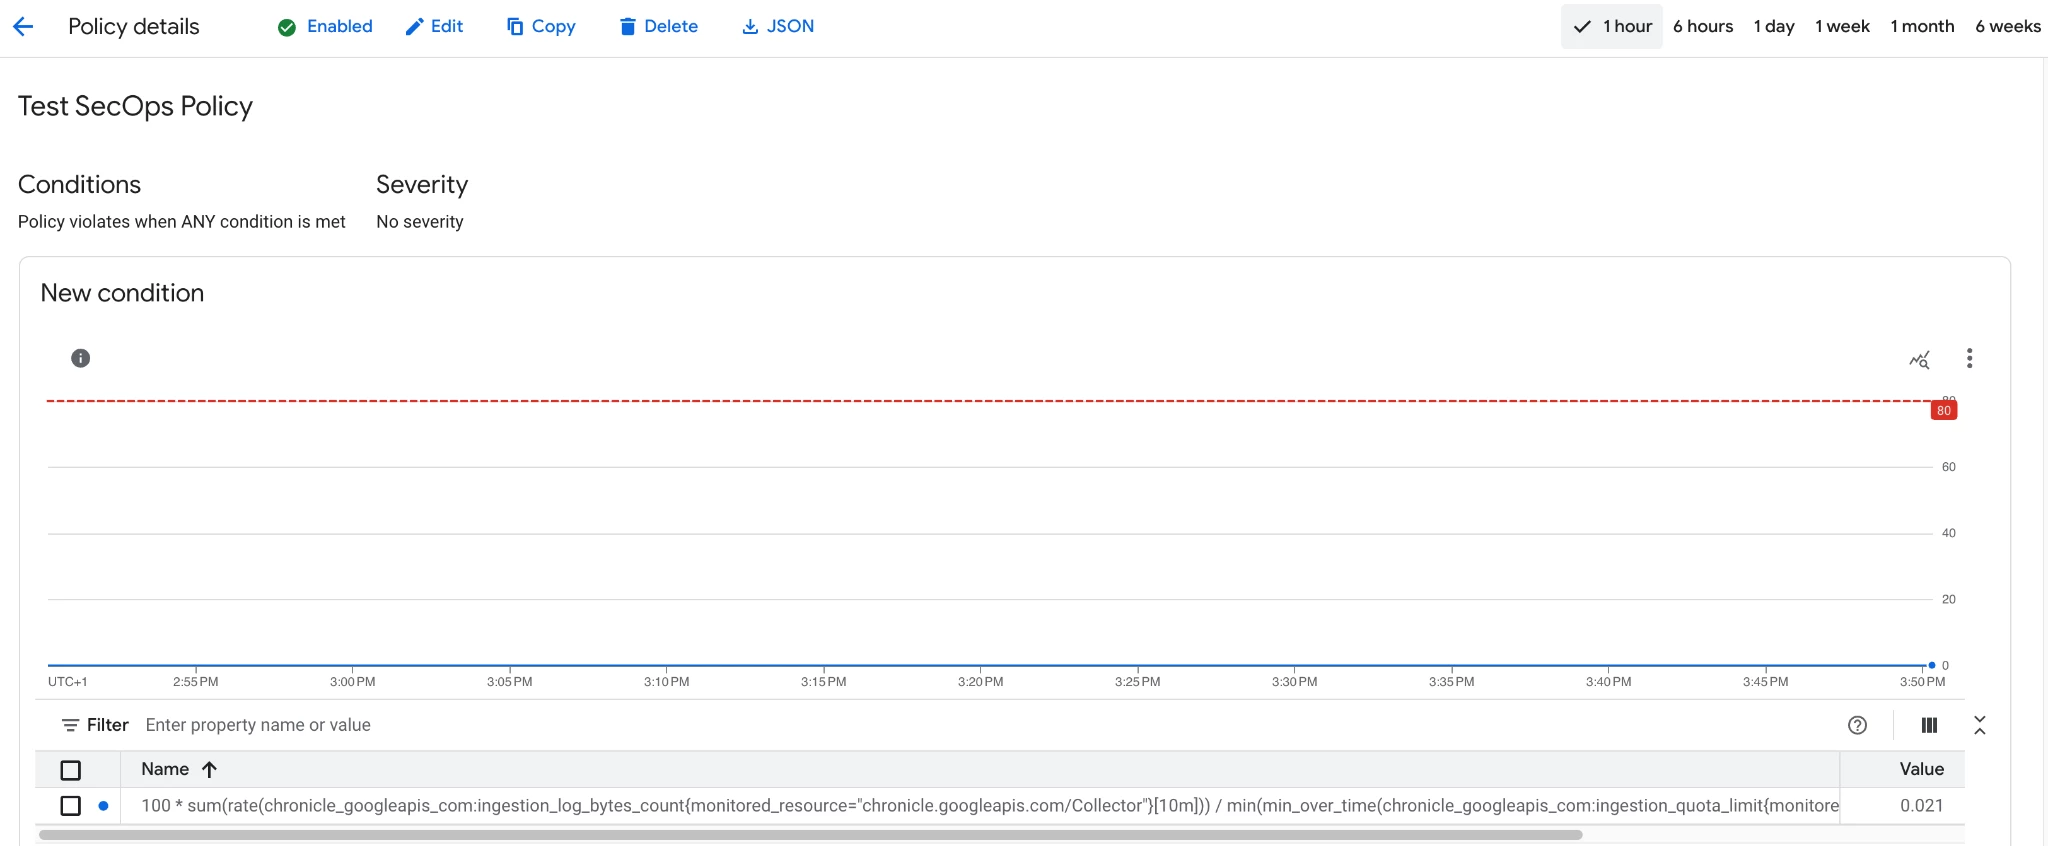
The sample alert policy we are about to set up will leverage the ingestion metrics available in the Google Cloud project to check for log volumes being ingested in Google SecOps with respect to the available ingestion limit, in percentage, and will trigger an alert in case the percentage is above a certain threshold (80% in this example) for more than 10 minutes.
In the same Google Cloud console search for “Alerting” and navigate the Alerting page. Create a new alert by clicking the “Create Policy” button. In the policy configuration mode please select PromQL and paste the following query:
100 * sum(rate(chronicle_googleapis_com:ingestion_log_bytes_count{monitored_resource="chronicle.googleapis.com/Collector"}[10m])) / min(min_over_time(chronicle_googleapis_com:ingestion_quota_limit{monitored_resource="chronicle.googleapis.com/Collector"}[10m])) > 80
A chart should populate with your SecOps data and show the current ingestion percentage with respect to your ingestion limit. Then click “Next” and in the next page configure 30 minutes for the Retest window, then leave all the remaining fields with predefault values and click again “Next”. In the “Configure notifications and finalize alert” please select an existing notification channel or create a new one with the corresponding “Manage notification channels section” available in the notification channel section pop-up. Then choose a name of this alerting policy as the last field of the form and leave all the remaining, non mandatory, fields as default. Once configured the policy should look like the following:
Congratulations, you configured your first alert for Google SecOps.
Automating Observability with Terraform
While manual configuration in the Google Cloud Console is effective for initial exploration, enterprise-scale Security Operations Centers (SOCs) demand the scalability, version control, and consistency that only automation can provide. To support these automated security workflows, the Google Cloud Professional Services team has launched secops-toolkit, an open-source repository containing dedicated blueprints and pipelines for Google SecOps environments.
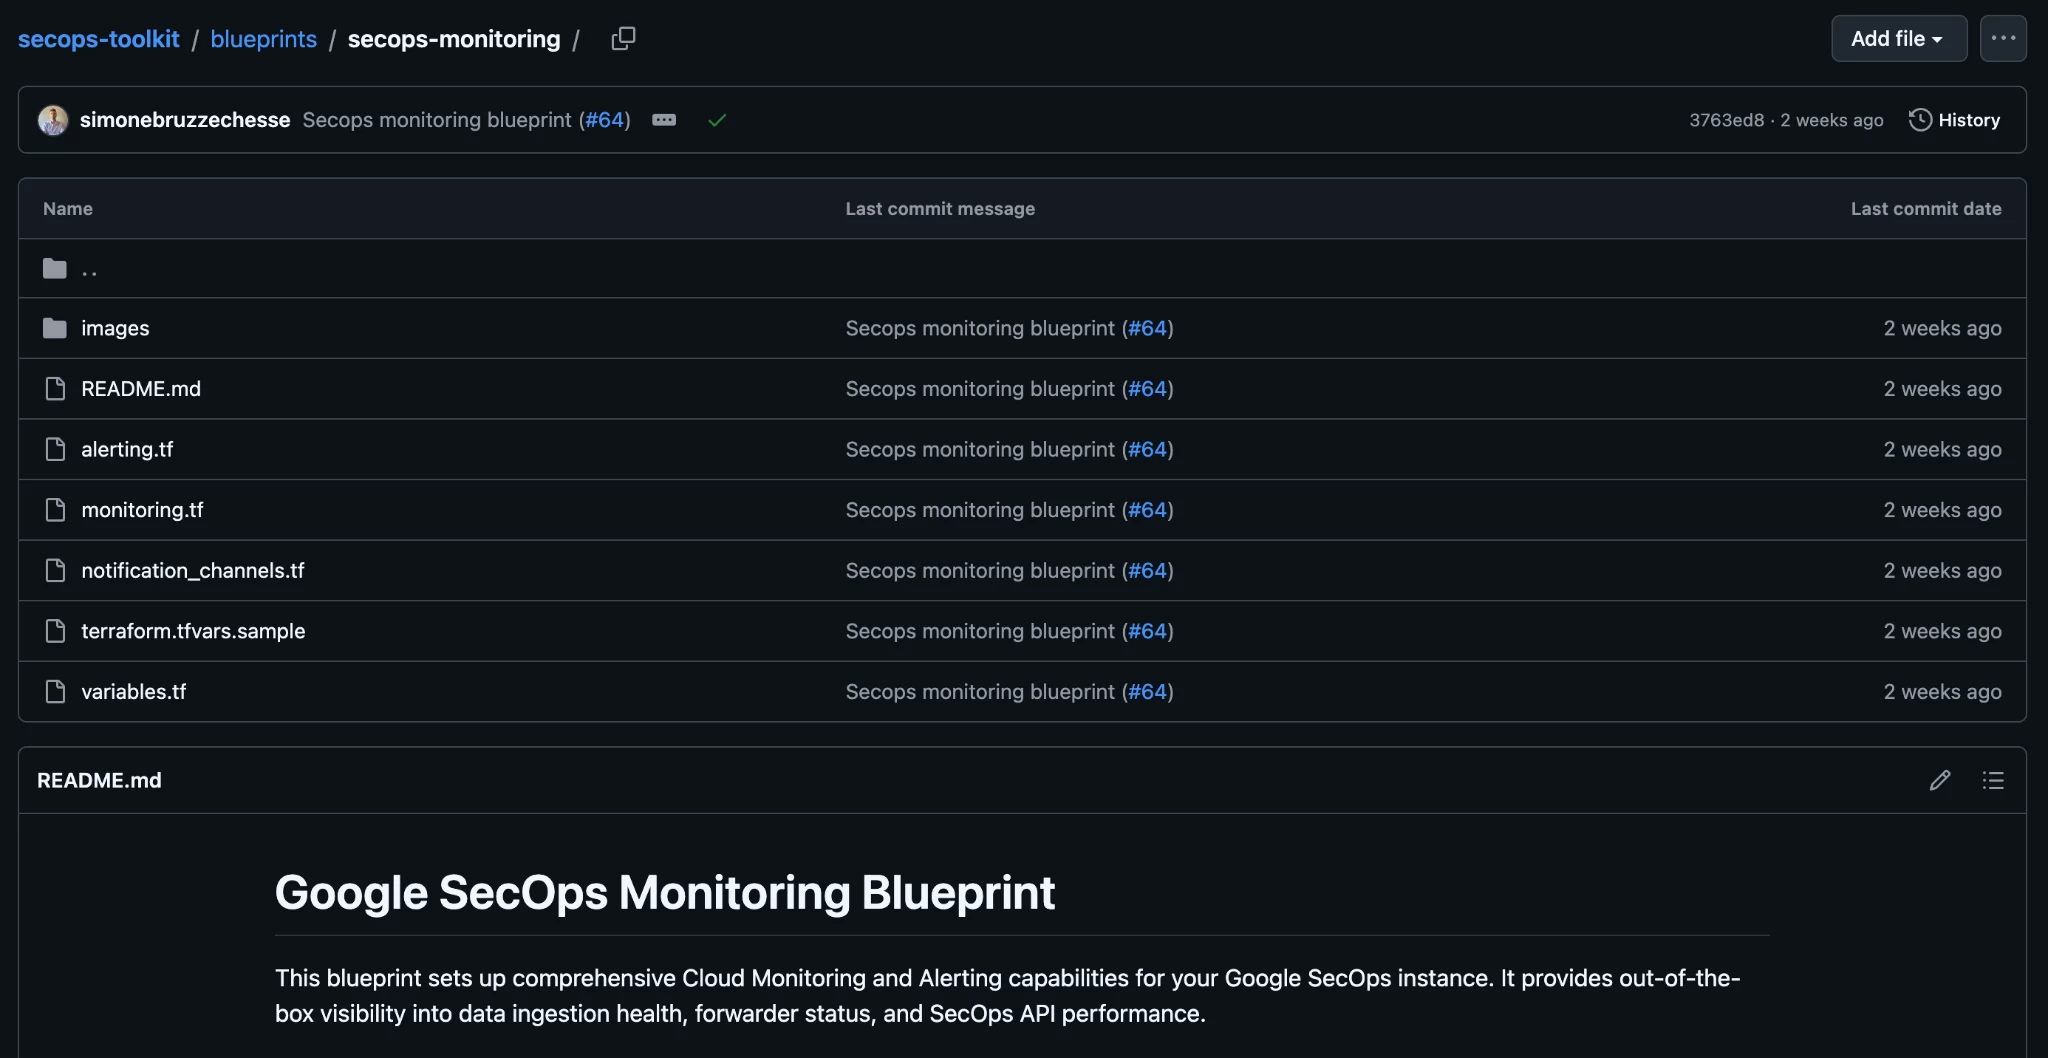
We are excited to introduce a new blueprint based on Terraform for deploying out-of-the-box dashboards and alerting policies that can be fully customized by the customer. This automation is available in the secops-toolkit repository here. Below the code available at the previous link.
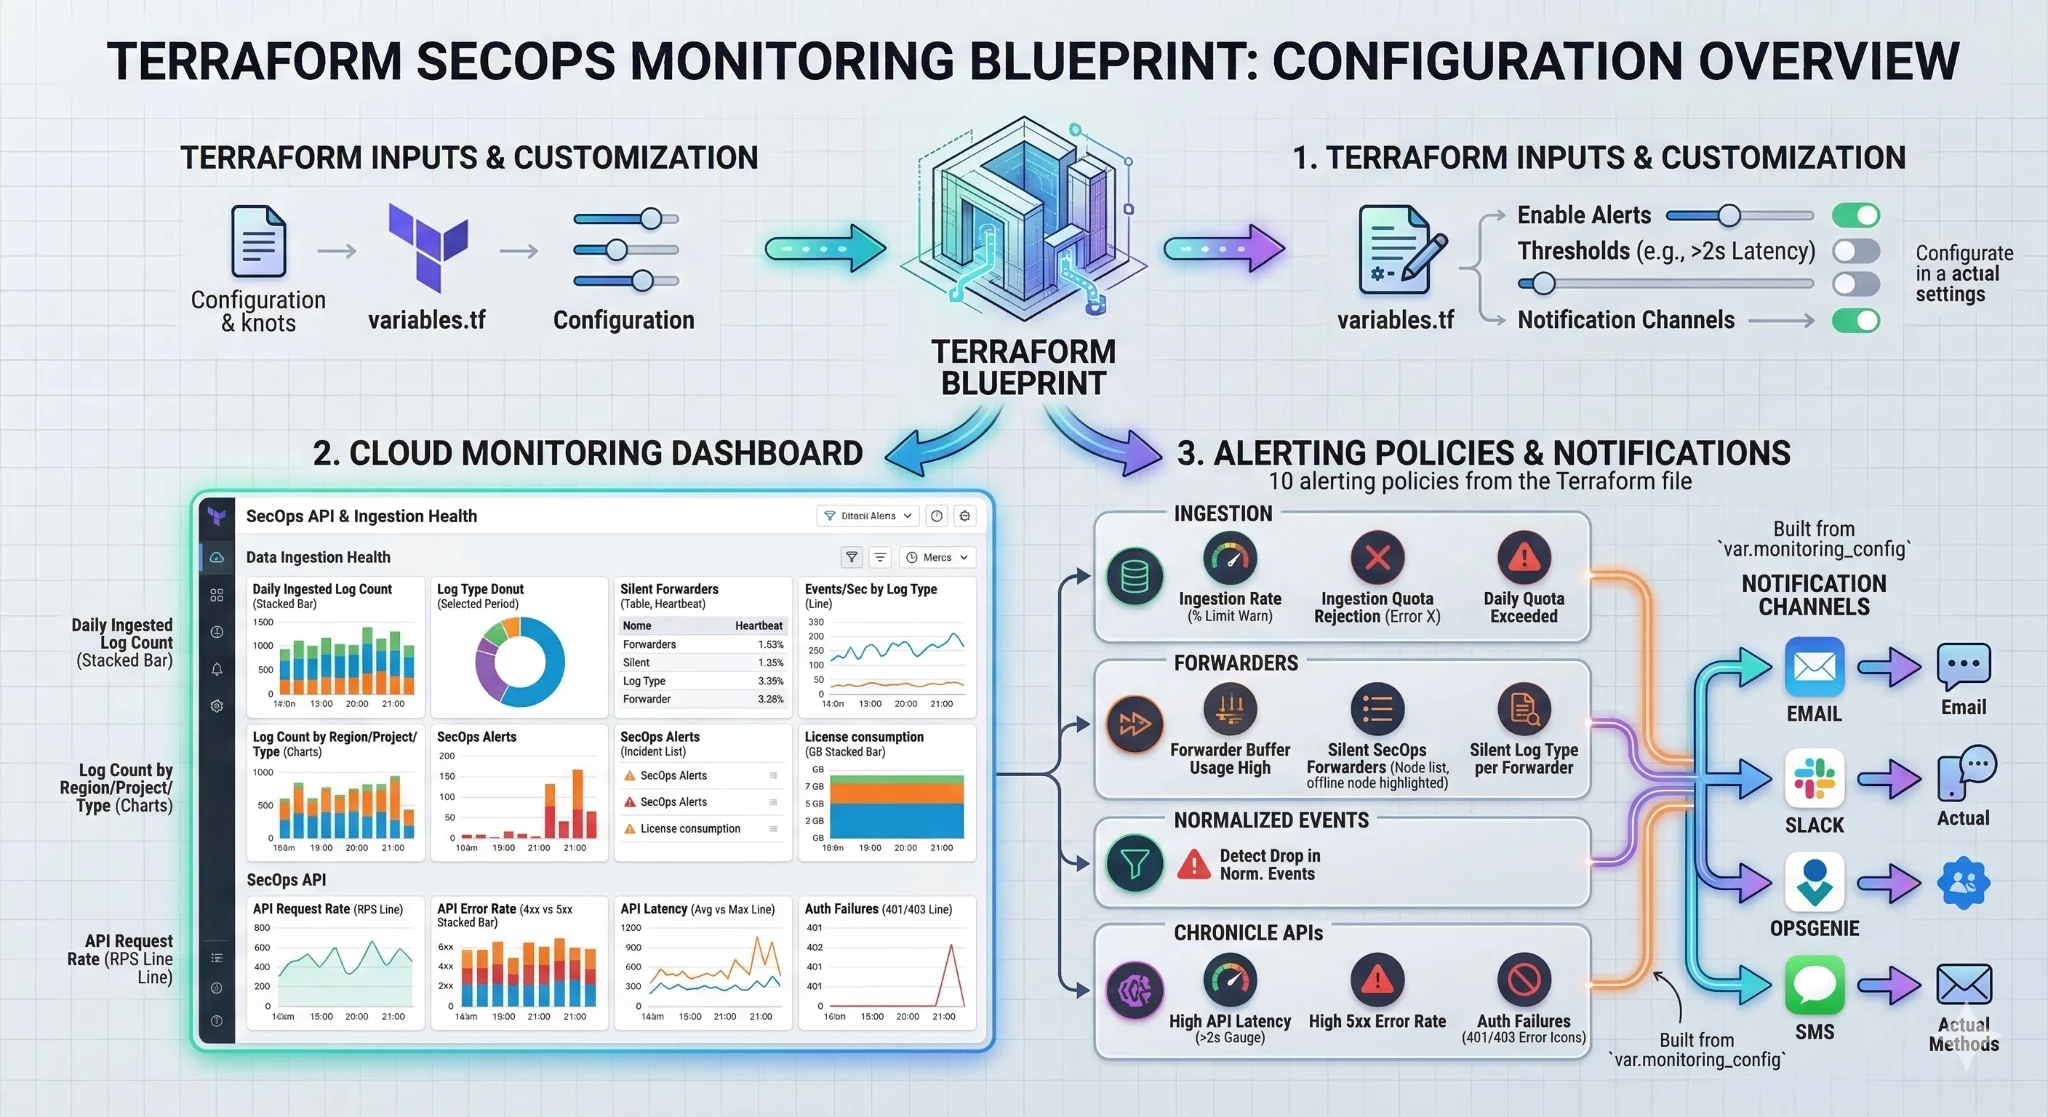
By executing this Terraform configuration, you automatically deploy:
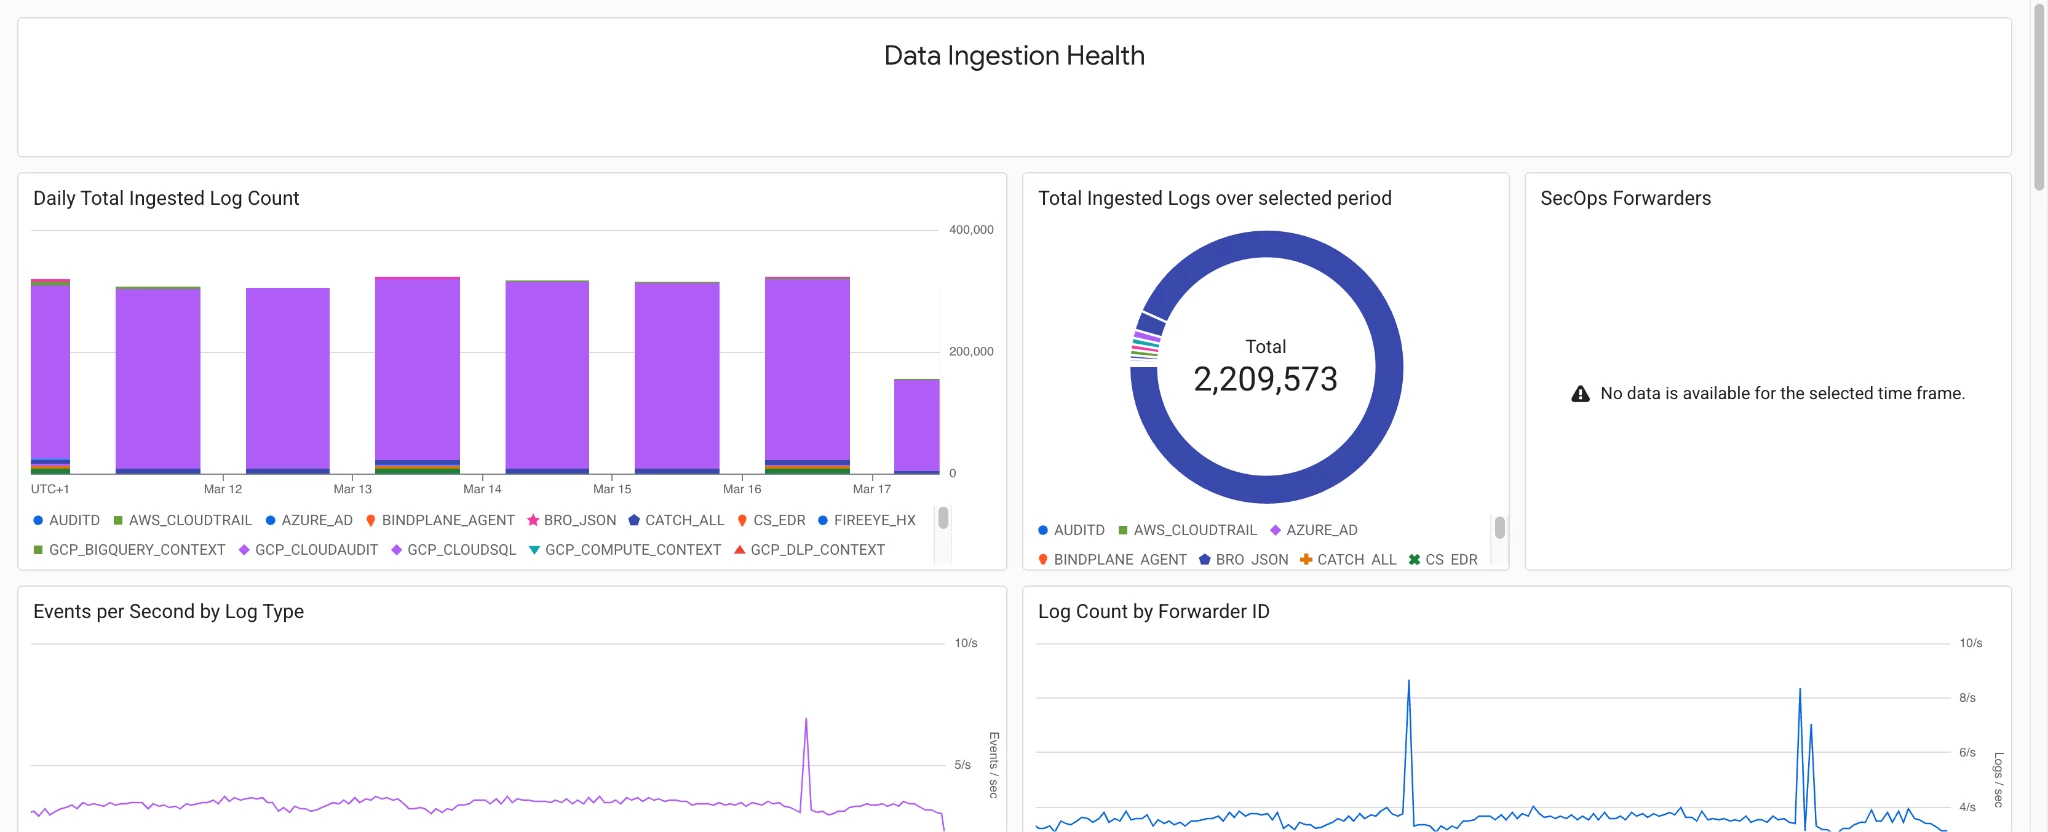
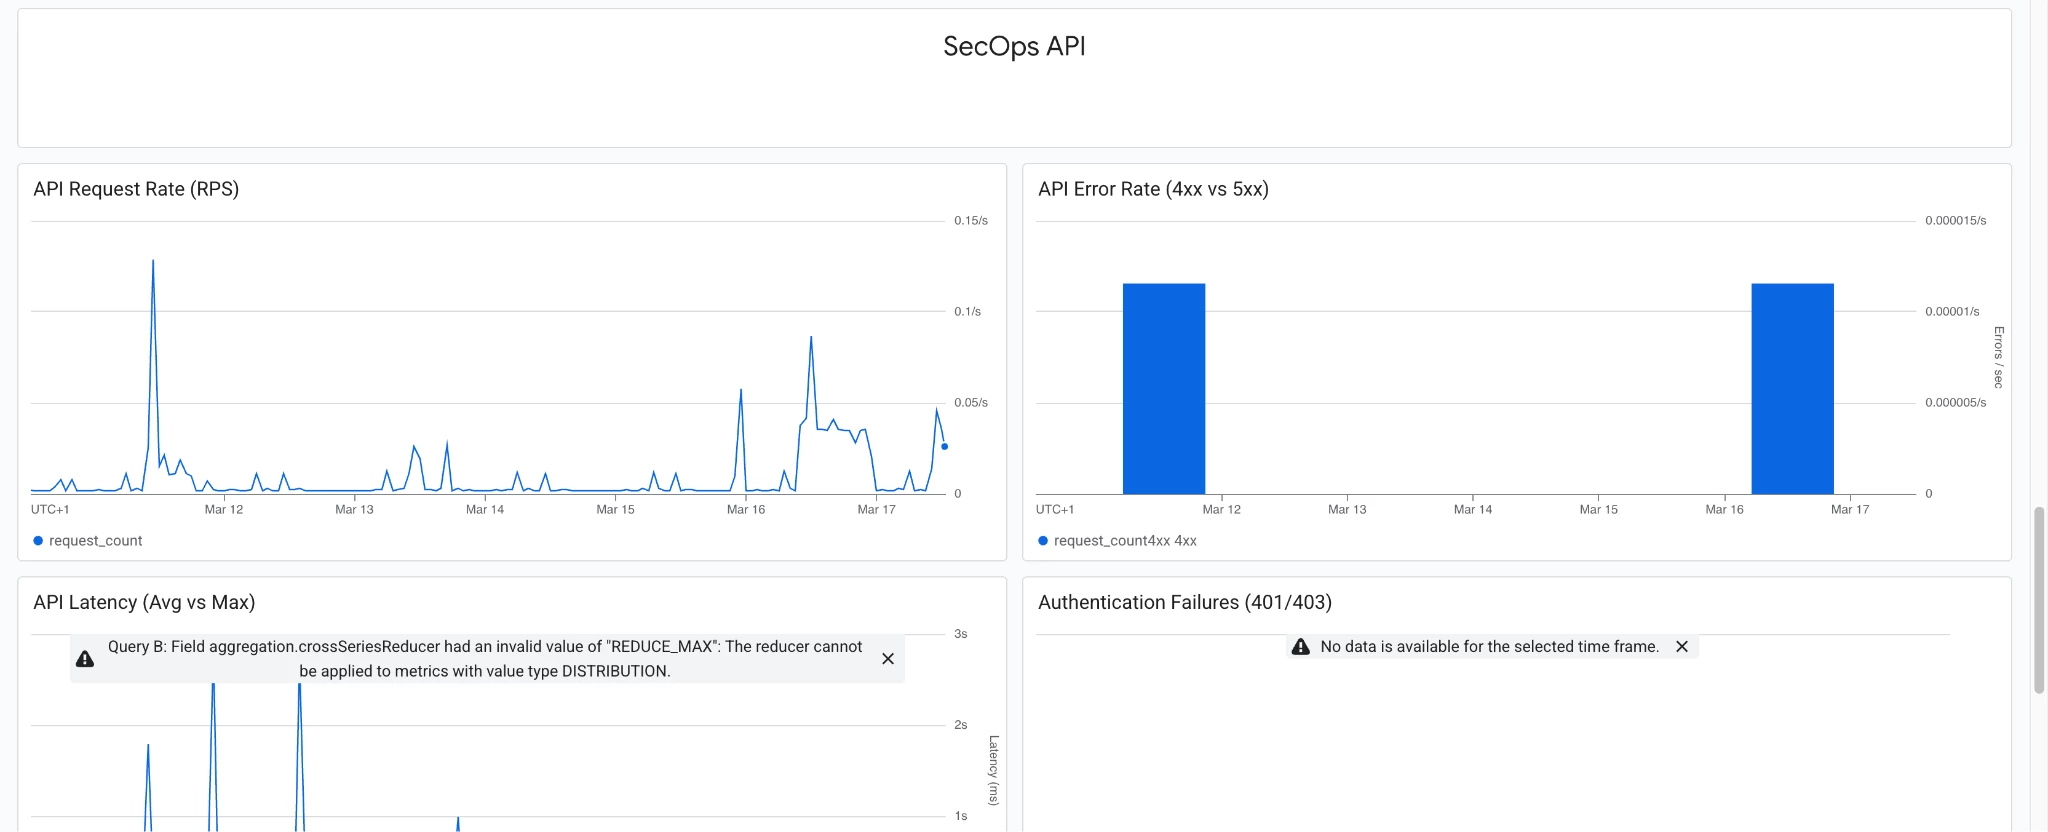
Pre-built Google SecOps Dashboard: Standardized JSON-backed Cloud Monitoring dashboards that visualize both the Ingestion Metrics and the Chronicle API metrics discussed above, below the sample dashboard in a demo environment.
Baseline Alerting Policies: Baseline alerting policies for inactive telemetry streams and API performance thresholds serve as foundational templates, enabling security practitioners to architect robust monitoring rules. To ensure operational efficacy, these baseline configurations must be meticulously calibrated against production-specific baselines prior to full activation within the SOC environment.
-
Ingestion & Quota Health
-
Ingestion Rate Warning: Triggers when real-time traffic exceeds a defined percentage (e.g., 80%) of the provisioned quota.
-
Quota Rejection: A critical alert firing the moment Google SecOps begins dropping data due to limit exhaustion.
-
Daily Volumetric Budget: Monitors a 24-hour rolling window to ensure ingestion stays within the calculated daily TB license limit.
-
-
Parsing & Normalization Quality
-
Normalization Drop-off: Compares the ratio of Raw Logs to Parsed Events. A sudden drop-off suggests that a vendor log format change has broken an existing parser.
-
-
Platform & API Performance
-
API Latency: Monitors for response times >2s, ensuring SOAR and Dashboards remain responsive.
-
5xx Error Rates: Detects server-side platform instability or regional outages.
-
Auth Failures: Watches for spikes in 401/403 errors to identify expired API keys or potential credential abuse.
-
Notification Channels: Seamless integration into your existing incident response workflows (e.g., automatically routing Terraform-deployed alerts to a designated SOC Slack channel or PagerDuty service).
Because it is built in Terraform, customers can easily adjust variables to match their specific organizational needs. Want to change the Ingestion Metrics threshold from 80% to 90%? Simply update the variable in your terraform.tfvars file and run terraform apply. Please find below an infographic reporting this blueprint configuration:
Getting Started with the SecOps Monitoring Blueprint
The secops-toolkit provides a streamlined, automated approach to deploying critical observability infrastructure. By following the steps below, you can implement out-of-the-box dashboards and baseline alerting policies that ensure continuous visibility into your Google SecOps ingestion and API health.
Prerequisites
Before beginning the deployment, ensure the following software is installed and configured on your local workstation or environment:
-
Git: For cloning the repository.
-
Terraform: To manage infrastructure as code.
If you are utilizing Google Cloud Shell, note that the default pre-installed version of Terraform may be outdated and incompatible with this blueprint. To ensure a successful deployment, upgrade your environment by executing the following command when connected to the Cloud Shell terminal:
(VERSION=1.15.2; cd /tmp/ && wget https://releases.hashicorp.com/terraform/$VERSION/terraform_${VERSION}_linux_amd64.zip && unzip terraform_${VERSION}_linux_amd64.zip && mkdir -p $HOME/bin/ && cp terraform $HOME/bin/ && echo -e '\n# Terraform Path and Aliases\nexport PATH="$HOME/bin:$PATH"\nalias tf="terraform"\nalias tfa="tf apply"\nalias tfar="tf apply -refresh=false"\nalias tfara="tf apply -refresh=false -auto-approve"\nalias tfi="tf init"\nalias tfia="tfi && tfa"\nalias tfiu="tf init -upgrade=true"\nalias tfp="tf plan"' >> ~/.bashrc) && source ~/.bashrc && echo "Terraform setup complete!"
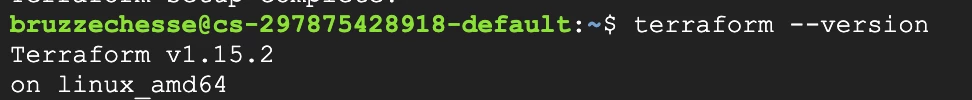
If the upgrade is successful you should see the message "Terraform setup complete!” and running the following command:
terraform --version
Should return the terraform version being installed as per the following screenshot:
Step 0: Clone the Repository
To begin, you need the Terraform code locally or in your Cloud Shell. Open your terminal and run:
git clone https://github.com/GoogleCloudPlatform/secops-toolkit.git
cd secops-toolkit/blueprints/secops-monitoring
Step 1: Gather Prerequisites
Before deploying, ensure you have the following information ready:
-
GCP Project ID: The ID of your Bring Your Own Project (BYOP) linked to Google SecOps.
-
Authentication: Ensure your environment is authenticated with the Google Cloud CLI (this is already configured when connecting via Cloud Shell).
gcloud auth application-default login-
Permissions: Your account needs roles like Monitoring Editor and Dashboard Editor within the project.
Step 2: Prepare Terraform Variables
Navigate to the blueprint directory and create a configuration file to store your project-specific settings:
-
Locate the terraform.tfvars.sample file.
-
Rename the file to terraform.tfvars.
-
Update the variables, such as project_id, and customize the email used for notification in case of incidents (alert policy being triggered).
Step 3: Deploy the Resources
Initialize the environment and apply the configuration. This will automatically build your dashboards and set up all 10+ baseline alerting policies.
terraform init
terraform apply
Review the plan provided by Terraform and type yes when prompted to finalize the deployment.
Step 4: Verify in the Console
Once the deployment is complete, navigate to the Google Cloud Monitoring page in your console:
-
Dashboards: Look for the "SecOps API & Ingestion Health" dashboard to see real-time visualizations.
-
Alerting: Check the "Policies" tab to see your new active alerts for silent forwarders, quota limits, and API errors.
Conclusion
In the contemporary security environment, visibility gaps represent significant operational risks. A silent log source creates dangerous blind spots, while failing API integrations can severely impede your response capabilities. By leveraging the deep integration between Google SecOps and Cloud Monitoring, security teams can effectively transition from reactive troubleshooting to proactive health management.
Whether you manually configure custom widgets or implement an enterprise-grade observability framework via Terraform, the objective is consistent: achieving comprehensive telemetry visibility. Adopting a monitoring-as-code philosophy ensures that your data ingestion pipelines remain as resilient and governed as the core infrastructure they monitor.
By managing your SecOps observability through automated code, you guarantee that your security telemetry streams are as robust and meticulously tracked as the vital assets they are designed to protect.