



Author: Matan Hayun, Product Manager, Google SecOps
A unified technical guide for isolating ingestion pipelines and troubleshooting delay patterns using core latency metrics.
In the realm of security operations, data freshness is not merely a technical parameter—it is the lifeblood of threat detection, real-time alerting, and rapid incident triage. When a critical detection rule fails to fire, or an active security incident investigation stalls, security analysts and administrators inevitably confront the same core question: Is there a delay in our security telemetry ingestion pipeline?
Historically, answering this question was a frustrating, multi-step chore. Analysts were forced to manually query raw logs, build complex, custom dashboards to compare timestamps across disparate logging layers, or open support tickets with Google SecOps just to locate where a processing delay was occurring.
To solve this, Google SecOps is proud to introduce Granular Latency Monitoring inside the Data Health Hub (DHH). Surfaced in Public Preview, this powerful feature set delivers end-to-end, high-resolution transparency into the entire data ingestion and normalization lifecycle. By exposing two distinct, mathematically precise latency metrics, administrators and SOC engineers can immediately isolate whether an ingestion bottleneck resides upstream within the customer's on-premises/cloud network (the source) or downstream inside the Google SecOps internal network.
2. The Log Lifecycle and Core Latency Metrics
To enable robust, self-service troubleshooting, Google SecOps maps and records the journey of every security log. This data lifecycle is segmented into three primary milestones, which are mapped to specific timestamps in our pipeline database:
Key Pipeline Milestamps and Timestamps
|
By calculating the delta between these milestones, Google SecOps derives two core, customer-facing latency metrics designed to isolate pipeline lag:

Real-World Examples of Collection Time
Example 1: Scheduled API Polling (Cloud SaaS / Feed Ingestion)
In an API-based feed setup (such as Okta, Google Workspace, or Cloud Audit logs), Chronicle periodically polls the provider’s API endpoint to fetch new activity.
10:00:00 AM — Event Time: A user logs into Okta. Okta records the event in its system log.
10:01:00 AM — Collection Time: Chronicle’s feed collector executes its routine scheduled 1-minute API poll, connects to the Okta API, and receives the log payload.
10:01:02 AM — Ingestion Time: Chronicle normalizes, enriches, and indexes the event.
Takeaway: The Collection Time (10:01:00 AM) represents the exact second Chronicle pulled the data from the vendor API during its routine execution schedule.
Example 2: Push / Agent Streaming (Chronicle Collection Agent)
In an agent-based setup (such as a Chronicle Collection Agent or BindpPlane agent installed on a Linux or Windows server), logs are streamed continuously as they occur.
02:00:00 PM — Event Time: An administrator executes a `sudo` command on a Linux server.
02:00:01 PM — Collection Time: The Chronicle agent running on the server captures the log entry from the local OS audit system and prepares the payload.
02:00:03 PM — Ingestion Time: Chronicle processes and indexes the event in the cloud.
Takeaway: For streaming agents, Collection Time (02:00:01 PM) occurs almost instantaneously after the Event Time, marking the precise moment the agent captured the log payload locally.
A. SecOps Ingestion Latency (Collection-to-Ingestion)
-
Technical Definition: Calculated as T_ingestion - T_collection.
-
What it Measures: The internal processing and write efficiency of the Google SecOps backend ingestion pipeline.
-
Operational Actionability: In a healthy, un-throttled environment, this metric is highly stable. A persistent spike in SecOps Ingestion Latency indicates an internal bottleneck—such as account quota breaches, compute resource limits, or databasedata base queries.
B. Source-to-Ingestion Latency (Event-to-Ingestion)
-
Technical Definition: Calculated as T_ingestion - T_event.
-
What it Measures: The total end-to-end delay representing the real-world age of the data when it finally becomes available for parsing.
-
Operational Actionability: This metric tracks true telemetry freshness. It combines upstream source-side delays (collector buffering, forwarder queues, network transit) with internal SecOps pipeline processing. If this spikes while SecOps Ingestion Latency remains low, the delay resides entirely on the customer's or vendor's end.
3. Navigating Latency Metrics in the UI
Google SecOps surfaces these metrics across two critical layers in the console to balance high-level monitoring with deep-dive performance analysis:
A. The Health Hub Dashboard Tables
We have integrated high-level latency visibility directly into your active monitoring grids. We have introduced two new interactive latency tables to streamline pipeline troubleshooting - “Latency Status by Source” and “Latency Status by Log Type”. Measured using 95th percentile (P95) metrics to eliminate outlier noise, these tables break down end-to-end delays across your feeds, agents and log types to provide an accurate baseline of your pipeline’s health. While “Latency Status by Source” monitors performance at the individual feed, agent or collector level, “Latency Status by Log Type” aggregates arrival metrics across entire log categories to highlight broader trends. Together, they allow you to easily differentiate between upstream delivery delays (Source to Ingestion Latency) and internal processing times (SecOps Ingestion Latency), while also providing visibility into API polling behavior (Polling Frequency and Lookback Window) and direct access to filtered deep-dive dashboards via View links.
B. The Data Health Deep Dive Dashboard
Clicking the 'Dashboard' link on any table row opens a high-resolution deep-dive interface. Scrolling to the 'Latency Monitoring' section exposes parallel time-series charts visualizing P50, P90, and P95 latency trends simultaneously. This dashboard supports granular Source-Level Filtering, allowing engineers to filter curves by either collectorId or feedID, along with Log Type—a vital feature for debugging complex BindpPlane agent topologies.
4. Troubleshooting Playbook: Real-World Scenarios
When investigating pipeline delay issues, comparing the visual curves and percentiles of Source-to-Ingestion Latency and SecOps Ingestion Latency is the single most effective way to identify a root cause. The following four operational scenarios outline how these metrics interact in the field:
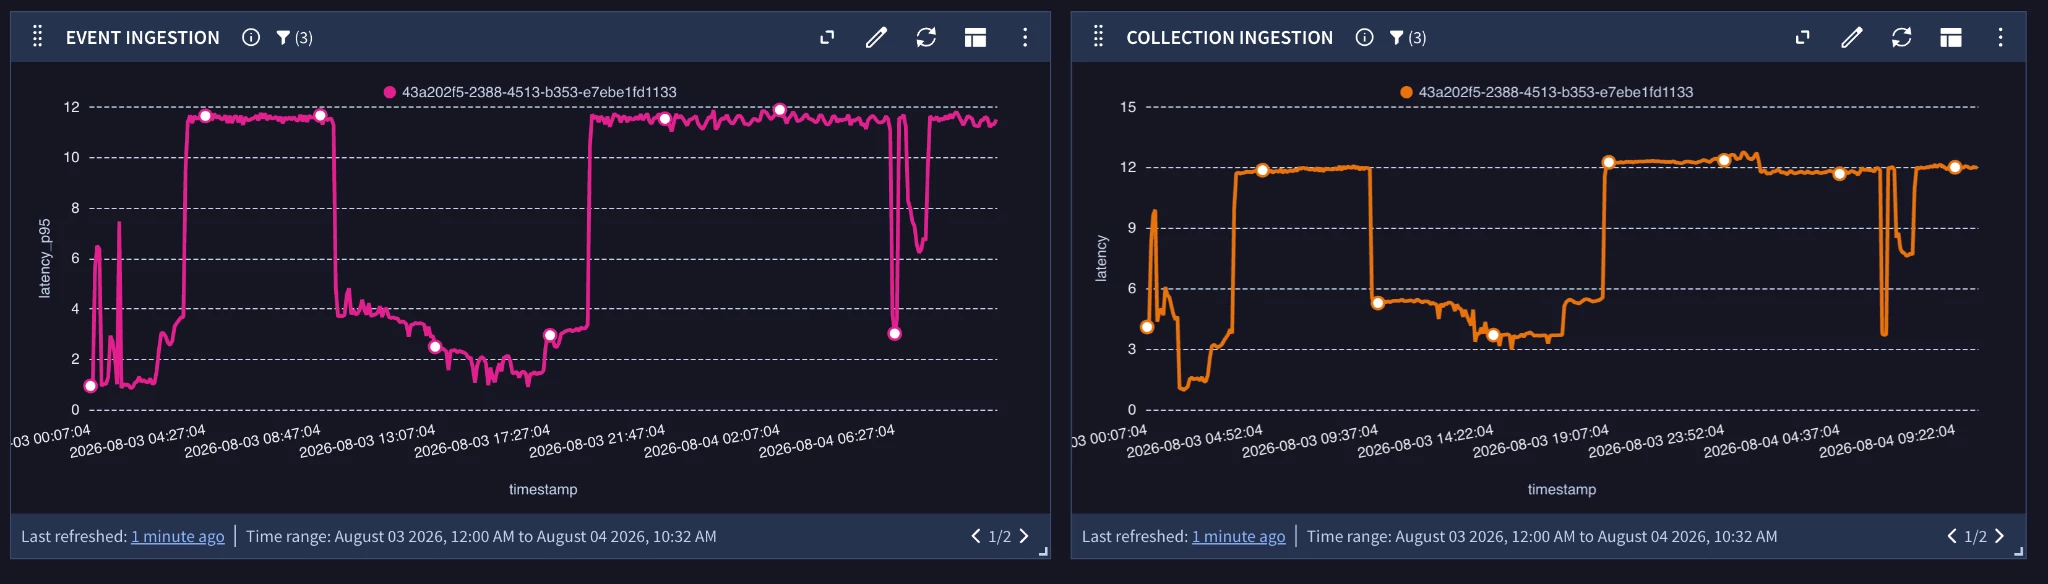
Scenario 1: Normal Baseline Operation (Near Real-Time Delivery)
-
Visual Pattern: Both Source-to-Ingestion Latency and SecOps Ingestion Latency remain flat, low, and stable. The two curves track closely within a tight, healthy baseline band. Neither metric breaches normal operating thresholds.
-
Technical Interpretation: Google SecOps and all upstream log collectors are operating optimally. Telemetry is crossing the entire ingestion pipeline in near real-time.
-
Recommended Action: No action required. The pipeline is performing healthy.
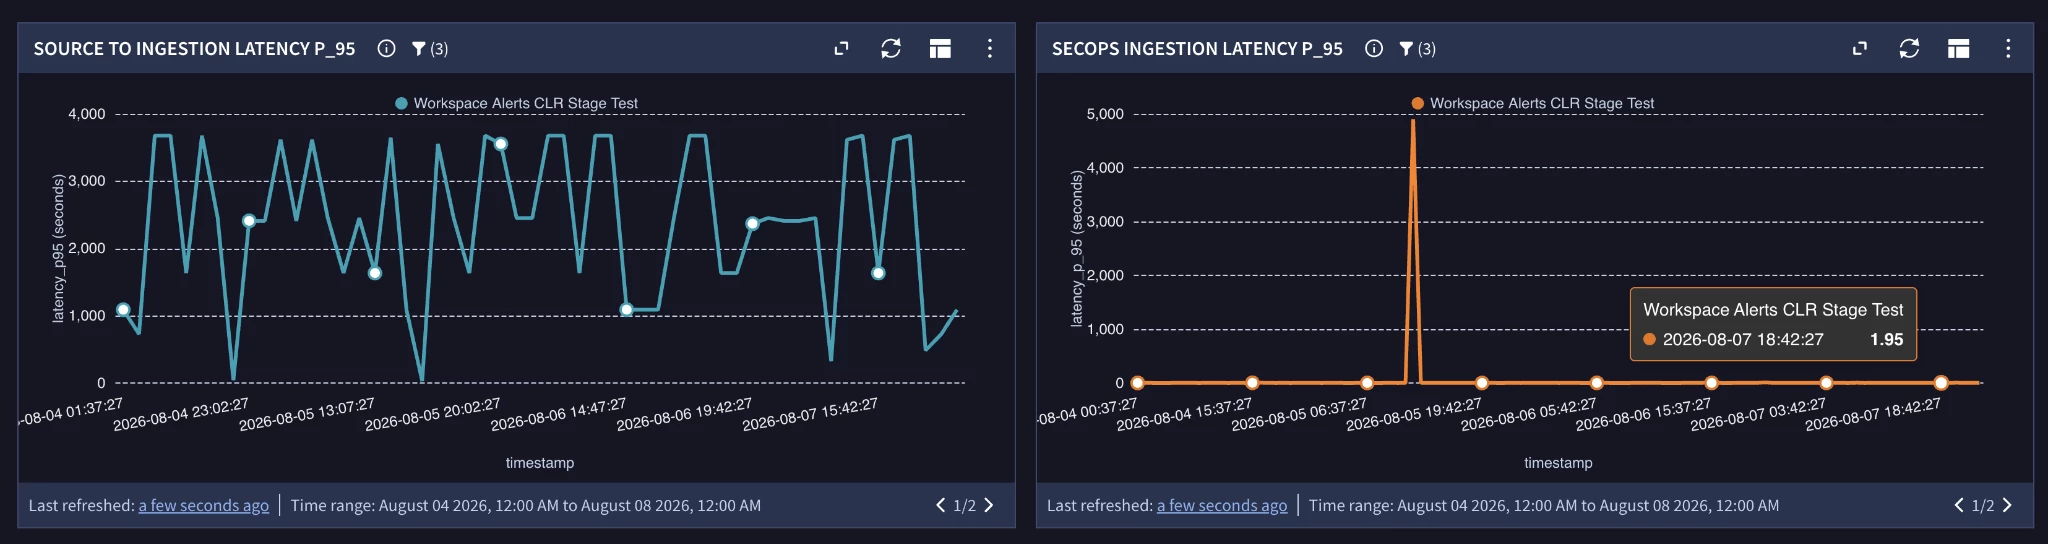
Scenario 2: Transient Ingestion Spikes (Self-Healing Workers)
-
Visual Pattern: SecOps Ingestion Latency displays a sharp, isolated spike but immediately recovers back to its low baseline. Crucially, the Source-to-Ingestion Latency curve remains unaffected, tracking its regular baseline or expected polling cycle without any persistent delay.
-
Technical Interpretation: A temporary, isolated processing delay occurred, but the SecOps pipeline self-healed instantly. Because the system recovered before a backlog could form, real-time data freshness was maintained.
-
Recommended Action: Monitor for recurrence. If the spikes are highly isolated and auto-recovers without impacting ongoing log freshness, no manual intervention is required.
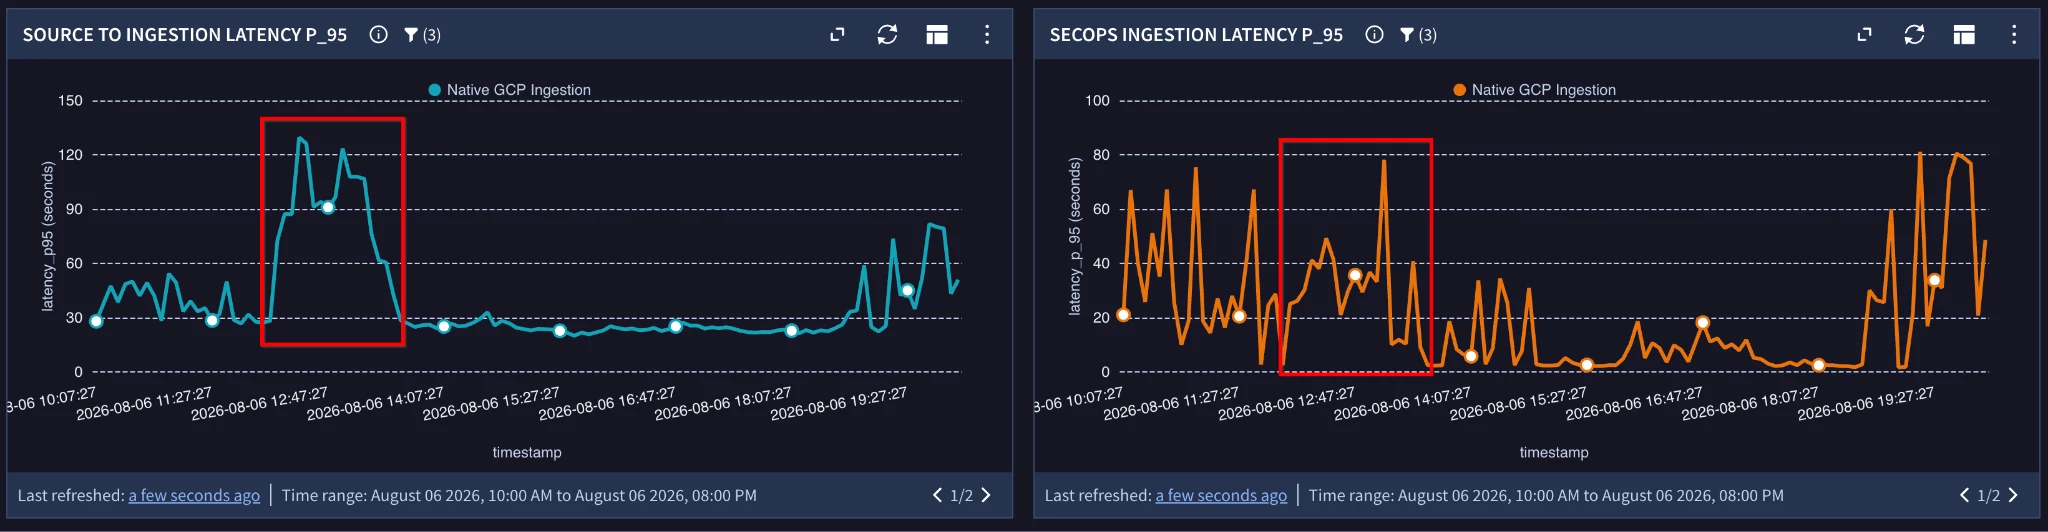
Scenario 3: Source-Side Issue (Upstream Bottleneck)
-
Visual Pattern: Source-to-Ingestion Latency exhibits a sharp, sustained spike or elevated plateau (frequently jumping from seconds to hours). Meanwhile, internal SecOps Ingestion Latency remains healthy at baseline.
-
Technical Interpretation: Google SecOps is ingesting, writing, and making your security data ready for parsing almost instantly upon receiving it. The bottleneck resides entirely upstream before the logs ever reach our front-door gateway.
-
Typical Root Causes:
1. Local collection agent backlog or CPU/Memory throttling on host servers (e.g., overloaded BindpPlane collectors).
2. On-premises network proxy or firewall rate-limiting/throttling.
3. API provider publishing or export delays on the vendor side (e.g., GCP Cloud Audit logs, AWS S3 export lag, Okta API delays).
4. An administrator performing a deliberate manual backfill of large, historical archives, which naturally pushes back the original event time.
-
Recommended Action: Check the data source ; Filter by Collector ID or feedId in the deep dive dashboard to isolate the overloaded source. We recommend not opening a Google support case, as the issue is external.
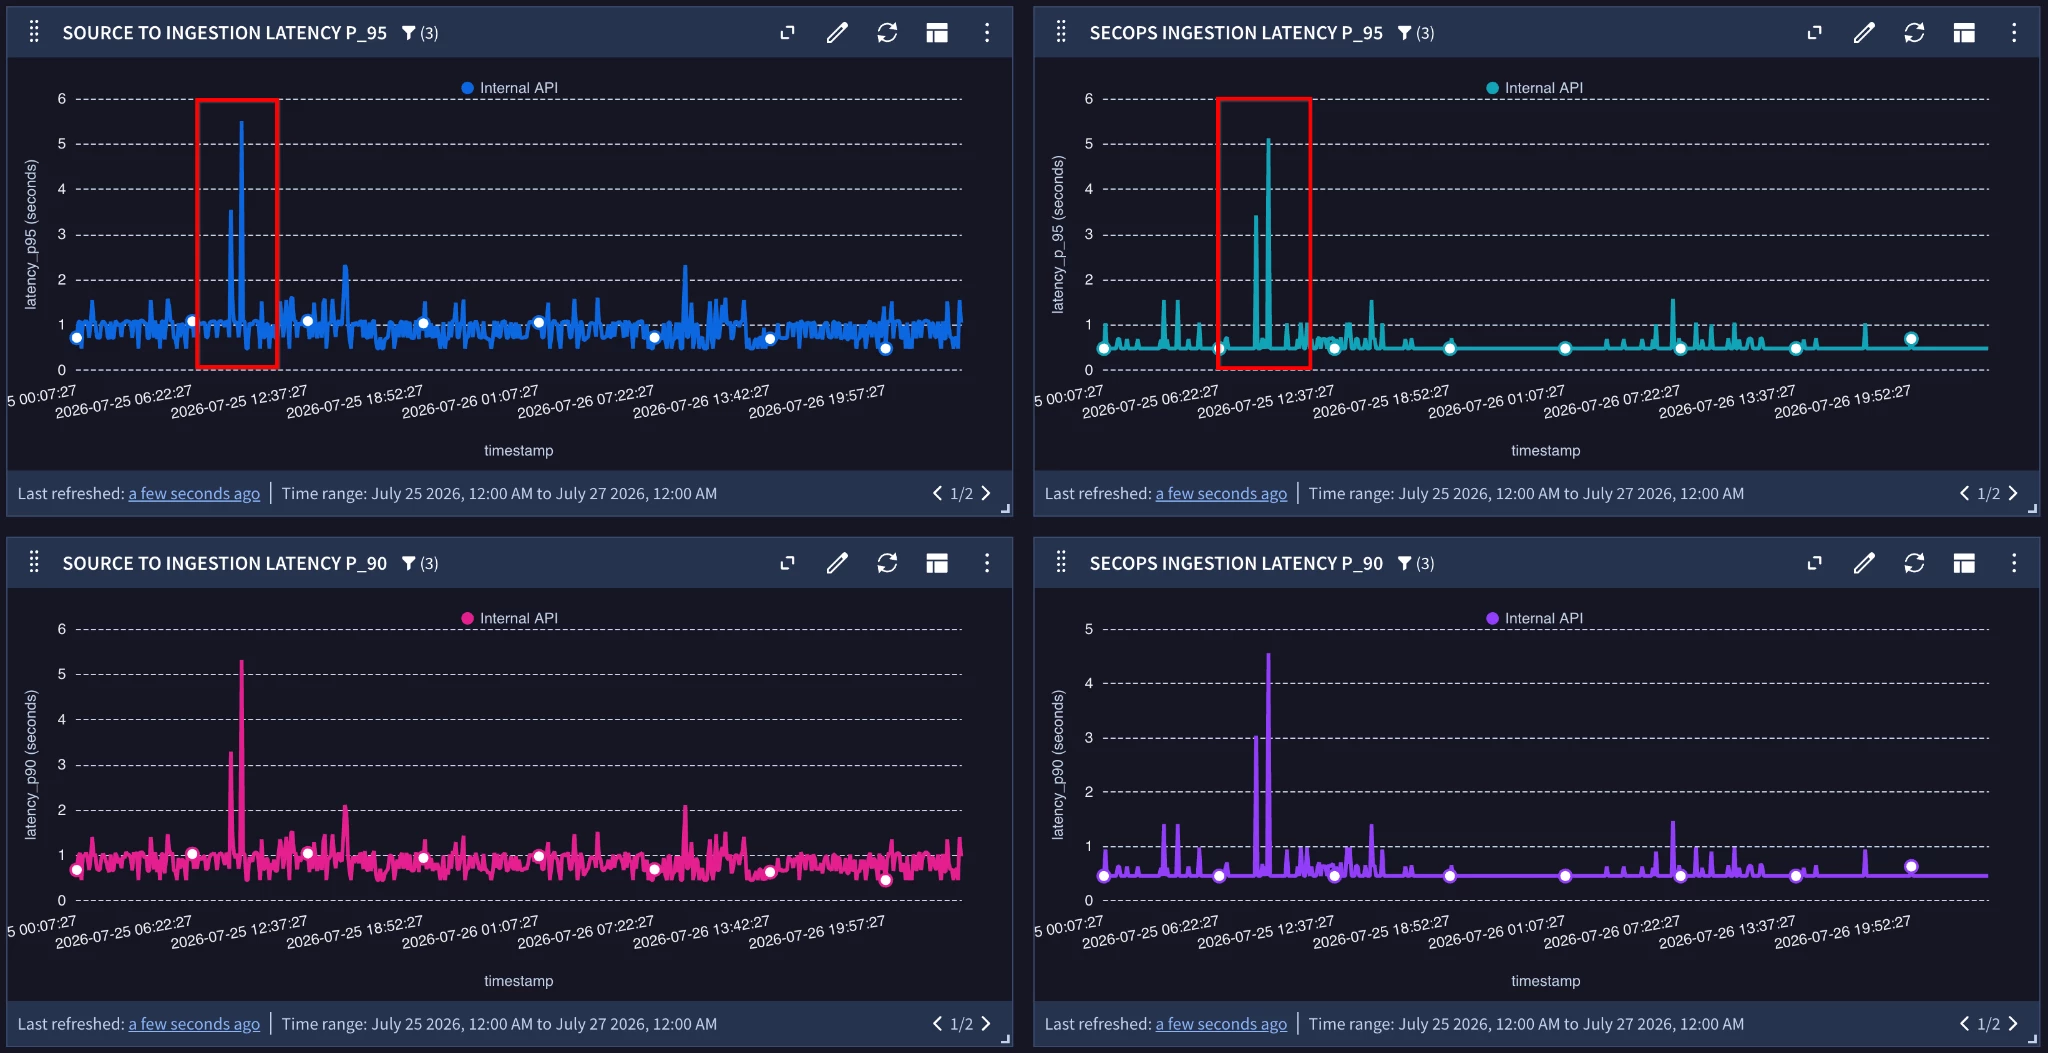
Scenario 4: SecOps Ingestion Issue (Internal Platform Bottleneck)
-
Visual Pattern: SecOps Ingestion Latency spikes significantly, causing an identical, lockstep parallel spike in the overall Source-to-Ingestion Latency curve. Both lines rise and fall in perfect synchronization.
-
Technical Interpretation: Security logs are arriving at the Google SecOps gateway on time, but there is an increase in delay within the SecOps pipeline.
-
Typical Root Causes:
-
1. Tenant ingestion throughput exceeding provisioned contractual limits or pipeline quotas.
-
2. Extreme parser computation overhead or inefficient regex evaluations during a high-throughput burst.
-
3. Intermittent downstream database write delays or upstream Pub/Sub message queue backlogs.
-
4. Ingesting exceptionally large individual log files (e.g., > 1GB chunks). These massive files will be diverted to retry queues, which temporarily increases the processing time.
-
5. An unanticipated surge in log volume that outpaces the backend's immediate compute capacity.
-
-
Recommended Action: One reason for the spike in latency could be the quota breaches happening during ingestion. Check the deep dive dashboard for an 'OUT_OF_QUOTA' status tag in the SecOps Ingestion Latency graphs. If your tenant has exceeded its ingestion quota, review your contractual limits or throttle non-critical log sources. If there is no quota breach, open a Google SecOps Support Case for immediate engineering investigation.
5. Support Case Decision Matrix
To help your team streamline operational ticketing, prevent unnecessary cases, and ensure rapid resolution when issues arise, use the following diagnostic decision matrix:
| Scenario | Diagnostic Indicator | Recommended Action | Open Case? |
| Spike in Source to Ingestion ONLY | SecOps Ingestion curve is healthy with minor ups and downs. Only end-to-end latency shows a spike. | Check local forwarder resource allocation, BindpPlane collector CPU/memory loads, or network proxy rules. Isolate by Collector ID. | No |
| Spike in SecOps Ingestion (Quota Breach) | Secops Ingestion latency spikes; UI displays 'OUT_OF_QUOTA' status labels. | Check ingestion throughput against your contracted limits. Throttle non-critical sources or contact sales to increase your tier. | No, the data will be ingested on retry |
| Spikes in SecOps Ingestion Latency | SecOps Ingestion Latency Spikes: Ingestion requests for unusual large files, database write latency or internal service outages | Check ingestion pipeline for unusual big files. Otherwise, gather the affected Log Type, collector IDs, and timestamp range. | Yes |
| Internal Platform Error | SecOps Ingestion Latency spikes; status returns 'Internal_Error' or Spanner database commit failures. | No self-remediation is possible. Gather the affected Log Type, collector IDs, and timestamp range. | Yes |
📺 Stay Tuned!
We are working on an upcoming series of community blog posts and video walkthroughs to help you better understand how the Data Health Hub can benefit your security operations! Less searching, more SecOps. |
For full documentation, visit the Google SecOps Documentation Portal and join the conversation in our Google Cloud Security Community Forums.
