

Not too long ago I learned what Bayesian probability was and then figured out how to implement it in Google SecOps. I chose to focus on the probability that a Chrome extension (CRX) was potentially hijacked primarily because it let me narrow down the scope of the problem I needed to solve. It’s also kind of a fun problem because today the only way to track CRX telemetry is through Chrome Enterprise Premium feeding a stream to Google SecOps–I knew that whatever I did would be unique.
While I’ve written about the system in a series on Medium, for members of the Community site I wanted to take a deeper look at the implementation in order to explain the system and what I needed to leverage to make it work. Whether you’re mulling over doing something similar or simply curious, I’m going to take the opportunity here to explain:
- How I designed a system that scales to a large population without computationally breaking the bank
- Using Data Tables to store state and serve as a data exchange mechanism between SecOps and an external system
- Where the Chronicle API powers more than simple bulk data exchanges
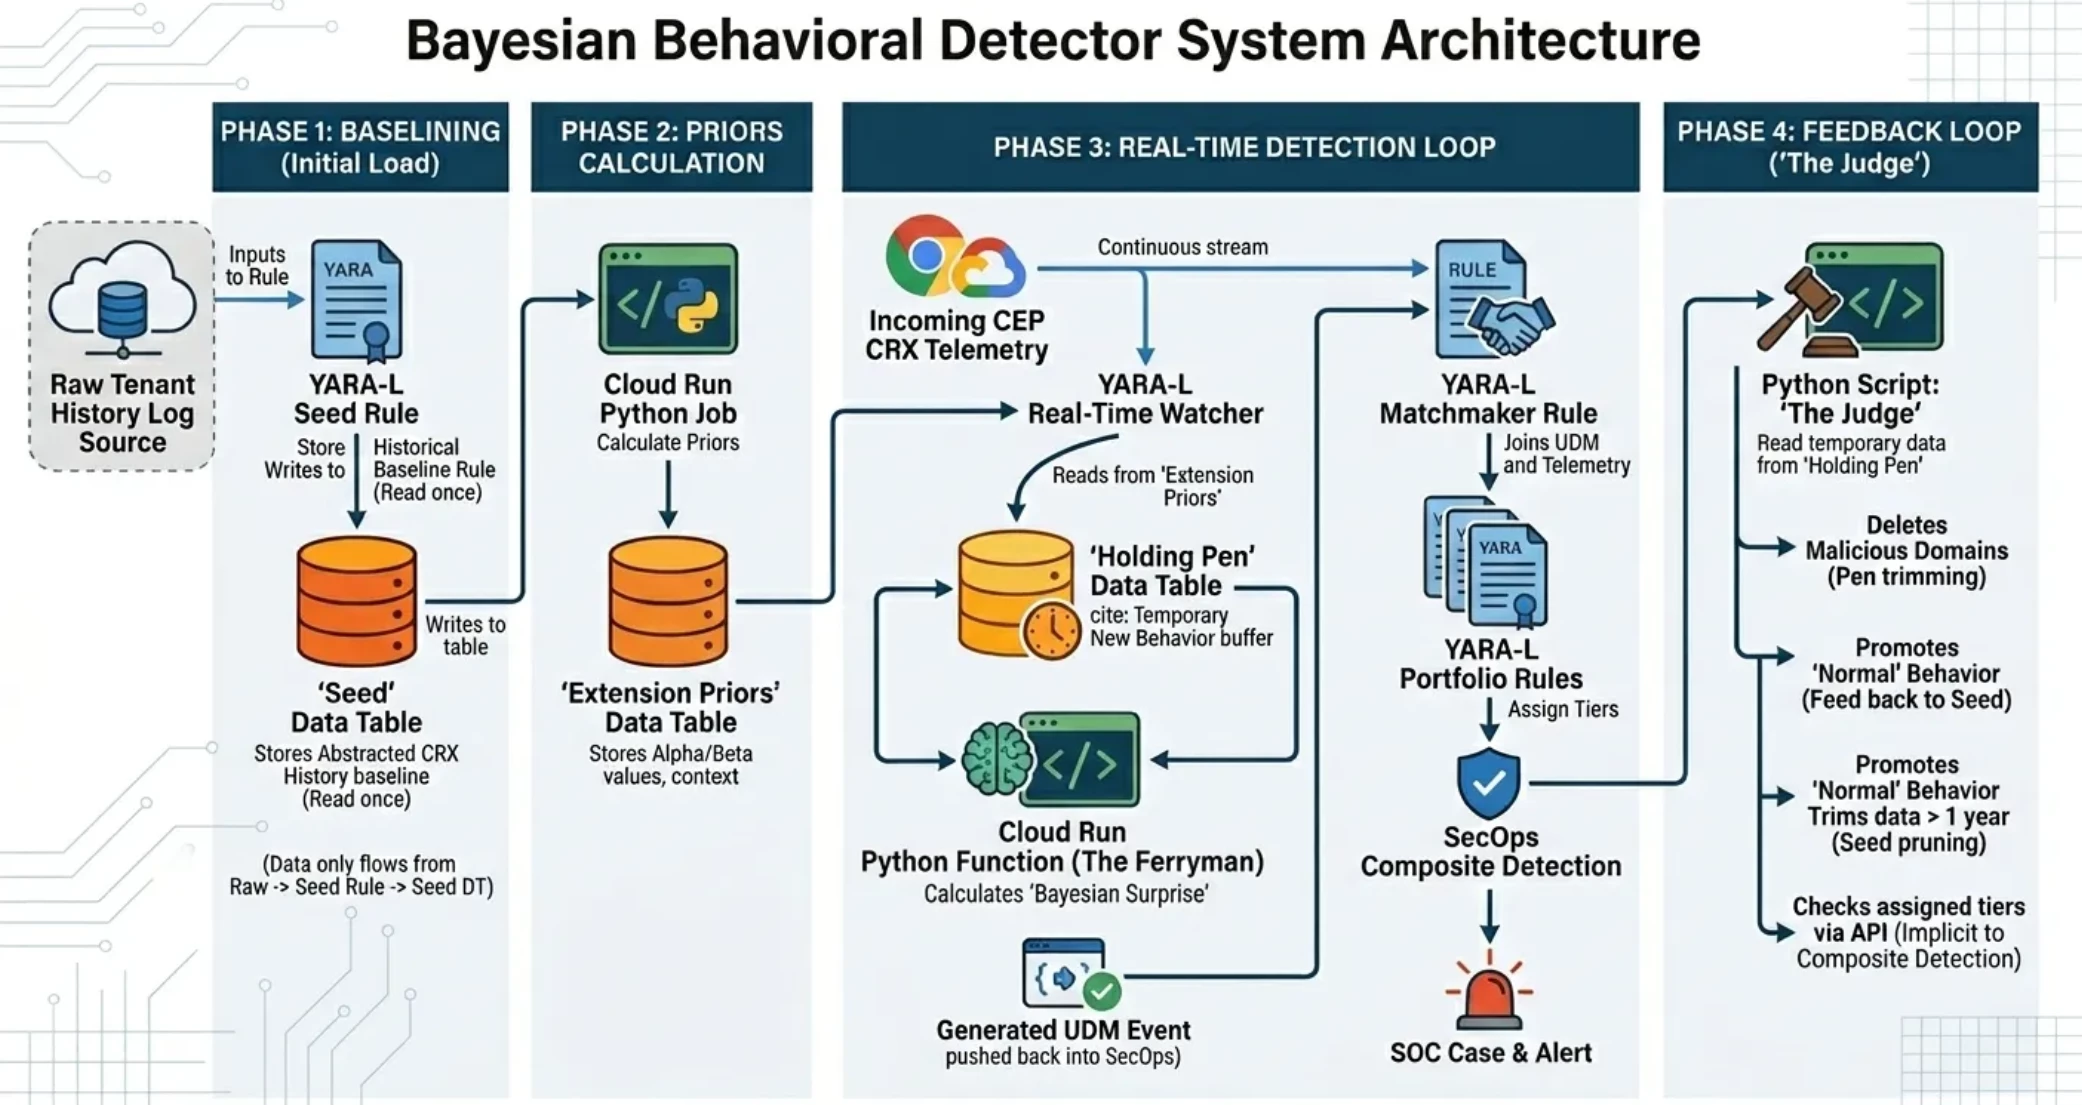
As the article progresses, it will describe various pieces of the architecture. Here’s a diagram that should help you understand where these pieces fit into the overall system:
The Problem I was solving
Bayesian Probability is a form of statistical inference. In layman’s terms, you look at the history of something to “infer” whether the current behavior matches the expected profile. The model updates as behavior changes. For a SOC, the real question is whether something new is something unexpected but OK or the sign of something bad. In all things Bayesian you make a choice as to whether to update the model and the SOC needs to balance adapting to new behavior versus excluding “bad” behavior so as not to normalize it.
To make this work, there’s a fair bit of math and data analysis but you don’t need math to understand the fundamental concepts:
- Derive a baseline knowledge of “Prior” behavior
- Measure whether current behavior is expected or not based on the prior behavior
- Reach a verdict on that behavior to reach a decision as to whether you include or exclude the behavior
- Find a way to ferry the new findings back into the baseline system, rebasing the Priors
What makes the problem harder is that YARA-L is not designed to do this. I needed a way to analyze all past behavior, calculate some key metrics (volume and inertia), store that somewhere so that the YARA-L rules engine could reference it when it saw new CRX telemetry.
Step 1: Create the store of data
Data tables are a great addition to SecOps. Between their capacity, being multidimensional, and the different mechanisms in place to work with them, they became an integral part of my solution. Fortunately you can populate them based on a YARA-L rule. I created a “seed rule” meant to run once as a retrohunt and populate a Data Table with summarized, indexed events. This avoids a “cold start” on the data but it only works if you’ve already collected a history of CRX data in a SecOps tenant, preferably 30 days.
Part of the rule is a simple data collection, isolating CRX API calls that involve external domains, which is almost all CRX calls of type extensionTelemetryEvent:
 events:
    $e.metadata.log_type = "CHROME_MANAGEMENT"
    $e.metadata.product_event_type = "extensionTelemetryEvent"


    // 1. Stable Identity Extraction
    // Using the 'profile_user' field to avoid email_addresses repeated field issues
    $userid = $e.extracted.fields["profile_user"]


    // 2. Core Behavioral Components
    $ext_id = $e.target.resource_ancestors.product_object_id
    $signal = $e.target.resource.name


    $clean_domain = strings.to_lower(re.capture(
        strings.coalesce(
            $e.target.resource.attribute.labels["destination"],
            $e.target.url,
            $e.target.asset.hostname,
            "unknown"
        ),
        "(?:https?://)?(?:www\\.)?([^/:]+)"
    ))
Note “clean_domain” - not all external CRX calls use the same UDM fields for contacted domains, and I wanted one reference for all external calls. I lumped them in this single local variable.
The other item I want to call out is that I intentionally chose an unenriched UDM field for the user. Chrome logs are structured JSON, which results in auto-extraction fields. The “profile_user” value in the log normalizes to principal.user.email_addresses, but in my own environment that leads to seven different email aliases that show up as enriched fields, which also inflates any one user event into seven user events. Using the extracted field removes the risk of inflated, inaccurate metric calculations.
The bigger part of what this rule does is that it measures activity over time.
- It breaks out activity by extension, the type of activity, the external domain, and the day of the week when it happens
- It measures the this activity across all user profiles without tracking any specific person – people are an abstraction
- It sorts the activity on a weekly basis
The rule uses the Match statement and Outcome variables for all of this but the real focus is on constructing a key that summarizes the extension, signal, domain, week number, and day activity, or the “eswd key”. An example key is:
lmjegmlicamnimmfhcmpkclmigmmcbeh|REMOTE_HOST_CONTACTED_INFO|ssl.gstatic.com|36|7
What the key does not contain is anything about the user or machine that saw it. Any involved entities in your environment are attributes of the finding: a column in the row shows a count of users. This means that I can treat users in the abstract on one line rather than having a line per entity, which drives multiple benefits:
- The computational load is a lot easier/cheaper.
- I get the detail I need with fewer entries in the Data Table.
This last point is especially important because something I needed to avoid was creating a data explosion, saturating the Data Table to its capacity and overwhelming data operations on the table. This comes up again later.
To pull all of this together, the seed rule has to first juggle the outcome variables to make them respect the type values of their columns in a data table, which is why my rule has a set of “clean” variables. Data Tables today let you choose between String and Number for type values, while most of the Outcome variables are of type array by default.
For example, I need to extract the week number for the key (a string value). In the events section of my rule, I isolate the week number using a timestamp function:
$week_num = timestamp.get_week($e.metadata.event_timestamp.seconds)
Since $week_num is an array, I need to flatten the array and extract it as a string.
$clean_week = arrays.index_to_str(array_distinct($week_num), 0)
There’s similar juggling going on for columns of type “NUMBER” in the Data Table, because a number is actually a float, and most of the functions in YARA-L that work with numbers use them as integers. For example, my row values have an aggregate count of every CRX signal/domain combination (like a COOKIES_GET_ALL_INFO call sent to a domain).
That starts with a count of all matching events that I have to cast to a string:
$weekly_n_stageint = cast.as_string(count($e.metadata.id))
Why string? The cast.as_float function only works with strings:
$weekly_n = cast.as_float($weekly_n_stageint)
With all of this glorified data collection and massaging, I export the findings to a data table:
condition:
    $e


  export:
    %extension_behavior_seed.write_row(
        key:             $esdw_key,
        extension_id:    $ext_id,
        signal_name:     $signal,
        domain_name:     $clean_domain,
        week_number:     $week_key,
        weekly_n:        $weekly_n,
        user_prevalence: $user_prevalence,
        active_days:     $active_days,
        global_match:    $global_match
    )
}
After running the rule, it took about 20 minutes to crunch a year’s worth of log data to generate a Data Table with a couple of thousand lines in it.
Step 2: Calculate the Global Priors
With the seed table in place, the data is present to find the mean and the variance, necessary for calculating volume and inertia, across all extensions and signal type. The nice thing about having the table is that I can do the calculation once and use it many times before I update the table and need to recalculate the data.
However, for this I had to rely on something external. I had a lot of fun trying to figure out how I could force a YARA-L rule to do this too, and someday I might be able to coax it. Instead I turned to Python via a Cloud Run function in my GCP Org. By assigning a service account narrow IAM rights, I was able to strip down the role to the bare minimum to reduce risk.
The Chronicle v1Alpha API makes getting the Data Table a simple call:
       get_url = (f"https://chronicle.{location}.rep.googleapis.com/v1alpha/"
                   f"projects/{project_id}/locations/{location}/instances/{instance_id}/"
                   f"dataTables/{seed_table}/dataTableRows")
A while loop grabs the rows and cycles through the values, mapping the table schema before processing the data. After grabbing the data, the rest of the Python job is straightforward:
- Calculate the signal activity across all extensions (how many extensions use REMOTE_HOST_CONTACTED and at what frequency?)
- Calculate entity-specific activity - the signal activity and variance across each specific extension
- Blend the signal activity with the entity activity for a more accurate signal-specific baseline
- Organize the data
- Write it into a new Data Table that has the Global Prior data, specifically the “Alpha” (volume) and “Beta” (inertia) values
Alpha is mean squared over variance, while the Beta is the mean over the variance.
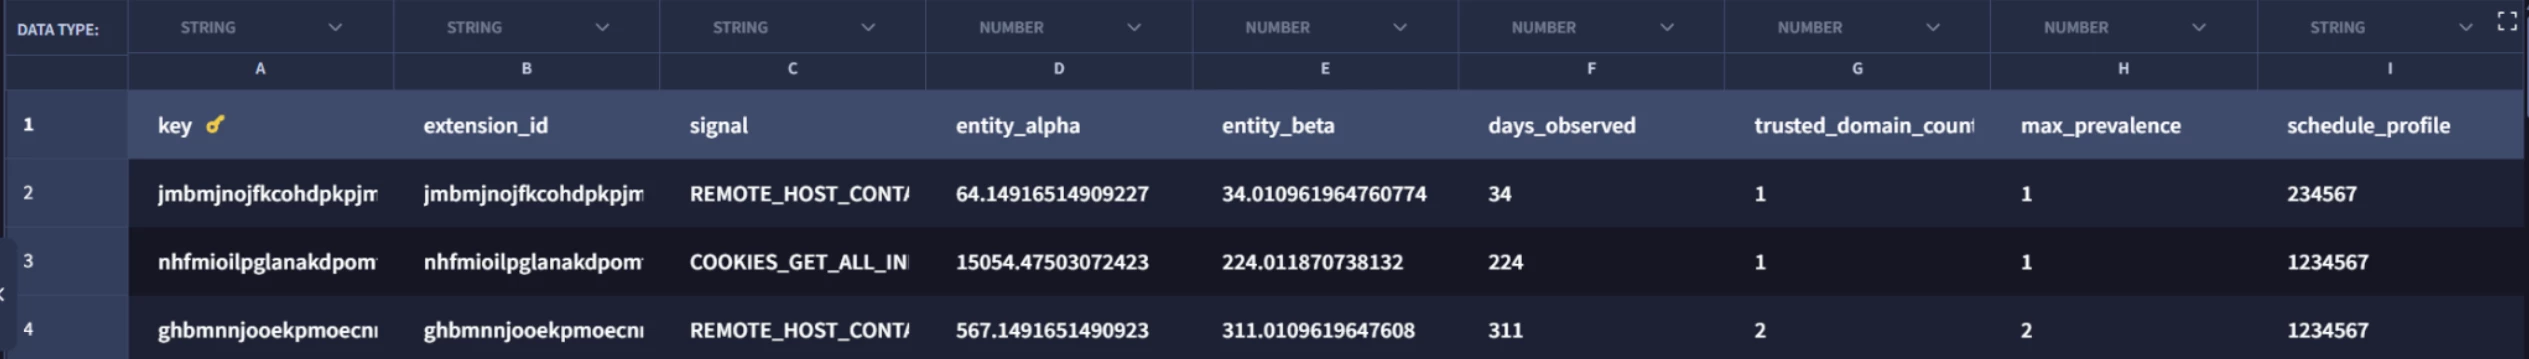
To make the Bayesian engine more flexible and discerning, I added some dimensions beyond the Alpha and Beta for each extension/signal pairing. These are the:
- Number of days the extension/signal has been observed in the tenant.
- The number of trusted domains that the extension/signal combination has been seen communicating to.
- The maximum prevalence of the number of users/entities who invoked the extension/signal in their managed Chrome instance.
- The days of the week during which this activity was observed.
Then it writes the data into the global priors table:
url_global = (f"https://chronicle.{location}.rep.googleapis.com/v1alpha/"

                      f"projects/{project_id}/locations/{location}/instances/{instance_id}/"

                      f"dataTables/{global_priors_table}/dataTableRows:bulkReplace")

        resp_global = authed_session.post(url_global, json=global_payload)

        update_results.append(f"Global: {resp_global.status_code}")
This all sounds straightforward, but as a SecOps user going back to Chronicle, this is a major leap ahead. I’m using Python to read a store of data, generate results, and push them back into the platform for general use within the platform!
Step 3: Observe the current data stream
Steps 1 and 2 were all about gathering data and establishing a baseline. The next two steps are about gathering data and comparing it to the baseline. Just as there is a seed rule that gathers the historic data, there is a rule that tracks the current stream (there’s actually two but it’s for an edge case I’ll explain later). I call this rule the “Cruncher” - it just crunches away at the current stream without generating any alerts.
The Cruncher writes to a different Data Table, one I call the “Holding Pen”. Data is meant to be transitory here, either on its way back to updating the Global Priors or being tossed out by a downstream evaluation. This table tracks a lot of the same table as the seed, but it includes specific userids in part to support that downstream evaluation, and in part to track uniqueness and growth when something “odd” shows up.
The rule’s events section starts looking a lot like the Seed rule:
events:
    $e.metadata.log_type = "CHROME_MANAGEMENT"
    $e.metadata.product_event_type = "extensionTelemetryEvent"


    // 1. Identity & Target Extraction
    $userid = $e.extracted.fields["profile_user"]
    $ext_id = $e.target.resource_ancestors.product_object_id
    $signal = $e.target.resource.name


    // 2. Domain Normalization
    $domain = strings.to_lower(re.capture(
        strings.coalesce(
            $e.target.resource.attribute.labels["destination"],
            $e.target.url,
            $e.target.asset.hostname,
            "unknown"
        ),
        "(?:https?://)?(?:www\\.)?([^/:]+)"
    ))
Then it goes out to find the alpha and beta values from the Global Priors data table:
    $e_alpha = %extension_entity_priors.entity_alpha
    $e_beta  = %extension_entity_priors.entity_beta
The rule fetches the values for the correct combination of extension+signal thanks to a join between the current telemetry and the data table:
    $ext_id = %extension_entity_priors.extension_id
    $signal = %extension_entity_priors.signal
The important thing to understand is that the Cruncher is aggregating extension+signal telemetry and putting it into another data table for the purposes of later analysis by another Python-based Cloud Run instance. The Cruncher does not determine whether something is different or improbable. However, the Cruncher makes a substantial contribution to the Bayesian calculation by deriving the threshold above which an action is “improbable” based on the alpha and beta values.
This threshold is defined in an outcome variable called $bayesian_surprise. A Bayesian Surprise metric is a thing and some Python later runs the actual calculation–the Surprise value of an observed operation. In the rule, $bayesian_surprise shows only the threshold at which the Surprise value has to exceed to be an improbable event, not the actual Surprise value of the current event. The value is an inverse probability calculation with a smoothing factor, defined in the rule:
    // Calculate Surprise - this is actually a Static Rarity Check that the Ferryman uses
    // to calculate the Dynamic Bayesian update.

    $bayesian_surprise = 100.0 / (($final_alpha / $final_beta) + 0.1)
The other significant contribution the Cruncher makes to lowering the computational workload of Python is to embed the Alpha, Beta, and the number of times the behavior was observed, which is based on a count of the metadata.id.
    $string_alpha = cast.as_string(cast.as_int(max($e_alpha)))
    $string_beta  = cast.as_string(cast.as_int(max($e_beta)))
    $string_count = cast.as_string(count($e.metadata.id))
    $math_handoff = strings.concat($string_alpha, "|",$string_beta, "|", $string_count)
As with the Seed, there’s work to create a key and format data for the Data Table schema before exporting the results to the Holding Pen Data Table:
  export:
     %extension_behavior_pen.write_row(
       event_key:          $event_key,
       extension_id:       $ext_id,
       user_id:            $userid,
       domain_name:        $domain,
       signal:             $signal,
       final_risk_score:   $bayesian_surprise,
       is_new_extension:   $zero,
       surprise_score:     $bayesian_surprise,
       timestamp:          $exact_time,
       risk_factors:       $risk_factors,
       b_state_vector:     $math_handoff,
       first_seen:         $clean_time
    )
Notice that one of these columns is called “is_new_extension” and the Cruncher writes out the results of $zero? In the Cruncher, $zero is 0:
$zero = cast.as_float(cast.as_string(0))
Why is there this work to write out a zero result statically? It goes back to when I said that there are two rules watching the current telemetry stream. The Cruncher works to examine extensions that are already known. If the extension is not known, the rule would break since it has nothing to use from the Global Priors.
The fix is to have a shadow rule, called the “Ghost Scout” that does almost the exact same thing except only apply to extensions with no prior history (someone installing a new extension), statically set the surprise_score Data Table field to 100, and otherwise construct a properly constructed row that won’t stop the downstream Python script from running.
The one interesting change in the events section is the use of “not” to scan the table key for the combination of an extension and signal:
not strings.concat($e.target.resource_ancestors.product_object_id, "|", $e.target.resource.name) in %extension_entity_priors.key
The Ghost Scout is otherwise writing out static values:
- $bayesian_surprise is a perfect 100 (something never seen before is completely unexpected because nobody expects the Spanish Inquisition).
- Alpha and Beta have a value of zero and that zero plus the count of how many times the new extension was seen get written out to the b_state_vector field in the $math_handoff variable.
Whether written out by the Cruncher or the Ghost Scout, the result is a steadily growing Data Table of current behavior. Chrome Extensions are very chatty, proving the value in using an aggregation key rather than having line items for each event. Without the key, the Pen would explode in a large organization.
Step 4: Determine whether the behavior is expected
With the Pen hosting a growing population of observed behavior and a SOC waiting to hear whether an extension is acting improbably, we turn back to Python to evaluate the Pen. At the highest level, the Pen calculates a Surprise value and if the value is too high (if it crosses the threshold the Cruncher calculated), the Pen sends an alert into SecOps.
It sets up a connection to SecOps via the Chronicle API:
base_url = f"https://chronicle.{LOCATION}.rep.googleapis.com/v1alpha/projects/{PROJECT_ID}/locations/{LOCATION}/instances/{INSTANCE_ID}"
Some functions read the Seed and the Pen:
def get_all_rows(session, base_url, table_id):
    all_rows = []
    url = f"{base_url}/dataTables/{table_id}/dataTableRows"
    page_token = None
    while True:
        params = {"pageSize": 1000}
        if page_token: params["pageToken"] = page_token
        resp = session.get(url, params=params)
        if resp.status_code != 200: break
        data = resp.json()
        all_rows.extend(data.get('dataTableRows', []))
        page_token = data.get('nextPageToken')
        if not page_token: break
    return all_rows
The Ferryman also updates the Holding Pen with additional, derived data:
def batch_update_rows(session, base_url, updates):
    if not updates: return
    table_parent = updates[0]['name'].split("/dataTableRows/")[0]
    url = f"https://chronicle.{LOCATION}.rep.googleapis.com/v1alpha/{table_parent}/dataTableRows:bulkUpdate"
    for i in range(0, len(updates), 200):
        chunk = updates[i:i + 200]
        payload = {"requests": [{"dataTableRow": {"name": u['name'], "values": u['values']}, "updateMask": "values"} for u in chunk]}
        session.post(url, json=payload)
What is happening here is:
- The Ferryman reads the Global Prior and Holding Pen tables
- Next the Ferryman makes a series of calculations
- Every row it reads results in some kind of finding
- The Ferryman writes the findings back into the Data Table row, actively changing values or appending others
This is very new in the world of SecOps. The Data Table is acting as an active scratch pad to track state for something initially called out by a YARA-L rule.
That second bullet about making a series of calculations is masking quite a lot of additional work. Overall the Ferryman is acting as a Security Sensor using Data Table row data as its source. When the Ferryman pulls in from the Holding Pen and Global Prior tables, the Ferryman:
- Calculates the Bayesian Surprise score for the event based on all of the data it has on hand from the two tables
- Examines the timing of events to see if there’s a rapid spread of new activity
- Checks to see if the event matches certain threat vectors such as activity at an odd time, something it hasn’t done before, or communicating with a new location
Any of these findings result in a descriptive tag that gets written back into the Data Table. If a Surprise score is especially high to cross into the realm of the improbable, the Ferryman constructs a UDM event, pushes it into SecOps, and notes in the Data Table (via the row update) that it sent an alert.
The Ferryman is able to construct all of the key UDM fields that it needs from the Pen:
            if current_risk_tags or final_score >= GAVEL_THRESHOLD:
                already_alerted = "ALERT_SENT" in str(vals[IDX_RISK_FACTORS]) if len(vals) > IDX_RISK_FACTORS else False

                if final_score >= GAVEL_THRESHOLD and not already_alerted:
                    gavel_events.append({"udm": {
                        "metadata": {
                            "event_timestamp": ts_iso,
                            "product_name": "Ferryman Bayesian Judge",
                            "vendor_name": "Muppet Labs",
                            "event_type": "GENERIC_EVENT",
                            "description": f"Risk Alert: {signal}",
                            "product_event_type": str(signal),
                            "ingested_timestamp": ts_iso
                        },
                        "principal": { "user": { "email_addresses": [str(vals[IDX_USER_ID])] } },
                        "target": {
                            "hostname": str(vals[IDX_DOMAIN]),
                            "asset": { "hostname": str(vals[IDX_DOMAIN]) },
                            "resource": {
                                "name": str(signal),
                                "resource_type": 0,
                                "attribute": {
                                    "labels": [
                                        {"key": "Risk Source", "value": "Bayesian Anomaly"},
                                        {"key": "Original Type", "value": "BROWSER_EXTENSION"},
                                        {"key": "First Seen", "value": str(new_vals[IDX_FIRST_SEEN])}
                                    ]
                                }
                            },
                            "resource_ancestors": [
                                {
                                    "product_object_id": str(ext_id),
                                    "resource_type": 0
                                }
                            ]
                        },
                        "security_result": [{
                            "risk_score": final_score,
                            "summary": " | ".join(current_risk_tags),
                            "severity": "HIGH" if final_score >= 80 else "MEDIUM"
                        }]
                    }})
                    current_risk_tags.append("ALERT_SENT")
Step 5: Test for badness
The Ferryman sends a signal to alert that something seems off. As with any other security signal device that sends a signal, e.g., EDR, Network, DLP, Email, etc., the question is “now what”? In this case, the original source event is a Chrome log event and you are working with network-centric threats. What is a CRX talking to and how is it doing so? This is where SecOps can step in to help you determine whether there’s something unsavory happening.
The Ferryman runs once an hour meaning that you can start running SecOps rules quickly. As soon as the UDM event arrives, there is a suite of rules ready to dig in deeper. Each of these rules has a nearly identical construction to create a tight join between the UDM event and the Chrome event that registered a high Surprise score:
  events:
    $crx.metadata.log_type = "CHROME_MANAGEMENT"
    $crx.metadata.product_event_type = "extensionTelemetryEvent"

    $userid = $crx.extracted.fields["profile_user"]
    $ext_id = $crx.target.resource_ancestors.product_object_id
    $signal = $crx.target.resource.name
    $ip     = $crx.target.ip

    $domain = strings.to_lower(re.capture(
        strings.coalesce(
            $crx.target.resource.attribute.labels["destination"],
            $crx.target.url,
            $crx.target.asset.hostname,
            "unknown"
        ),
        "(?:https?://)?(?:www\\.)?([^/:]+)"
    ))


    $bys.metadata.log_type = "UDM"
    $bys.metadata.product_name = "Ferryman Bayesian Judge"
    $bys.metadata.vendor_name = "Muppet Labs"

    $ext_id = $bys.target.resource_ancestors.product_object_id
    $domain = $bys.target.asset.hostname
    $risk_value = $bys.security_result.risk_score
    $severity = $bys.security_result.severity
    $signal = $bys.metadata.product_event_type
    $userid = $bys.principal.user.email_addresses
Once again, the logic to identify CRX activity repeats as it has in the Seed and Cruncher rules. Now it’s looking for the same event and creating a join on multiple vectors:
- Userid
- Extension ID
- Signal
- External domain
Below this are joins and/or logic to look for something. For example, here is a rule that joins the observed the domain against the VT Relationships table in the entity graph:
    // Uses VirusTotal integration via entity graph, this section maps the domain it contacts
    $vt.graph.metadata.source_type = "GLOBAL_CONTEXT"
    $vt.graph.metadata.vendor_name = "VirusTotal"
    $vt.graph.metadata.product_name = "VirusTotal Relationships"
    $vt.graph.relations.entity_type = "DOMAIN_NAME"
    $vt.graph.relations.relationship = "CONTACTS"
    $vt.graph.relations.entity.domain.name = $domain
Here is another rule that looks to see if the DNS registration is expired:
    // join access event to entity graph to use WHOIS data
    $whois_exprd.graph.entity.domain.name = $domain


    // Whois domains provided by GCTI Feed
    $whois_exprd.graph.metadata.entity_type = "DOMAIN_NAME"
    $whois_exprd.graph.metadata.vendor_name = "WHOIS"
    $whois_exprd.graph.metadata.product_name = "WHOISXMLAPI Simple Whois"
    $whois_exprd.graph.metadata.source_type = "GLOBAL_CONTEXT"


    // Domain expired before the event
    $whois_exprd.graph.entity.domain.expiration_time.seconds < $crx.metadata.event_timestamp.seconds
Then there is a match, usually on the extension and userid within a 30 minute window:
  match:


    $ext_id, $userid over 30m
Finally, there is a standard taxonomy in the outcome variables that become useful for a composite detection:
  outcome:


    $bayesian_risk = max($risk_value)
    $bayesian_severity = array_distinct($severity)
    $ext_signal = array_distinct($signal)
    $ext_domain = array_distinct($domain)
    $user_id = array_distinct($userid)
    $assessed_risk = "Expired DNS Registration"
    $tier = "1"


    $risk_score = 0
The “tier” is important because it helps determine the severity of the threat. It also factors into whether the observed extension propagates back to the seed.
The risk score of zero means the detection won’t show up in the Risk Analytics dashboards, which is what I want since I manage the risk score in a downstream composite detection.
Each of the rules have a metadata tag called “crx-family” and with it the final composite detection rule can step in and determine the nature and severity of the threat.
The Signal Analyzer starts by finding the rules that have run and generated detections:
  events:
    $id = $d.detection.id
    $type = $d.detection.type
    $ruleName = $d.detection.detection.rule_name
    $ruleId = $d.detection.detection.rule_id
    $d.detection.detection.rule_labels["family"] = "crx-behavior"
Then it retrieves information from that taxonomy of outcome variables, plus the extension ID:
    $ext_id = $d.detection.collection_elements.references.event.target.resource_ancestors.product_object_id


    $riskScore = $d.detection.detection.outcomes["risk_score"]


    $crx_bayesian_risk      = re.capture($d.detection.detection.outcomes["bayesian_risk"], "^(\\d+)(?:\\.|$)\\d*")
    $crx_bayesian_severity  = $d.detection.detection.outcomes["bayesian_severity"]
    $crx_ext_signal         = $d.detection.detection.outcomes["ext_signal"]
    $crx_ext_domain         = $d.detection.detection.outcomes["ext_domain"]
    $crx_user_id            = $d.detection.detection.outcomes["user_id"]
    $crx_assessed_risk      = $d.detection.detection.outcomes["assessed_risk"]
    $crx_ext_ip             = $d.detection.detection.outcomes["ext_ip"]
    $crx_tier               = $d.detection.detection.outcomes["tier"]
All of this happens within a 30 minute window and matches against the extension and userid:
  match:


    $ext_id, $crx_user_id over 30m
The outcome variables mostly map in the specifics of what was observed, but it also walks through calculating a risk score. It looks at the tiers for all observed rules and assigns a baseline score.
    $rule_tier_high = if(max(cast.as_int($crx_tier)) =1, 80, 0)
    $rule_tier_med = if(max(cast.as_int($crx_tier)) = 2, 30, 0)
    $rule_tier_low = if(max(cast.as_int($crx_tier)) = 3, 10, 0)
It also factors in a couple more items:
- How many rule detections were there within the window?
- What was the Bayesian Surprise score that the Ferryman calculated?
It takes all of those factors and creates a temporary risk score value:
    $trigger_count = count_distinct($id)
    $bayesian_risk = max(cast.as_int($crx_bayesian_risk))
    $risk_score_temp = (($trigger_count *10) + //more vectors means a higher risk
                    ($rule_tier_high)  +
                    ($rule_tier_med)   +
                    ($rule_tier_low)   +
                    $bayesian_risk)
Since risk scores can only have a max risk score of 100, the final risk score swaps in a 100 if the calculated value is higher, or uses the calculated value:
$risk_score = if($risk_score_temp > 100, 100, $risk_score_temp)
The condition has a built-in safety valve to make sure that only rules that had tiers factor into the final detection:
  condition:


    $d and ($rule_tier_high !=0 or $rule_tier_med !=0 or $rule_tier_low !=0)
}
With that, you have an evaluation that can kick off a case as well as help determine whether you want to “normalize” the data back in the seed.
Step 6: Determine whether to promote the Pen findings to the Seed
For reasons of data integrity and system performance alone, you need to figure out what to do with the Pen. The Pen grows continuously with each finding the Cruncher makes of all active CRX events. At some point the Python scripts would have a hard time processing everything, and a little later the Data Table would fill up. From the standpoint of the Bayesian detector, the work is not done. New event data needs to be promoted back into the seed if it represents “non-malicious” behavior. You have two really good reasons to figure out how to clean up the Pen.
Enter Python once more. One last script judges the events in the Pen and prunes it accordingly. As with the Priors and Ferryman scripts, the “Judge” script grabs the Pen and Seed Data Tables. The Ferryman has updated all Pen tables with some kind of disposition, whether the activity is benign or suspect. The Judge sees this and has a few courses of action.
- “Normal” activity where an extension is seen doing something that it’s always done promotes back to the Seed immediately with the current week number. That same activity older than a year later gets “pruned” so that the Seed is intentionally limited to the past year. These findings have no tier finding nor do they have a high Surprise score; remember that the Cruncher sees all extension behavior and writes it to the Pen.
- Malicious activity, denoted as a Tier 1 finding, does not promote to the seed and is immediately deleted from the Pen.
- Tier 2 findings are highly suspicious and stay in the Pen until someone decides what to do with them.
- Tier 3 findings are more odd than problematic and remain in the Pen for a maximum of 30 days. If nothing else happens, they promote after 30 days on the assumption that any flags they threw were inconsequential.
A word on Tier meanings
A question I had to grapple with is which Tier to assign to different rules, since they had a direct bearing on the severity of the rule and whether the behavior would be promoted back. Tier 1 is obvious, Tier 2 requires a Case-based approach to figure out the right next step.
Tier 3 is something of an act of faith because, yes, there’s a finding but it might not be all that big of a deal or could even be a guilt-by-association.
Consider the VT Relationships finding, which I found in my test environment. A CRX was communicating to a domain with associations with known malware and threat actors. At first I thought that a bad association like that was a Tier 1 finding. Then I realized that the CRX could be talking to a completely valid domain that other bad things happen to use – that’s a perfectly valid interpretation of a Virustotal Relationship result. If all a CRX does is talk to a domain that other malware is known to talk to, that’s not worth an indictment of the CRX.
Compare that to a CRX that is seen sending data to a domain with an expired WHOIS registration. That is a clear Tier 1 violation because the domain can easily be hijacked and used against a company.
The in-between Tier 2 finding needs someone to make a judgement call. For example, a CRX seen communicating with a low-prevalence domain (no more than 3 user profiles) might be a CRX talking to an unknown C2. On the other hand, in a company with a liberal extension install policy this could be one person with a really esoteric and completely benign personal interest.
One wrinkle: the tier 2 findings never make their way out of the Pen! When the Ferryman analyzes events and finds something that results in an alert, the Pen typically looks like this:

The risk score takes on the Surprise score, there are risk factors that make their way to the Signal Analyzer, and the b_state_vector is an aggregate result of the Alpha score, Beta score, and local count. There is no tier data.
All rise for The Judge
The Judge has to consider the tiers, which aren’t in the Pen. To solve this, the Judge leans into the Chronicle v1Alpha API once more to retrieve the tier directly from the composite detection! The script hard codes the rule ID of the Signal Analyzer:
ANGEL_RULE_ID = "ru_1ef2243c-a62a-496f-b6b8-bd0e323a59ba"
(Why “Angel” you ask? Originally I was going to call this the “avenging angel” script and Gemini never let that go during the vibe coding exercise.)
Then the Judge uses the API to retrieve the data directly from the detection’s outcome variables:
def get_angel_verdicts_wrapper(chronicle_client, rule_id):
    verdicts = {}
    try:
        end_dt = datetime.datetime.now(datetime.timezone.utc)
        resp = chronicle_client.list_detections(rule_id=rule_id, start_time=end_dt - datetime.timedelta(days=30), end_time=end_dt)
        detections = resp.get('detections', []) if isinstance(resp, dict) else resp
        for d in detections:
            for item in d.get('detection', []):
                outcomes = item.get('outcomes', []) or item.get('detectionFields', [])
                dom, tier_val = None, 3
                for ov in outcomes:
                    k, v = ov.get('key') or ov.get('name'), ov.get('value')
                    if k in ["ext_domain", "domain"]: dom = v
                    elif k == "tier": tier_val = int(v[0]) if str(v).isdigit() else (1 if "1" in str(v) else (2 if "2" in str(v) else 3))
                if dom:
                    if tier_val < verdicts.get(dom, 99): verdicts[dom] = tier_val
    except: print("   [WARNING] Angel Fetch Failed.")
    return verdicts
Adding a Human to the Loop
The system is designed to flag issues and update the Priors with only “good” extensions. It makes sense that you don’t normalize behavior from an extension talking to a known C2, so Tier 1 findings get deleted from the Pen and never promote to the see. Similarly, Tier 3 findings can go through a wait-and-see trial and normalized after 30 days if nothing else happens. You might want a human to step in, but you can let it go in unopposed. In each case, the system I created will remove Tier 1 and Tier 3 findings on its own.
Tier 2 findings are in a grey area - the Judge never removes them from the Pen. They’re the example of where you want a human in the loop. If you decide to exclude the extension from your environment, you want the records removed from your Pen. If you break the other way and let the extension in despite a Tier 2 finding, you want that noted with the entries removed from the Pen. However you will never let a Tier 2 finding promote back to the seed table because that is normalizing bad behavior.
To solve for this I constructed a playbook.
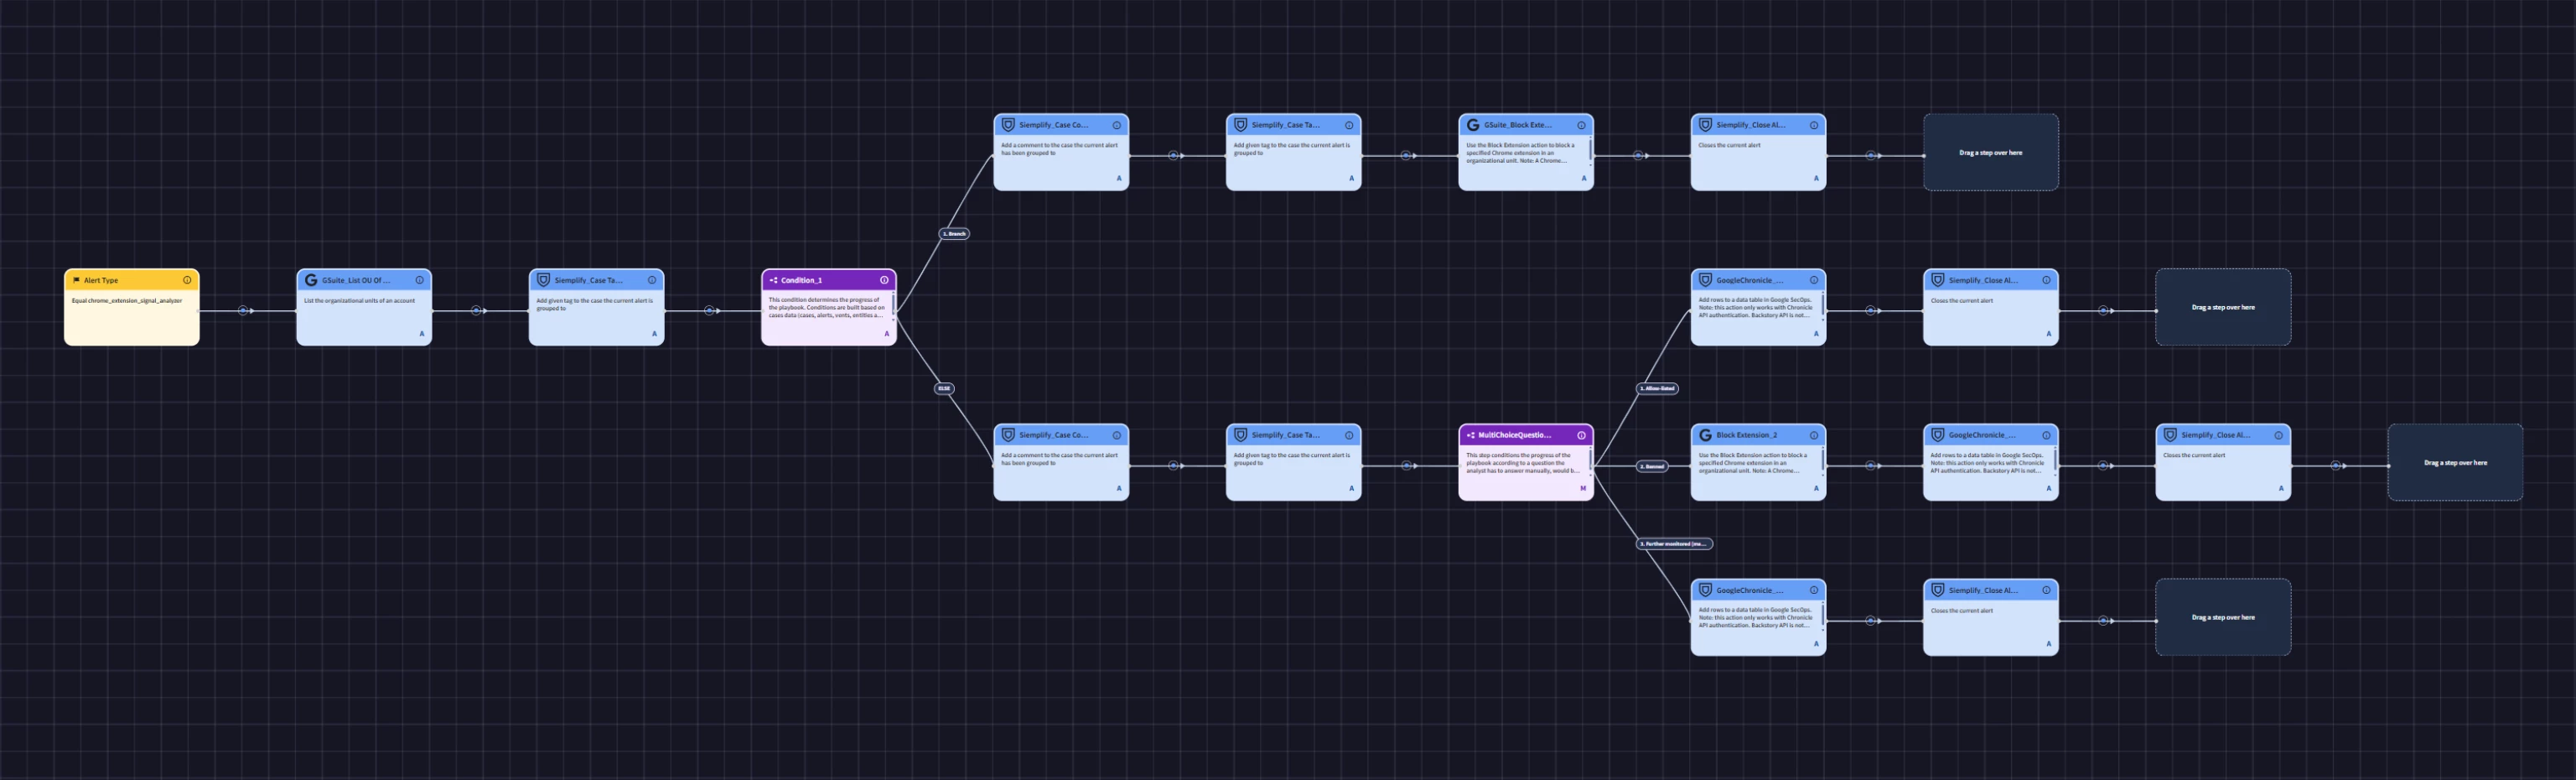
The general idea is that Tier 1 extensions get added to a permanent exclusion list and Chrome Enterprise Premium restricts them from all managed Chrome profiles.
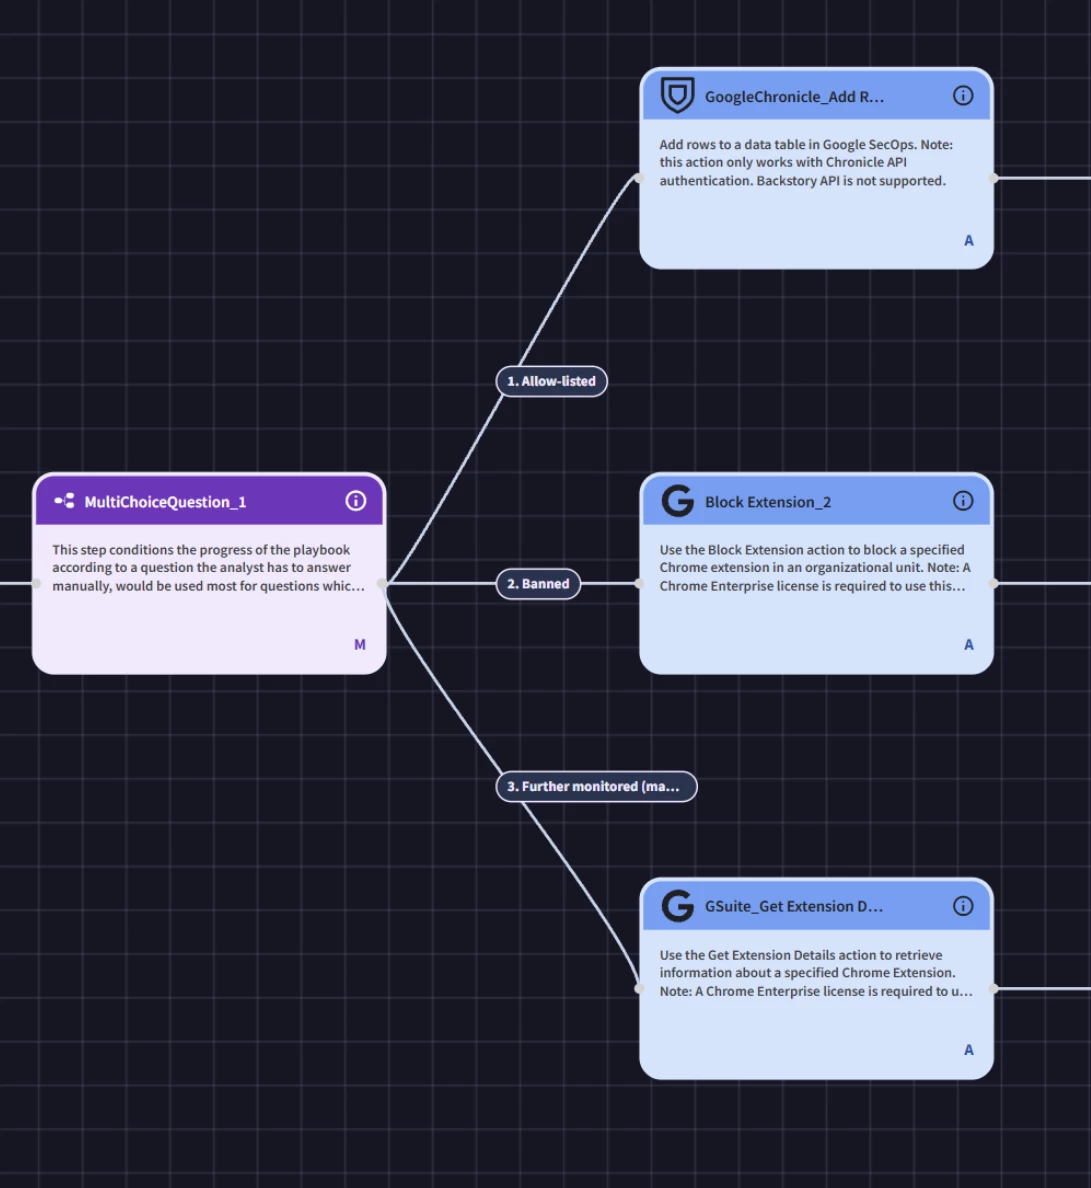
Tier 2 and Tier 3 findings let Analysts choose between allow-listing, banning, or wait-and-see
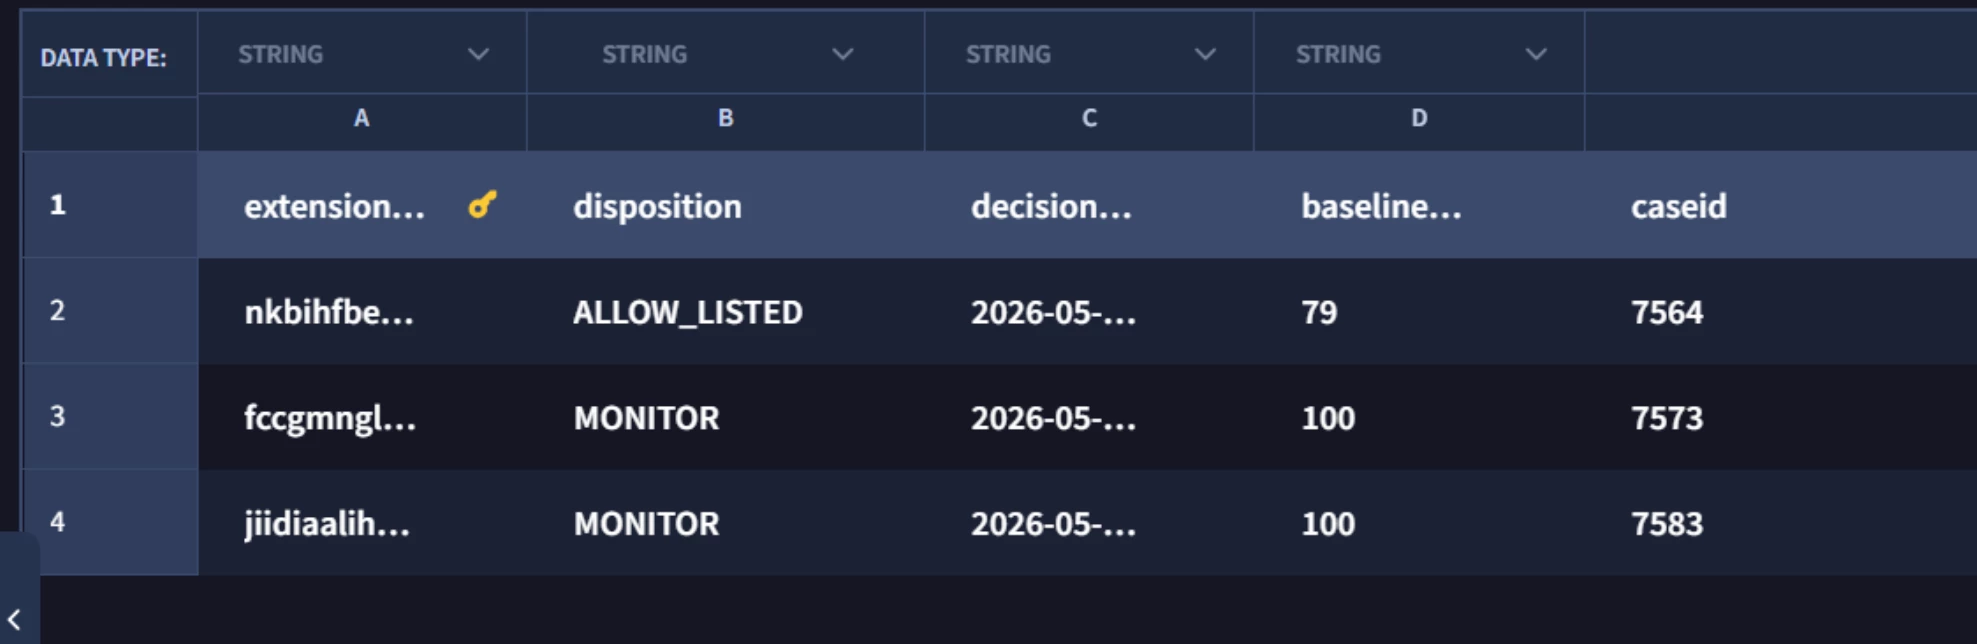
If you decide not to block the extension or let it wait longer, it goes to one final Data Table where the extension, disposition, Surprise score, and Case ID are listed out. The Judge can use this to reference what to do with any Tier 2 finding.
The fact remains that an extension with a Tier 2 extension can trigger the Bayesian Detector again, so there’s further logic in the Ferryman looks to see if the newest Surprise score is 1.5x the previous Surprise score, included in the the Tier 2 table, or a flat 100 since that is the maximum score.
Why not just run all the rules all the time?
A few people have looked at the system and asked why I don’t simply run the portfolio of detection rules on all extensions? The short version is that I can’t, or I could but not as quickly.
Chrome Extensions are always reporting data in. I could write a rule that looks for unique extensions in an environment and test them against some of the threat vectors I have now, but that would translate into a lot more overhead of rules running when they don’t even need to. With the high frequency of extensions reporting, that would mean a continuous stream of heavy processing rules launching to evaluate highly repetitive, normal activity. One way around this is to run a blind checker once a day for all extensions, but that still means testing a lot of “normal” activity for a lot of overhead.
By using Probability as a flag, I can run more expensive rules within an hour of the initial detection. The Bayesian detector also has a unique condition that YARA-L cannot find on its own: a possibly hijacked extension. If the Ferryman indicates a potential hijack, that becomes an automatic YARA-L pass-through rule.
Thanks for reading
Between this and my three Medium articles you’d think I covered this pretty well. In truth I’ve still glossed over a number of details that made this an interesting project. I’m making the source available for all to analyze and leverage.
Even if your interests aren’t in tracking the behavior of Chrome extensions, or probability in general, it should be clear now that combining Data Tables, the Chronicle API, and Composite Detections opens the door to a number of possibilities. Effectively I’ve used it to extend SecOps with custom Python functions, creating a new source for signals with focused response capabilities.
