


Table of Contents
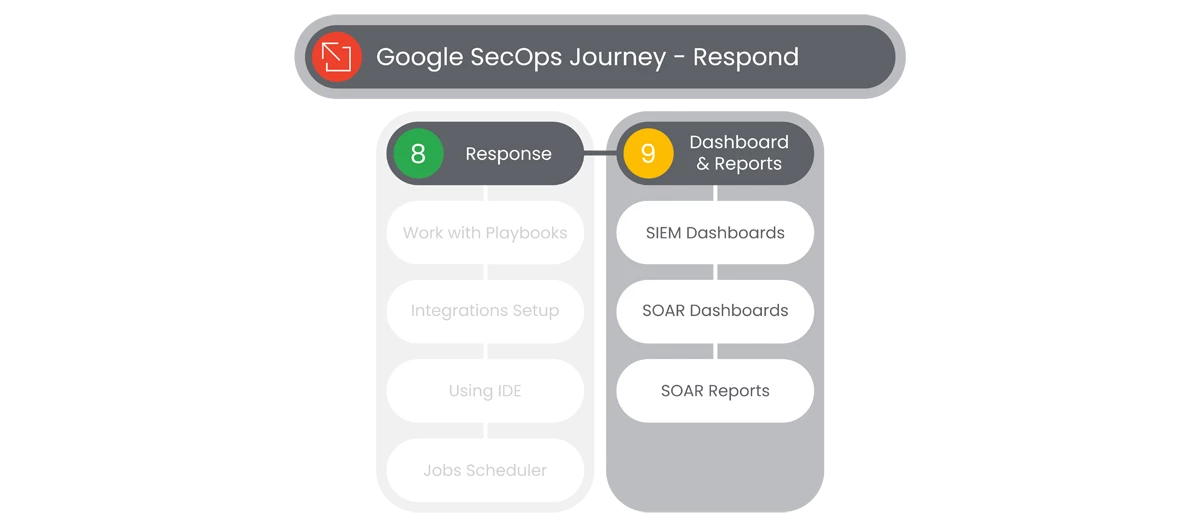
Google SecOps provides you the type visualization required to maintain awareness of security events, the SOC environment, and case information, in one product. Being able to communicate with your team and peers in security, in an instance, enables your team to effectively manage threats. Visualization can be a game changer. With Google SecOps’ Dashboards and Reports, users can visualize their Security Environment with ease.
Actions

SIEM Dashboards
Google SecOps’ Dashboard page in the platform enables analysts to manage dashboards, giving them an overview of the specified data in various views in the form of widgets. A dashboard holds a maximum of 12 widgets, which can display data in various forms such as pie charts, horizontal or vertical bars, tables, ROI charts, etc., for any specified SOC environment or case occurrence time.
- Users will navigate to the left-side Navigation Bar and then select from the Dashboards and Reports dropdown menu.
- Users will then select SIEM Dashboards from the dropdown menu, which will display the SIEM Dashboards available.
- The SIEM Dashboard page sidebar will display the following options:
- Default Dashboards
- Personal Dashboards
- Shared Dashboards
- If there are no Dashboards available, or the user would like to add a Dashboard, select the Add button, next to Personal Dashboards or Shared Dashboards.
- In the Add Dashboard dropdown menu, users can select to:
- Create New
- Import Dashboard
- At the top-right of the SIEM Dashboards page, users can select to:
- Reload the page
- Hide Filters
- Use Dashboards Actions
- In the Dashboard Actions selection, users can choose to:

- Clear Cache and Refresh
- Download
- Schedule Delivery
- Reset Filters
- In the Default Dashboards, users will see the pre-defined Dashboards consisting of:
- Context Aware Detections- Risk
- Data Ingestion and Health
- IOC Matches
- Main
- Rule Detections
- User Sign In Overview
- If a user selects to add a New Dashboard, users will see a New Dashboard page. In the middle of the page, users will see words “This Dashboard is Empty.” Users will select the Edit Dashboard button, below the text.
- Users will name the New Dashboard, and select the Add button. After selecting the Add button
 , users will see a dropdown menu that will display the following options for the Widgets that will be added to the Dashboard:
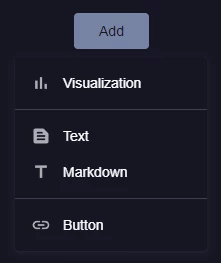
- Visualization
- Text
- Markdown
- Button
- Users will be able to explore different Visualizations:
- Entity Graphs
- IOC Matches
- Ingestion Metrics
- Rule Detections
- Rulesets with Detections
- UDM Events
- UDM Events Aggregates
- Users will be able to add a Text Widget, in the Edit Dashboard.
- Markdown Tiles are options for formatting the user’s Text or adding Links and Images that can make your Dashboards pop. Users can select a Markdown Tile, in the Edit Dashboard.
- Users will be able to Add a Button, with both Content and Design options:
- Content
- Label
- Link
- Description
- Design
- Button Style
- Color
- Button Size
- Alignment
- Content
- When all fields and options are complete, users will select Save.
Relevant Documentation Links

SOAR Dashboards
Google SecOps’ Dashboard page in the platform enables analysts to manage dashboards, giving them an overview of the specified data in various views in the form of widgets. A dashboard holds a maximum of 12 widgets, which can display data in various forms such as pie charts, horizontal or vertical bars, tables, ROI charts, etc., for any specified SOC environment or case occurrence time.
Steps
- Users will navigate to the left-side Navigation Bar and then select from the Dashboards and Reports dropdown menu.
- Users will then select SOAR Dashboards from the dropdown menu, which will display the SOAR Dashboards available.
- The SOAR Dashboard page will display the selected Dashboard, which can be selected from the Dashboard Selection menu at the top-left of the page. Below the Dashboard Selection menu, users can see the Owner of the Dashboard.
- On the top-right of the Dashboard, users will see:
- Filter Option
- Time Range
- Environment
- Menu

- Share Dashboard with Others
- Export
- Save as a Report Template
- Delete Dashboard
- Refresh

- Import

- Add Widget

- Filter Option
- To add a New Widget, users will select the Add Widget button, or the empty Widget with a plus sign, and Widget Settings popup will appear.

- In the Widget Settings popup, will allow users to:
- Select Data Display (Graph, Entity, Chart)
- Corresponding Fields
- Number Of
- Calculate Field
- Group By
- Number of Results
- Order By
- Title
- Widget Width
- Filters
- Preview
- When complete, users will select Create.
Relevant Documentation Links
- [All Steps] https://cloud.google.com/chronicle/docs/soar/monitor-and-report/soar-dashboards/add-dashboard-widgets

SOAR Reports
Google SecOps Reports come in useful to justify Return on Investment (ROI) to upper management and to achieve transparency and accountability to customers and fellow colleagues.
Google SecOps provides analysts with five predefined Reports and the option to create new ones. You can export and import Reports to other platforms.
Steps
- Users will navigate to the left-side Navigation Bar and then select from the Dashboards and Reports dropdown menu.
- Users will then select SOAR Reports and SOAR Reports page will appear.
- Users will see five pre-defined reports templates available:
- General
- Management
- ROI
- SLA
- Tier 1
- Users can select the following options at the top of the Reports page:
- Search field
- Menu
- Refresh
- Import
- Add New Template
- Users will see a list of available reports, under the following columns:
- Category
- Name of Template
- Created By
- Creation Time
- Scheduler
- Generate Report

- When a Report is selected, users will see an Editor and Scheduler section to the right of the Report List.
- When a user selects a Report, the Widgets that the user wants in the Report can be edited by selecting the Edit Widget button
 , which will appear when the user’s mouse hovers over the Widget they choose to Edit.
 - Additionally, users can delete Widgets by selecting the Delete button, next to the Edit Widget button.
- To Schedule a Report, users will select the Scheduler section and click on the Add New Schedule button.
- In the the Scheduler section, users can select the following fields:
- Enable
- Environment
- Time Frame
- File Type
- Mail to
- Message
- Repeat Schedule
- Set Time
- Enable
- When complete with the Scheduler, user’s will select Save.
- To Generate a Report, users will select from a listed Report, and click Generate, which will display a Generate Report popup.
- In the Generate Report popup, users will select the following options:
- Environments
- Time Frame
- File Type
- When complete, users will select Download. The Report will appear in the user’s download folder, available to disseminate.
Relevant Documentation Links
- [All Steps] https://cloud.google.com/chronicle/docs/soar/monitor-and-report/soar-reports/understanding-reports
Next Step: Security Operations: You have completed your Google SecOps Journey!
Previous Step: Security Operations: Step 5.1 - Respond | Response