


In this post, I will demonstrate how to generate a simple report using MSV Report Builder
Begin by navigating to Analyze > Report Builder > Create New Report. The report will generate visualizations and data tables based on the job results.
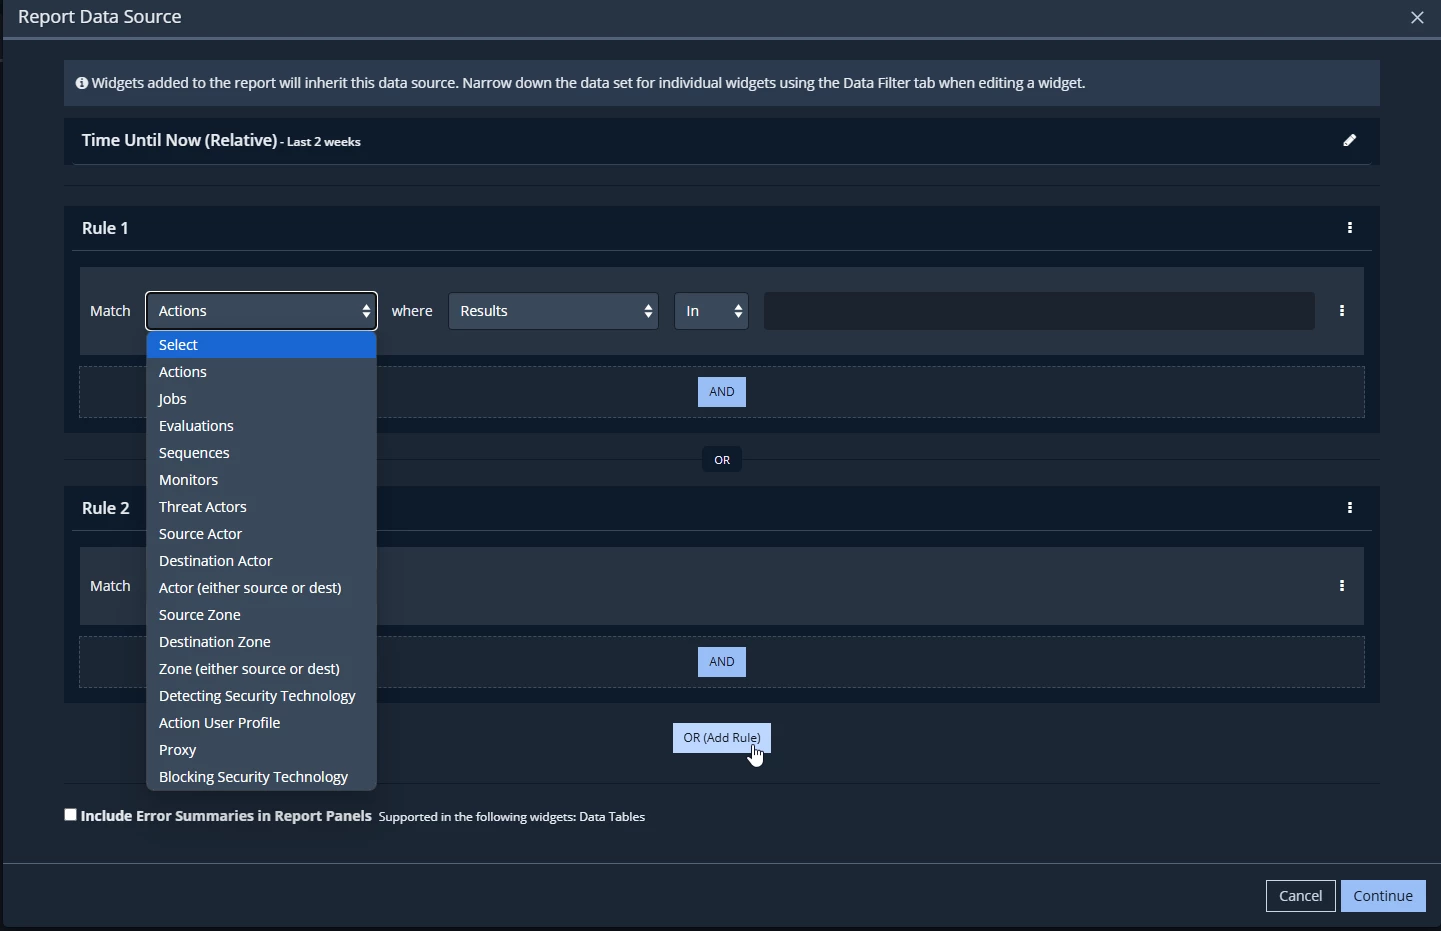
- Selecting Datasource : Specify the time range for the report, then include the logical filter. Note that you can select multiple filtering conditions and fields.
- Adding Panels: Select one of the available panels, which are templates for the visualizations/datatable. There are three main types ; Layout panels which organize or split the layout into multiple panels, data visualization panels which contain the charts, and content widgets which contain the text-based data like data tables or text blocks.
In this example we will pick the data table since it is the basis for using any CSV-reader analysis tools.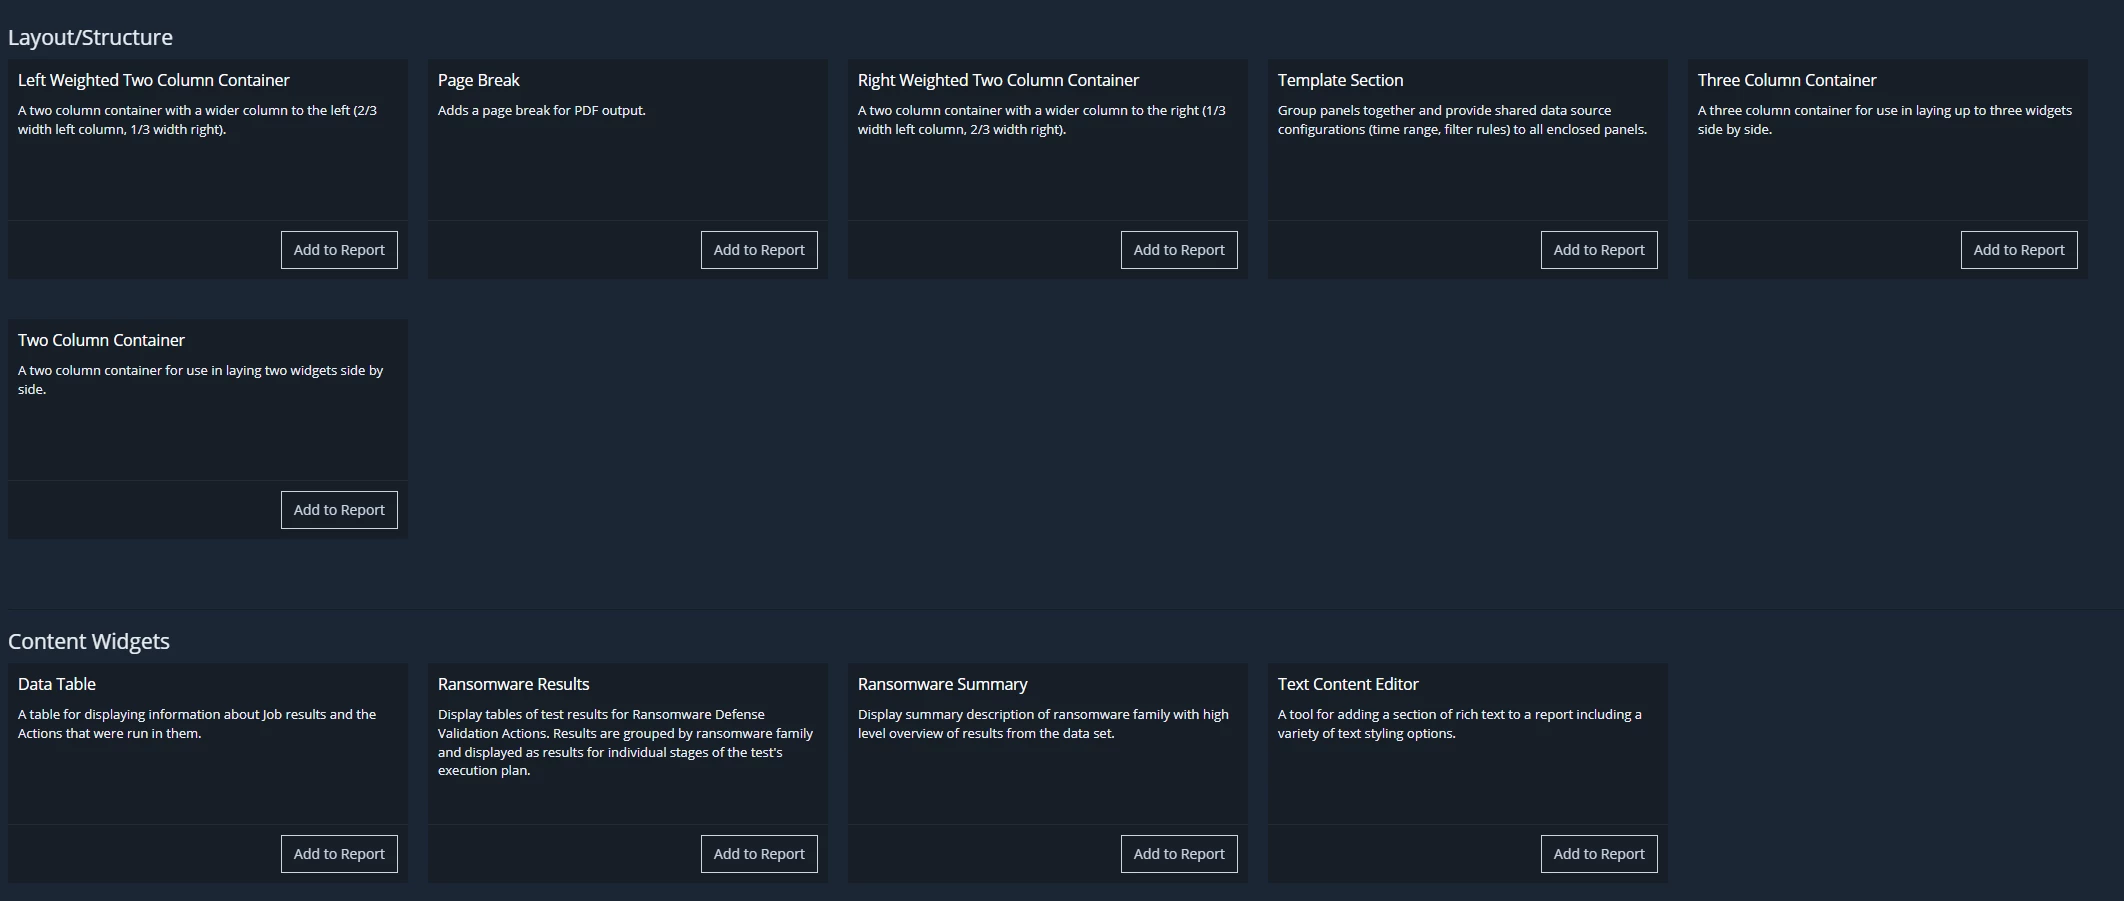
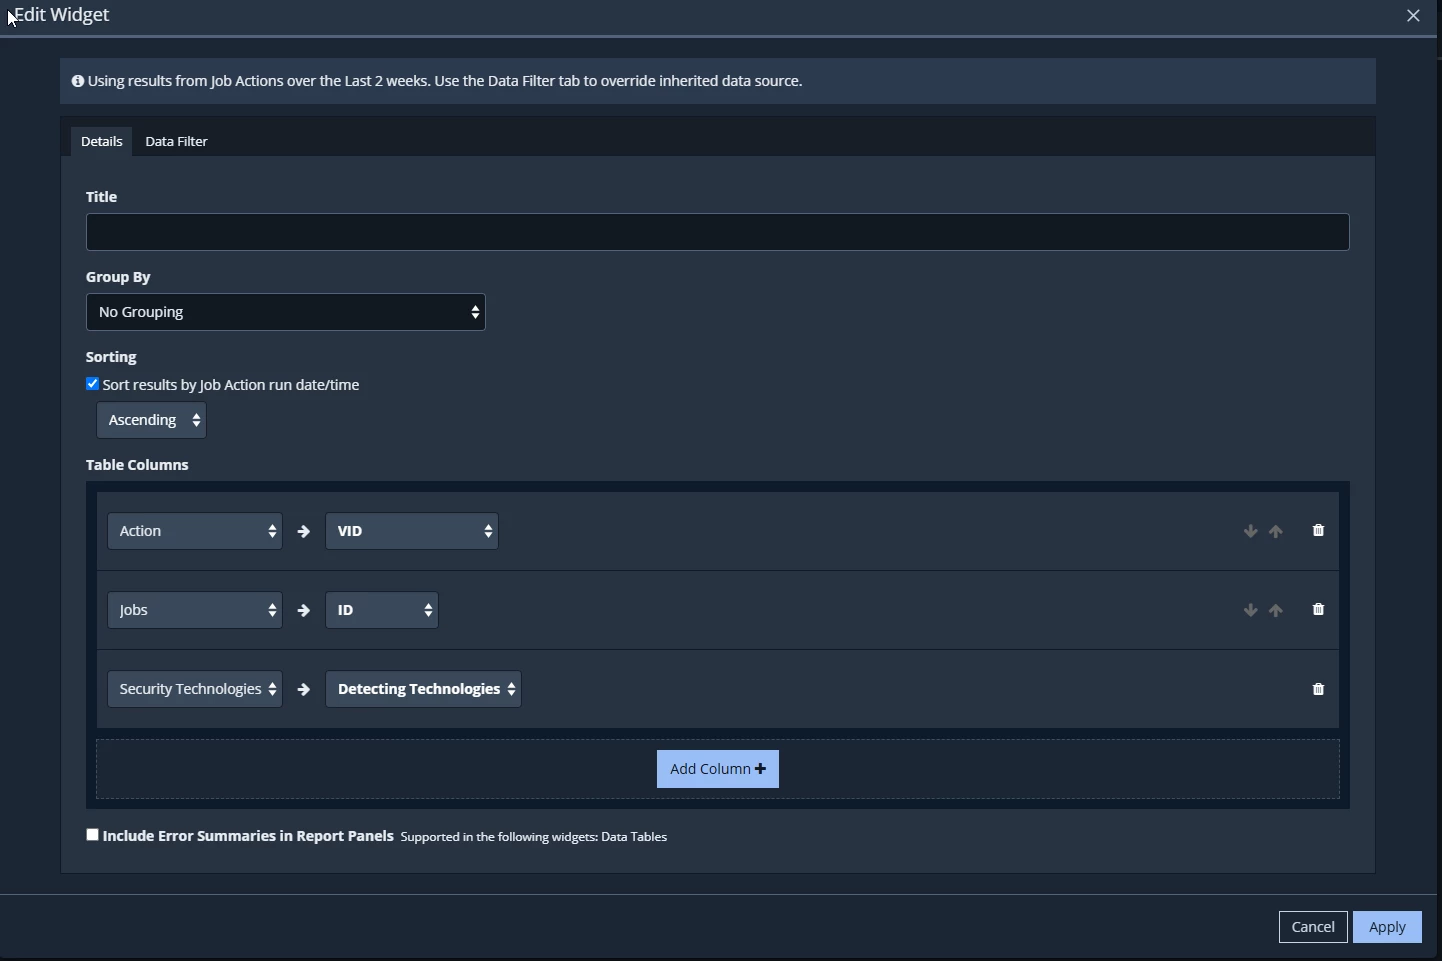
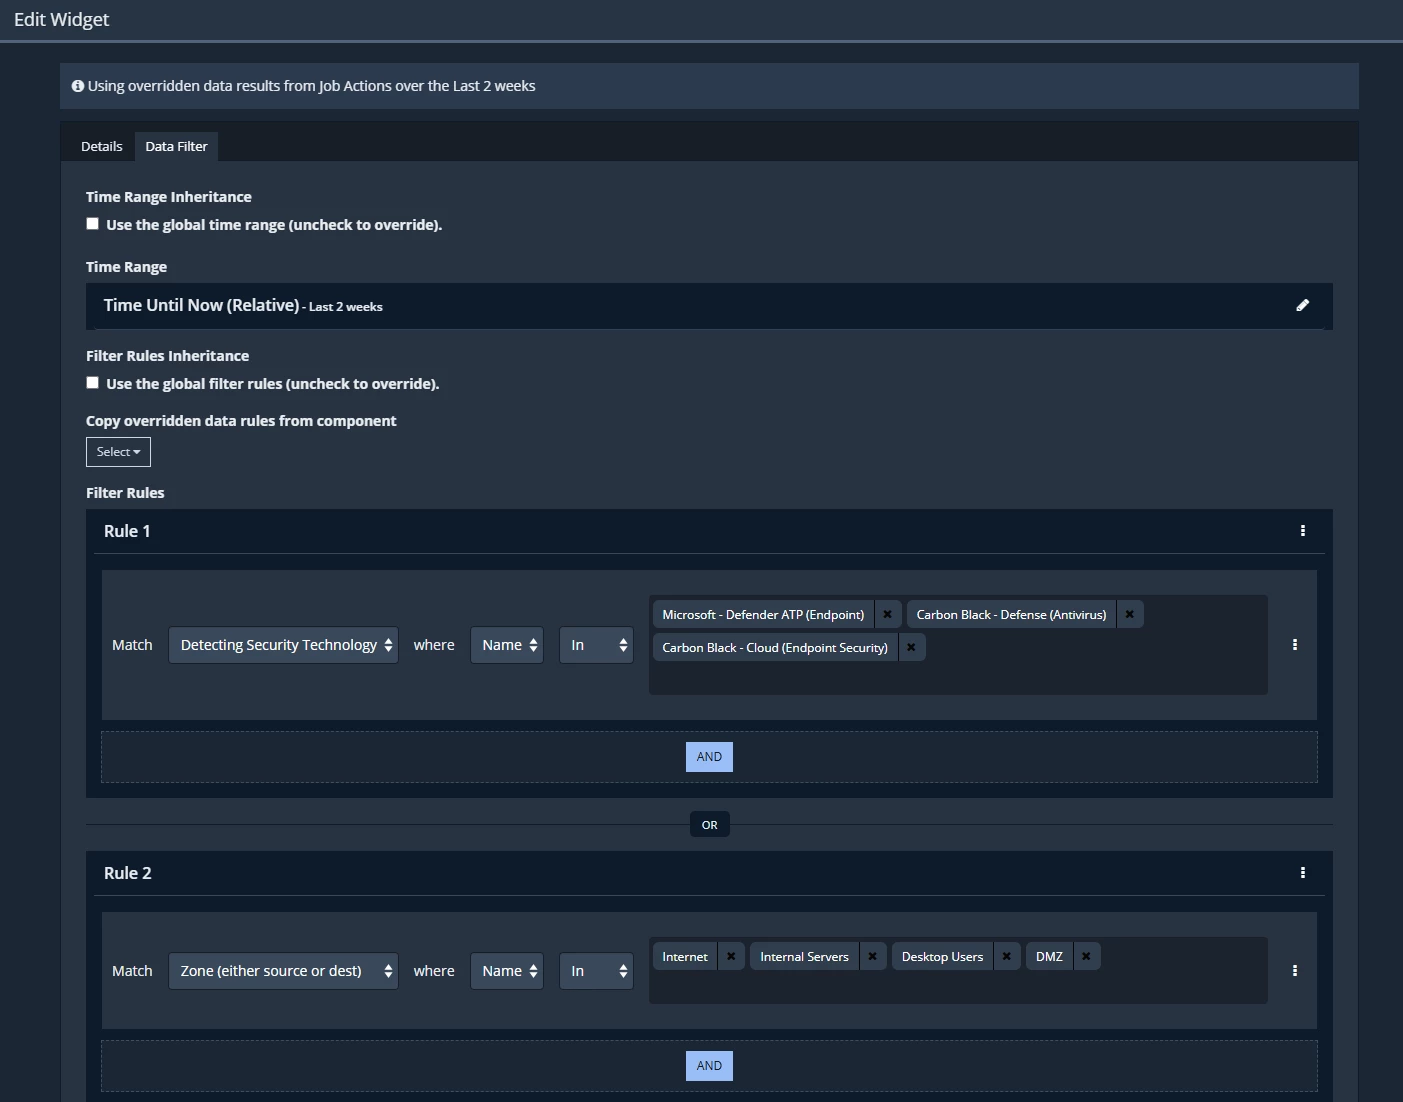
- Panel Configuration: For this example, required table columns are added to the datatable. In addition, another data filter can be applied on the table level.
-
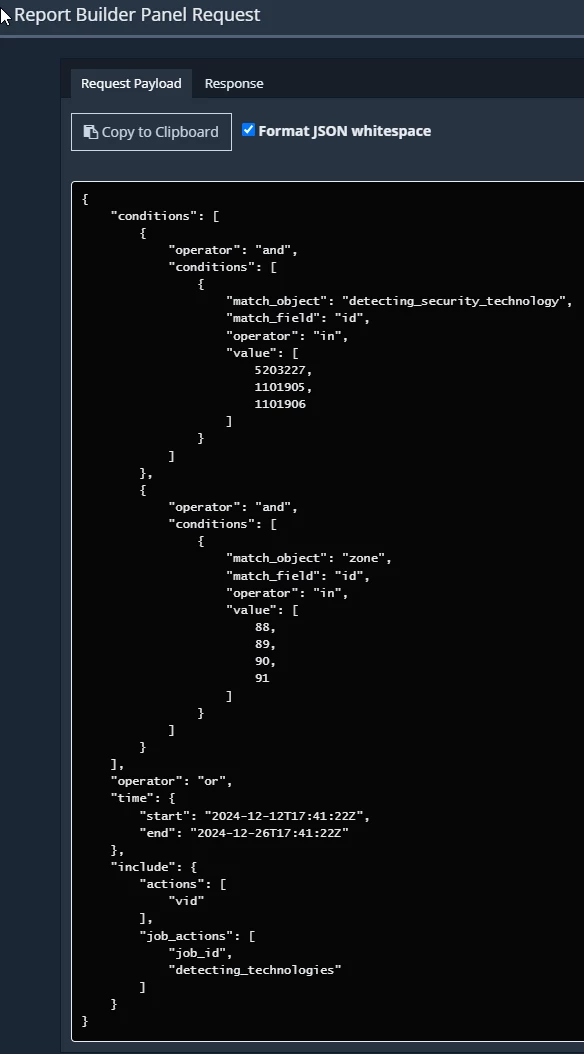
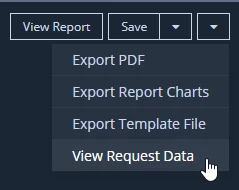
Finally, save the report. For automation, use the "View Request Data" feature to generate the API call JSON body required for querying the same data programmatically.
-
Optionally, you can export the report template as a vbr file using "Export Template File" to reuse it in other instances or as a backup."