

It’s been a while since we discussed dashboards in Google Security Operations (SecOps), so today we are going to revisit dashboards with an eye towards applying some additional filters to charts. We’ve previously discussed some basic filtering using the global time filter and a string match against a field. If you haven’t worked with filtering before, I’d recommend taking a few minutes to read this blog for context before diving in.
Our focus today expands beyond a single filter to constraining the inputs of the dashboard using filters. The constrained listing of inputs could be from a manual list or dynamically derived from data sets like detections, events or data tables, to name a few.
Using Multiple Filters
To highlight the filtering methods available to us, we are going to use a dashboard that utilizes detections and focuses on a specific chart. This chart contains a listing of the detections for the past seven days on our tenant. To highlight the filtering in action, we are going to use a table view of the output.
Here is the underlying query that powers the chart.
$alert_state = detection.detection.alert_state
$rule_pack = detection.detection.rule_set_display_name
$rule_type = detection.detection.rule_type
$severity = detection.detection.severity
$rule_name = detection.detection.rule_name
match:
  $rule_name, $rule_pack, $alert_state, $rule_type, $severity
outcome:
  $detection_count = count($rule_name)
order:
  $detection_count desc
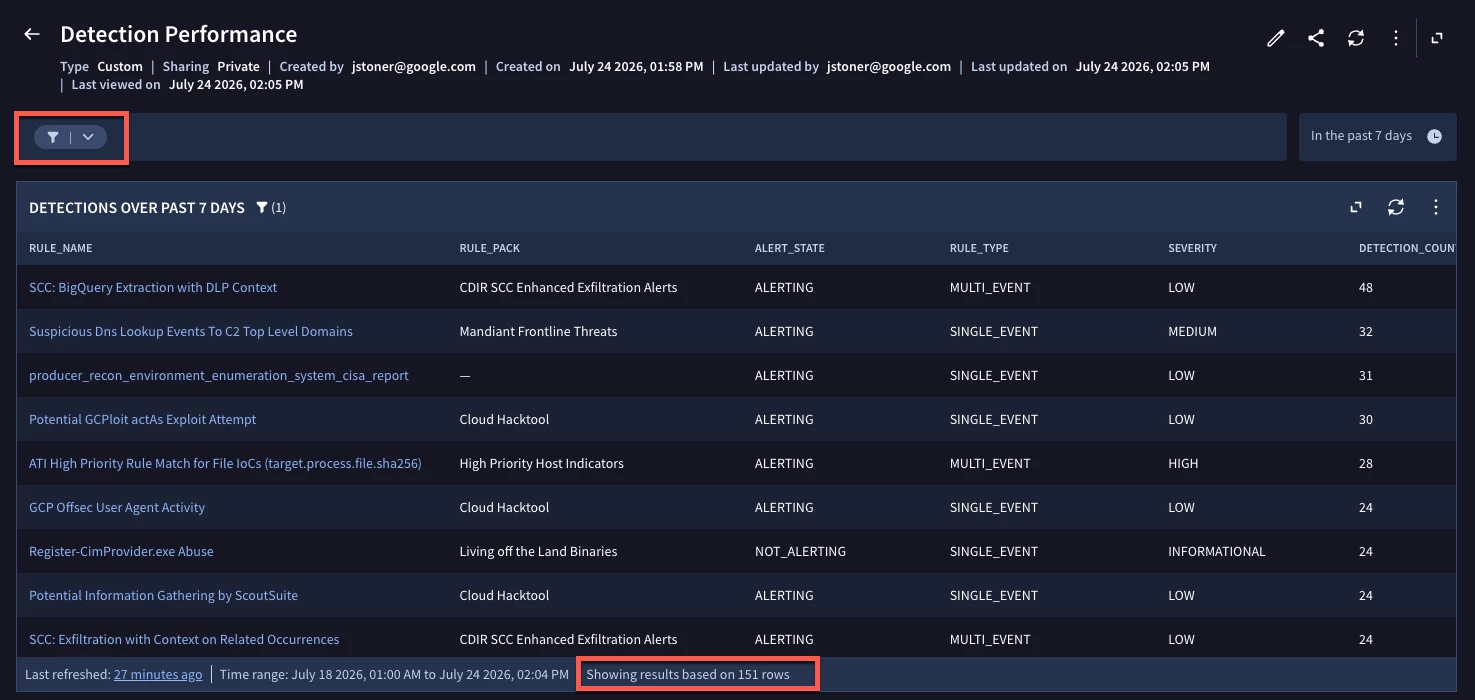
This unfiltered chart aggregates on the rule name and pack, the alert state, rule type and severity and generates a detection count sorted from greatest to least. As you can see, we have 151 different detections that have been triggered in the past seven days.
Setting up basic filters for these values is pretty straightforward, we select the field that we want to filter and from there we name the filter, specify the chart the filter is associated with and assign any default values that the filter should use on dashboard load and save it.
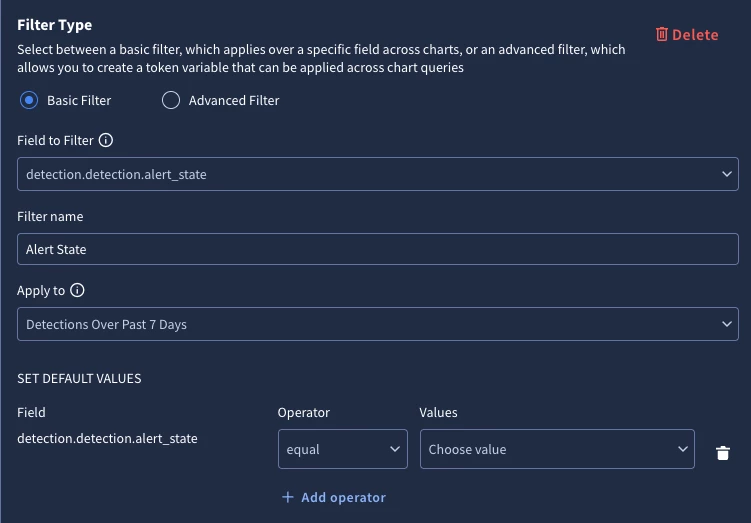
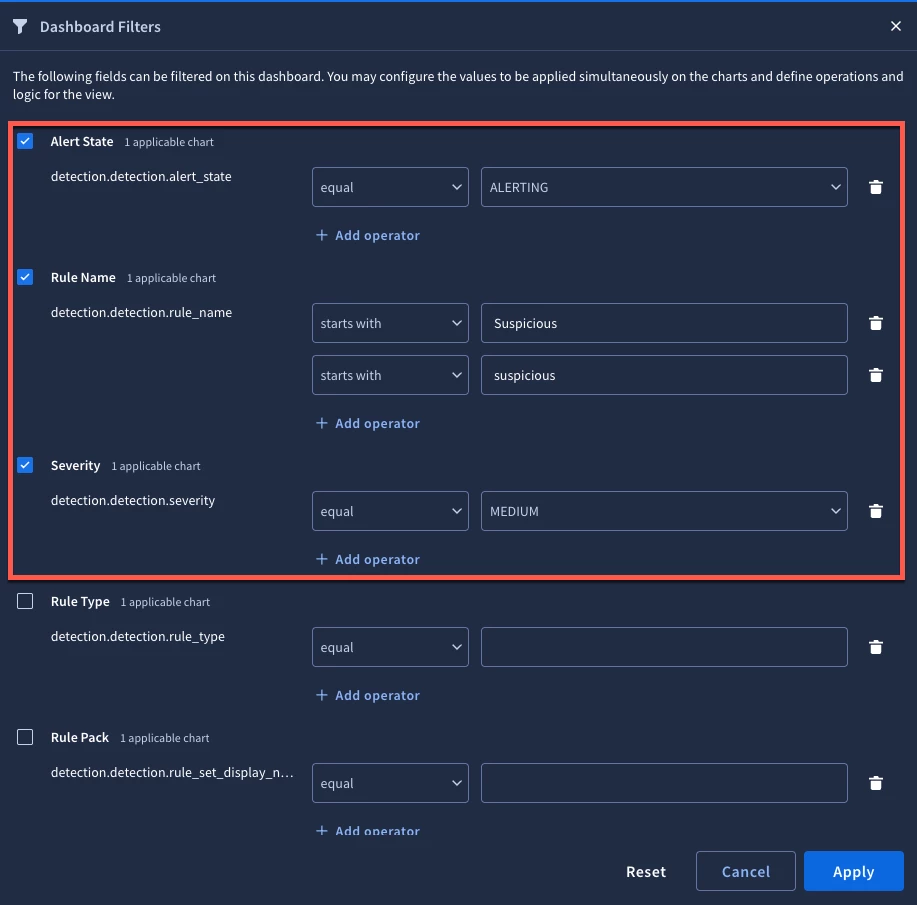
Once we have done this for all the applicable fields, we can open the filter list and see a view like this. In this example, we are applying the alert state equals alerting, and rule name starts with suspicious or Suspicious and the severity is medium.
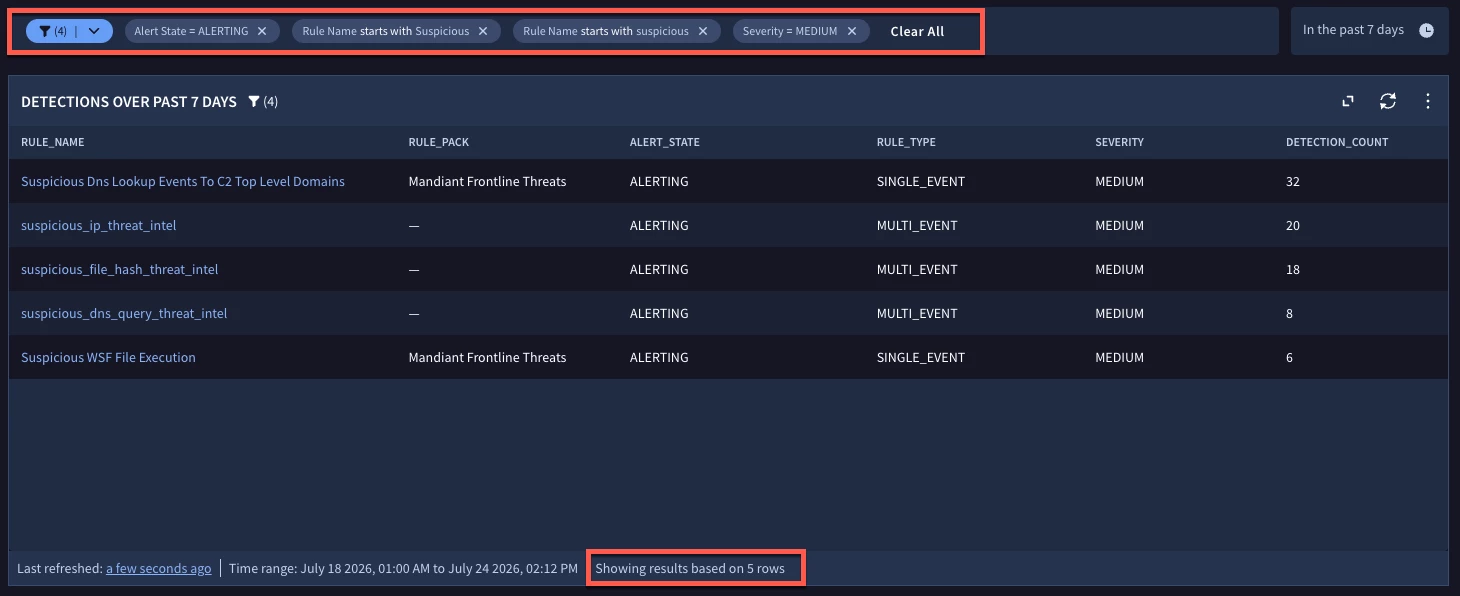
The chart reflects these filters at the top of the dashboard, the chart is filtered to these rules and the count at the bottom is reduced to the five rules that meet this criteria.
Manual List
For enumerated fields like alert state and severity, this is probably all you need to do for filtering. Because enumerated fields have a fixed set of values, the basic filtering provides that dropdown list of options, so if I just want to select alerting detections, I’m set.
However, for fields that contain strings, for instance, the basic filter does not provide a pick list, it just provides a space to specify a string. Now, while we can use operators like equals, not equals, starts with and ends with, sometimes we want to provide a specific set of values to the consumer of the dashboard.
One method we can use is a manual list. To create a filter using a manual list, there are two steps in the process required. The first is the creation of the filter and the second is applying the token from the filter into the query in the chart.
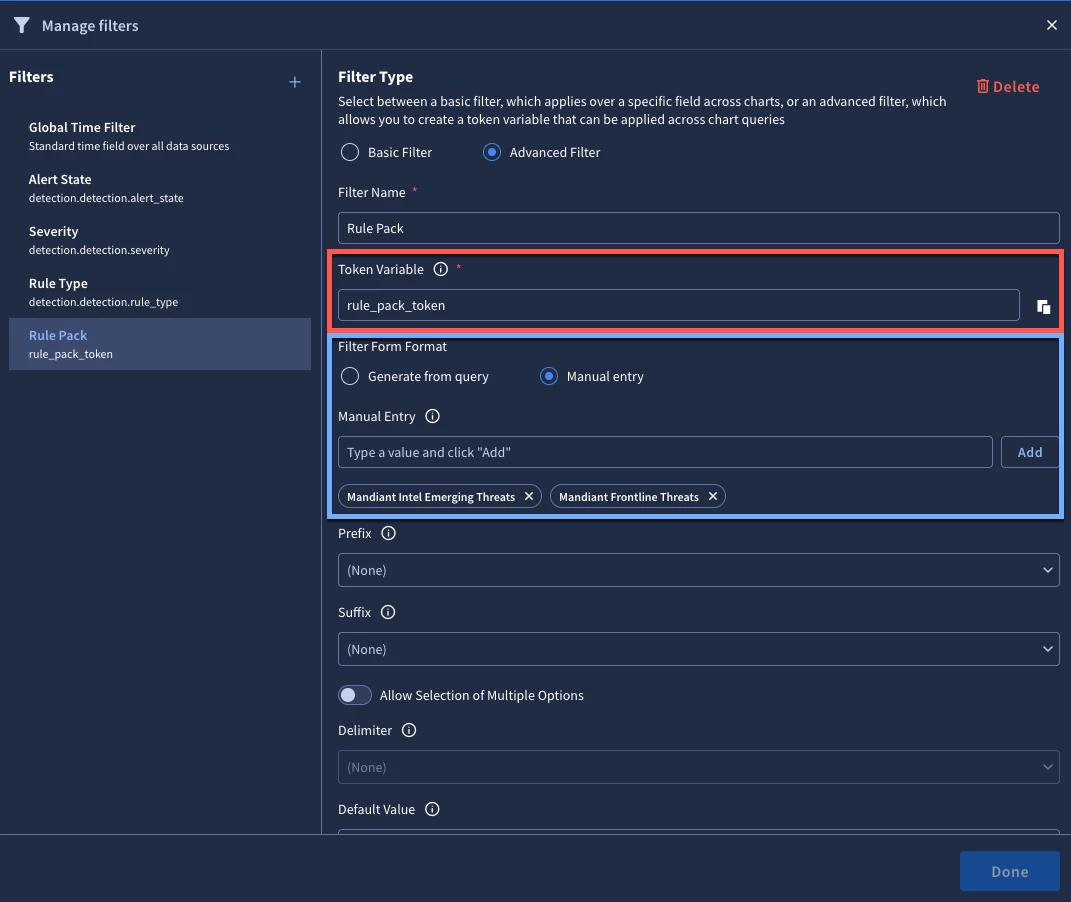
To illustrate this, let’s constrain the rule pack filter and limit it to two possible entries, the Mandiant Emerging Threats and Mandiant Frontline Threats rule packages that are part of the curated detections available in Google SecOps.
Accessing the manual list is available by clicking the Advanced Filter toggle. The first big change from the basic filter is that a token variable needs to be defined. Depending on the number of tokens you are using in the dashboard, choosing a vague name like token may not be ideal. I chose rule_pack_token so that I know what this token is being used for and if I have multiple charts, I can use it everywhere the rule pack is referenced if desired.
Under Filter Form Format, I’ve chosen Manual entry. This provides the method to create a manual list. In the next section, we will discuss the other option, Generate from query. I’ve added the two rule packs here. For this example, we can leave everything else alone and save the filter.
With the filter in place, we need to modify the query to handle the token. For this example, because we are taking the exact string and laying it into the query, we can do this by adding the following to the filtering statement:
detection.detection.rule_set_display_name = "$rule_pack_token$"
Now the query for the chart looks like this:
$alert_state = detection.detection.alert_state
$rule_type = detection.detection.rule_type
$severity = detection.detection.severity
$rule_name = detection.detection.rule_name
$rule_pack = detection.detection.rule_set_display_name
detection.detection.rule_set_display_name = "$rule_pack_token$"
match:
  $rule_name, $rule_pack, $alert_state, $rule_type, $severity
outcome:
  $detection_count = count($rule_name)
order:
  $detection_count desc
When we save the chart and navigate the dashboard, the filter pop-up displays the rule pack filter.
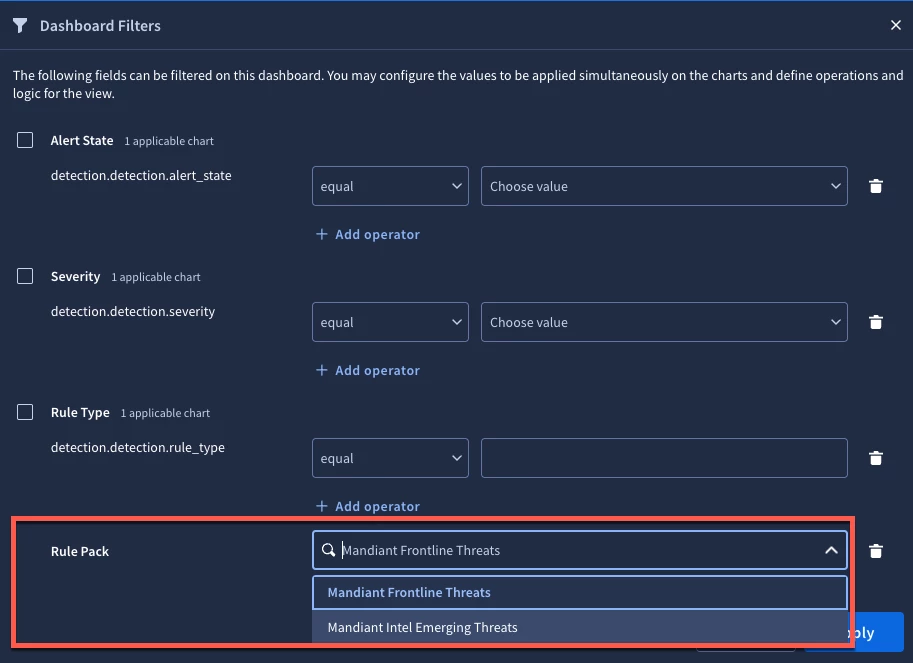
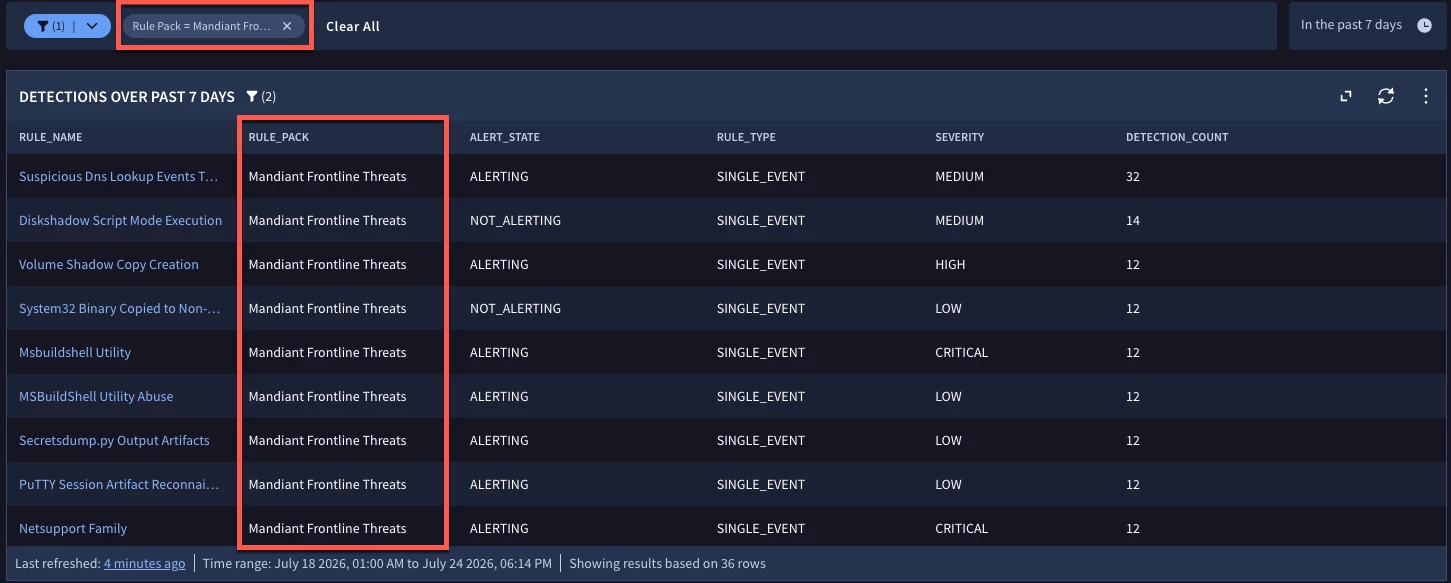
Notice the new filter is a pick list with the values we specified. If we select Mandiant Frontline Threats and click apply, we can see the values in the chart change to align with this filter.
Dynamic List
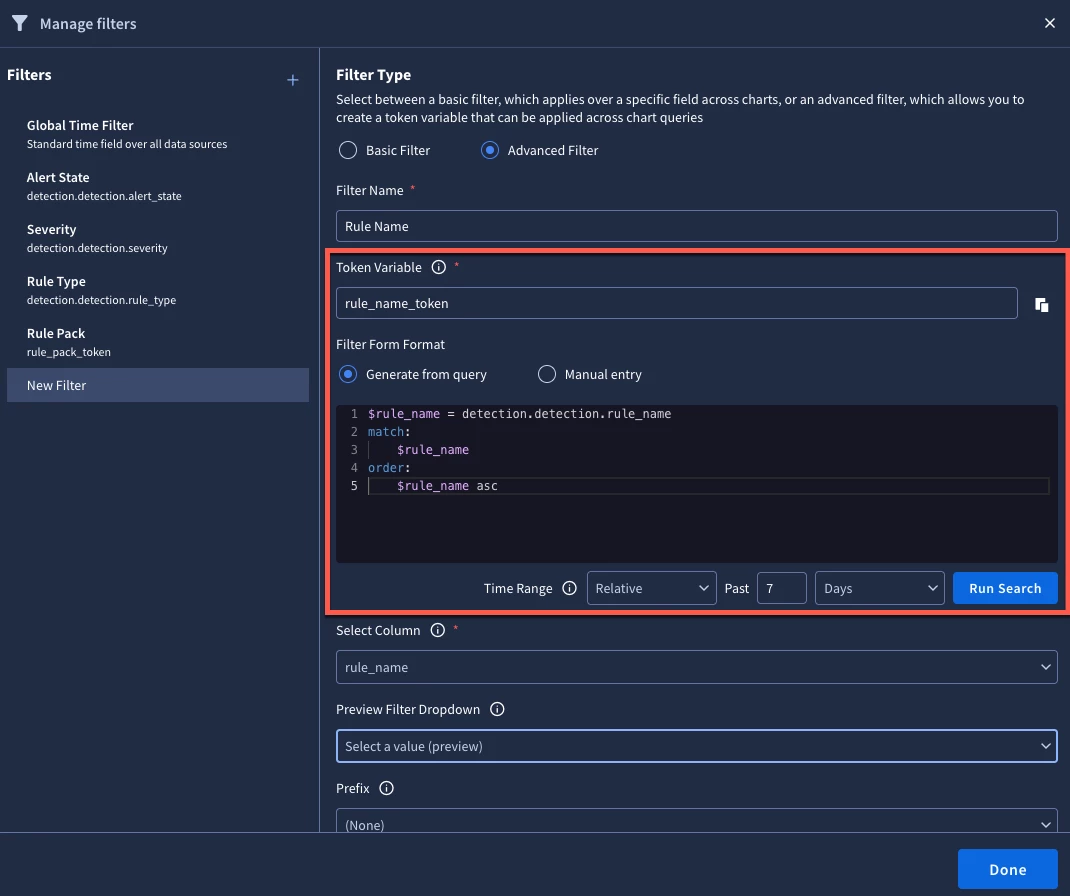
Let’s continue to evolve the dashboard and tweak how we handle the list of rules. Because we likely have a large number of rules that have triggered at some point in the tenant, we don’t want to manually manage a listing of rule names. Perhaps we want to dynamically generate a listing based on the past seven days. I could use the Generate from query in the Filter Form Format section of the filter to do this.
We name the filter and define the token like we previously did. This time, we will build a query and specify a time range for the query to run within. For this example, we want a listing of the rule names that have triggered in the past seven days to appear in alphabetical order in the list.
Once the query has been written, it’s important to note that the Run Search button needs to be selected to run the query to ensure the Select Column is populated. You can preview the dropdown as well and then click Done when you are satisfied.
With the new filter and token, the query needs to be modified to take this into account. To ensure we are getting values back in this chart, we are going to use the following logic to return the detections.
(
  detection.detection.rule_set_display_name = "$rule_pack_token$" or
  detection.detection.rule_name = "$rule_name_token$"
)
The query expects that a token is provided for either the rule name or the rule pack. Depending on how you want the dashboard to function, this could be perfectly fine as written or you may need to modify the logic to get the output you desire.
$alert_state = detection.detection.alert_state
$rule_type = detection.detection.rule_type
$severity = detection.detection.severity
$rule_name = detection.detection.rule_name
$rule_pack = detection.detection.rule_set_display_name
(
  detection.detection.rule_set_display_name = "$rule_pack_token$" or
  detection.detection.rule_name = "$rule_name_token$"
)
match:
  $rule_name, $rule_pack, $alert_state, $rule_type, $severity
outcome:
  $detection_count = count($rule_name)
order:
  $detection_count desc
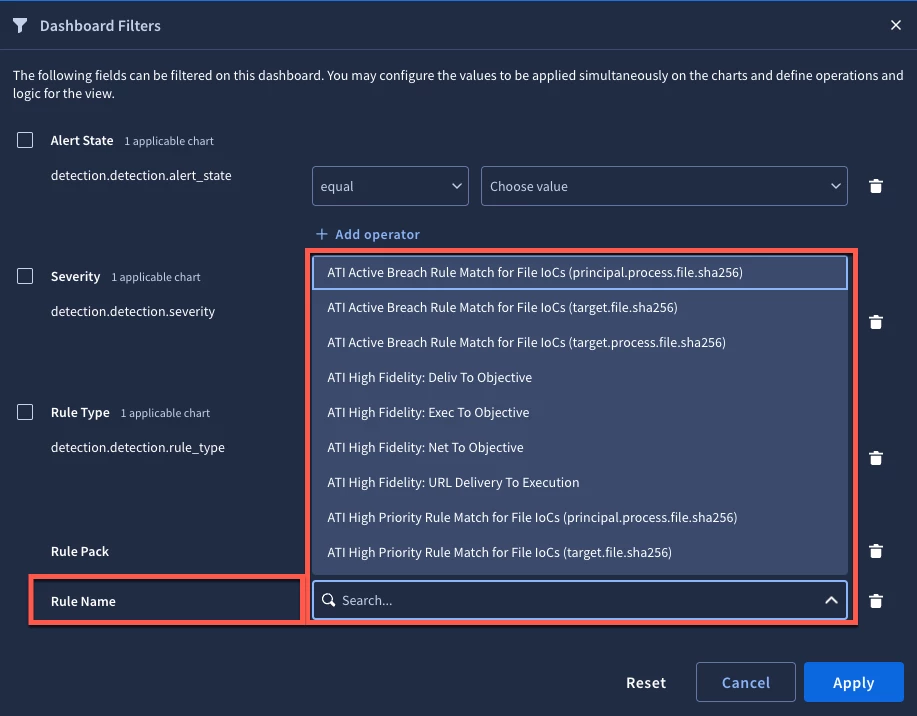
Once we save the query and open the filter pop-up, we now see another filter in the list and clicking on the drop-down results in a listing of the rule names.
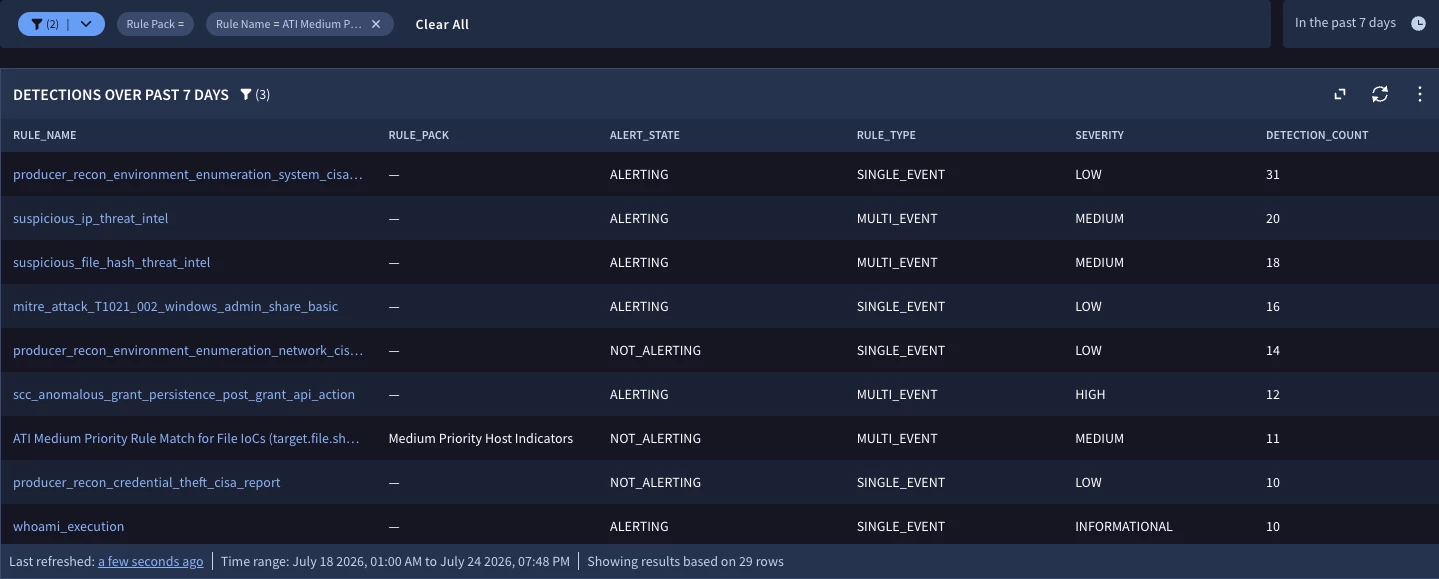
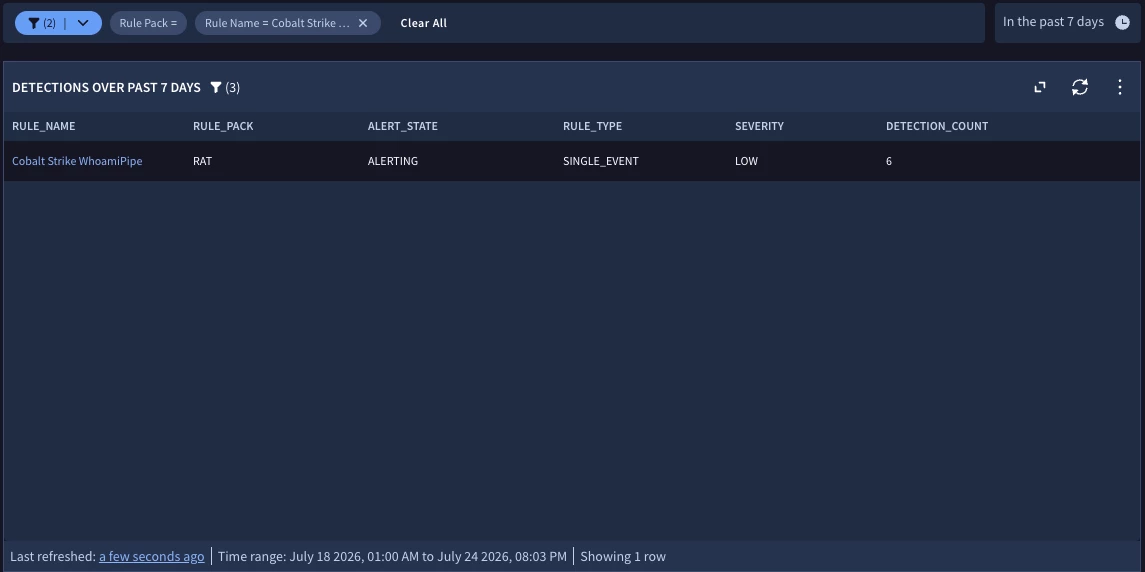
Now when we select a rule from the listing we can get a filtered output like this.
Hang on a second.
While this might be great because we can provide a filter of the rule packs and the rule names, the custom rules that are listed don’t have a rule pack so in this current example, I get all the custom rules and the rule name I specified. That may not be ideal, so we may need to assess how we are using the filters and tokens. There are a few different ways to solve issues that arise like this. One method might be to use a field and the associated values for detection.type.
Another method might be to modify the underlying query. We can expand the logic around the tokens to factor in that a rule pack must have a string length greater than zero to be displayed.
$alert_state = detection.detection.alert_state
$rule_type = detection.detection.rule_type
$severity = detection.detection.severity
$rule_name = detection.detection.rule_name
$rule_pack = detection.detection.rule_set_display_name
(
   (
     detection.detection.rule_set_display_name = "$rule_pack_token$" and
     strings.length(detection.detection.rule_set_display_name) > 0
   ) or
   detection.detection.rule_name = "$rule_name_token$"
)
match:
  $rule_name, $rule_pack, $alert_state, $rule_type, $severity
outcome:
  $detection_count = count($rule_name)
order:
  $detection_count desc
The addition of this logic now allows the user working with the dashboard to specify a rule name and just see the results for this rule while still providing the flexibility to select a rule pack and see the results from it as well without having to worry about custom rules that have a null value in the rule pack getting in the way.
We covered a good deal of ground today as it pertains to using filters in dashboards, particularly as it applies to constraining the values a user can interact with. As you start using additional options that filters provide, here are a few things to keep in mind:
- Enumerated values have their own pick list so advanced filters may not be needed for these filters
- Filters can leverage a manual or dynamic (query-based) listing
- The filter needs to be set up before the chart is modified with the defined token
- A token defined as rule_pack_token in a filter is represented in a query enclosed in dollar signs, like this, $rule_pack_token$
- To perform a direct match of a token in a query, make sure to include the token in quotes rule_set_display_name = "$rule_pack_token$"
I hope this provides you with additional ideas that can be leveraged as you construct dashboards in Google SecOps!