


Last time, we built a multi-stage search that generated a statistical output and then we used that output to arrive at a final search result. In a statistical search, we make a single pass over the data and aggregate by one or more values. Multi-stage searches provide the ability to perform a “stat of a stat.”
This time, we are going to use Google Security Operations (SecOps) to incorporate time windowing into the search. While stages without time windows are called tabled stages, stages that contain time windows are called windowed stages. Last time, the search had a table stage and a root stage. This time, we will build a search that has a windowed stage and a root stage.
When we start using time windows within a search, the next question is what kind of time window do we want? In search, Google SecOps supports the use of hop, sliding and tumbling windows. The different time window options probably deserves its own blog post, so to keep it simple, we will focus on the tumbling window today as it is the most likely one users will use when getting started.
A tumbling window is characterized by its fixed size (every 5 minutes, every hour, every day) and non-overlapping windows. This means that an event can only belong in a single window. To use a tumbling window in a search, a match section is required to aggregate by one or more match variables, like hostname or userid, followed by the keyword BY and a time unit.
Let’s use a frequency analysis example with network events to illustrate how we can use a windowed stage. I’ll state up front that the volumes of data and time ranges may not suit your specific use case, but the concepts can easily be adapted to your needs.
Find all of the network connection events that originate within our network and terminate outside of it over the past week.
Generate a count for each combination of the date and IP address pair. If the count is less than 50 events, denote these IP combinations as “Green”, if it is more than 100, mark these IP combinations as “Red.” Everything in between is “Yellow.”
Aggregate the statistical data by date and traffic light color, and concatenate the IP address pairs. Generate a listing of the “Yellow” and “Red” dates with a count of the number of IP pairs of interest as well as the relevant IP pairs. Output it from oldest to newest.
Let’s tackle the first two sections by building a statistical search. The filtering statement focuses the search on network connection events that have IP addresses from our internal netblock going to IPs that are outside of that netblock and we are getting rid of any pesky IPv6 ::1 addresses that might appear.
metadata.event_type = "NETWORK_CONNECTION"
net.ip_in_range_cidr(principal.ip, "10.128.0.0/16")
not net.ip_in_range_cidr(target.ip, "10.128.0.0/16")
not target.ip = "::1"
$principal_ip = principal.ip
$target_ip = target.ip
match:
  $principal_ip, $target_ip by day
outcome:
  $traffic_light = if(count(metadata.id) < 50, "Green", if(count(metadata.id) > 100, "Red", "Yellow"))
  $count = count(metadata.id)
The match section aggregates events by the IPs and with the addition of the keyword BY followed by the time unit of day, we are creating a tumbling window so that in addition to columns representing the principal_ip and target_ip, a third column named time_bucket is also created and all three are being used to aggregate the events.
In the outcome section, we are counting the number of rows that have a common principal_ip, target_ip and time_bucket, which is broken out by day. Finally, we are generating a string in the column named traffic_light that has conditional logic applied to it. This will result in low logging pairs having a string of “Green,” the high logging pairs will have a string of “Red" and the remainder are “Yellow.” Yes, my data volumes are a bit low, but stick with me here.
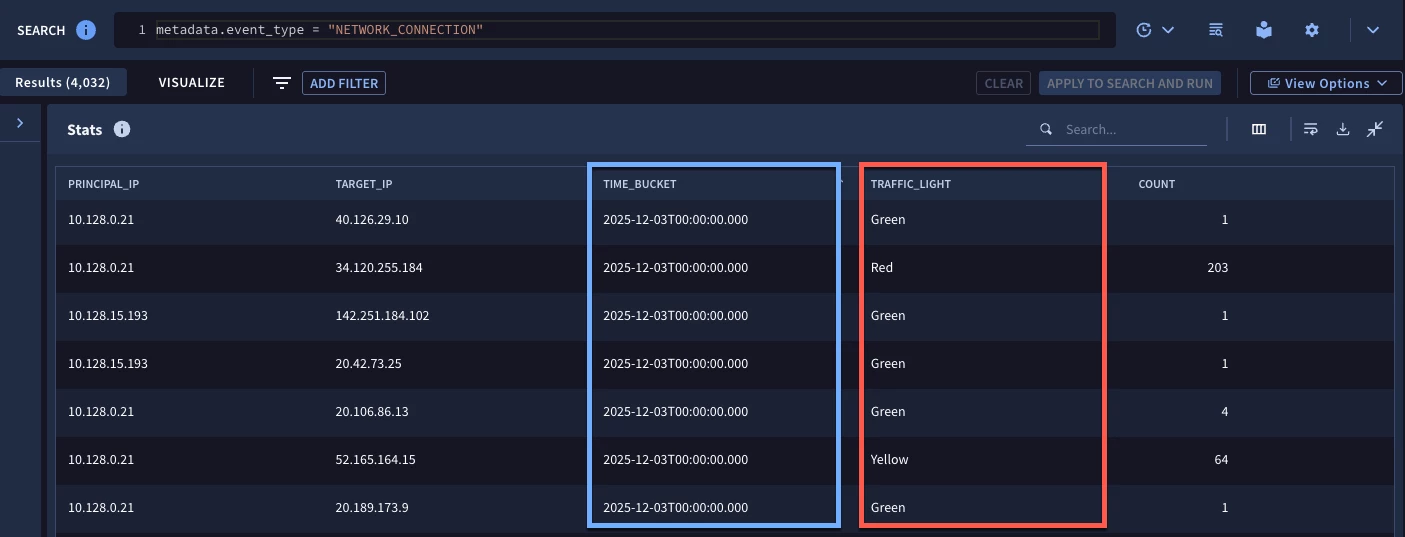
When we run the search for the week, we get a result set with the five columns from the match and outcome sections. Remember, in a multi-stage search, if we want a field to be used in the root stage, we need to make it available in the match or outcome section of the windowed or table stage, so these are the fields we have to work with.
Now that I just made that last statement, I will provide a slight caveat to it. In the case of windowed stages, two additional fields are created and made available by Google SecOps. The names of these fields are window_start and window_end and are referenced by the name of the stage followed by these reserved terms.
Building on the previous search, we can view these fields by wrapping the statistical search into a stage that we are calling traffic_light_ip_pairs. Remember to start the stage with the keyword stage and place brackets after the stage name and at the end of the statistical search.
stage traffic_light_ip_pairs {
metadata.event_type = "NETWORK_CONNECTION"
net.ip_in_range_cidr(principal.ip, "10.128.0.0/16")
not net.ip_in_range_cidr(target.ip, "10.128.0.0/16")
not target.ip = "::1"
$principal_ip = principal.ip
$target_ip = target.ip
match:
  $principal_ip, $target_ip by day
outcome:
  $traffic_light = if(count(metadata.id) < 50, "Green", if(count(metadata.id) > 100, "Red", "Yellow"))
  $count = count(metadata.id)
}
//root stage
outcome:
  $start = $traffic_light_ip_pairs.window_start
  $end = $traffic_light_ip_pairs.window_end
  $start_formatted =  timestamp.get_timestamp($traffic_light_ip_pairs.window_start)
  $end_formatted = timestamp.get_timestamp($traffic_light_ip_pairs.window_end)
The syntax after the bracket is the root stage and for the moment, it isn’t aggregated. In this search, we are just going to view the window start and end times. Notice in the outcome section, we use the stage name prepended with a dollar sign to define which stage the value is originating from.
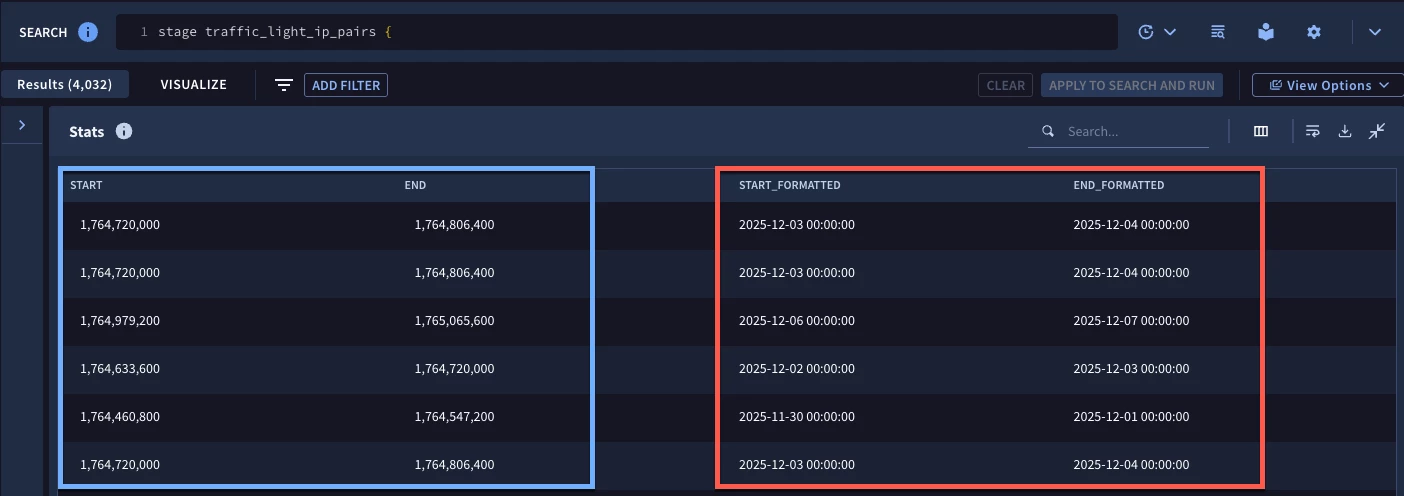
When we run the search, notice in the blue box that we get time values in epoch format. Because of this, we have two additional columns in this example that use the timestamp.get_timestamp function so that we can see the time window start and end time in an easily readable format. As you can see we have the same number of rows here as the previous search. We haven’t done anything to further refine the data, we just used the root stage to output these special time window fields.
Alright, we have our initial data set and we have the window start and end values that can be used in the root stage to generate our final result.
stage traffic_light_ip_pairs {
metadata.event_type = "NETWORK_CONNECTION"
net.ip_in_range_cidr(principal.ip, "10.128.0.0/16")
not net.ip_in_range_cidr(target.ip, "10.128.0.0/16")
not target.ip = "::1"
$principal_ip = principal.ip
$target_ip = target.ip
match:
  $principal_ip, $target_ip by day
outcome:
  $traffic_light = if(count(metadata.id) < 50, "Green", if(count(metadata.id) > 100, "Red", "Yellow"))
  $count = count(metadata.id)
}
// root stage
$date_formatted = timestamp.get_timestamp($traffic_light_ip_pairs.window_start, "%A, %B %d, %Y")
$date = $traffic_light_ip_pairs.window_start
$traffic_light = $traffic_light_ip_pairs.traffic_light
$traffic_light != "green"
$ip_pairs = strings.concat($traffic_light_ip_pairs.principal_ip, "/", $traffic_light_ip_pairs.target_ip)
match:
  $date, $date_formatted, $traffic_light
outcome:
  $count_traffic_light = count($traffic_light_ip_pairs.traffic_light)
  $pairs_of_interest = array_distinct($ip_pairs)
order:
  $date
unselect:
  $date
The traffic_light_ip_pairs stage is not changing at all, but we are going to do some work in the root stage to filter, format and aggregate the data and then calculate and present our output.
The first thing in the root stage to call out is that we have both $date_formatted and $date placeholder variables defined. In this example, I am formatting my date to output the day of the week followed by the month, day and year. However, if I want to sort from oldest to newest, the day of the week will prevent that from occurring. The solution to that is to have both the formatted date and the epoch value. More on that in a bit.
We need a placeholder variable for the traffic light value from the windowed stage so we can use it in the root stage as an aggregation. I also don’t want the rows where the traffic light value is “Green” because those are expected, so let’s filter them out. Finally, we are going to concatenate the principal and target IP addresses from the traffic_light_ip_pairs stage so that we can represent each pair in our output.
Within the match section, we are aggregating by both the date and the formatted date as well as the traffic light value. The outcome section then generates a count and outputs the IP pairs into an array.
Let’s circle back to the date. Because we want the output from oldest to newest, we can use the order section of the search to define the sort to be by $date. Not specifying ascending or descending will cause this to default to ascending order.
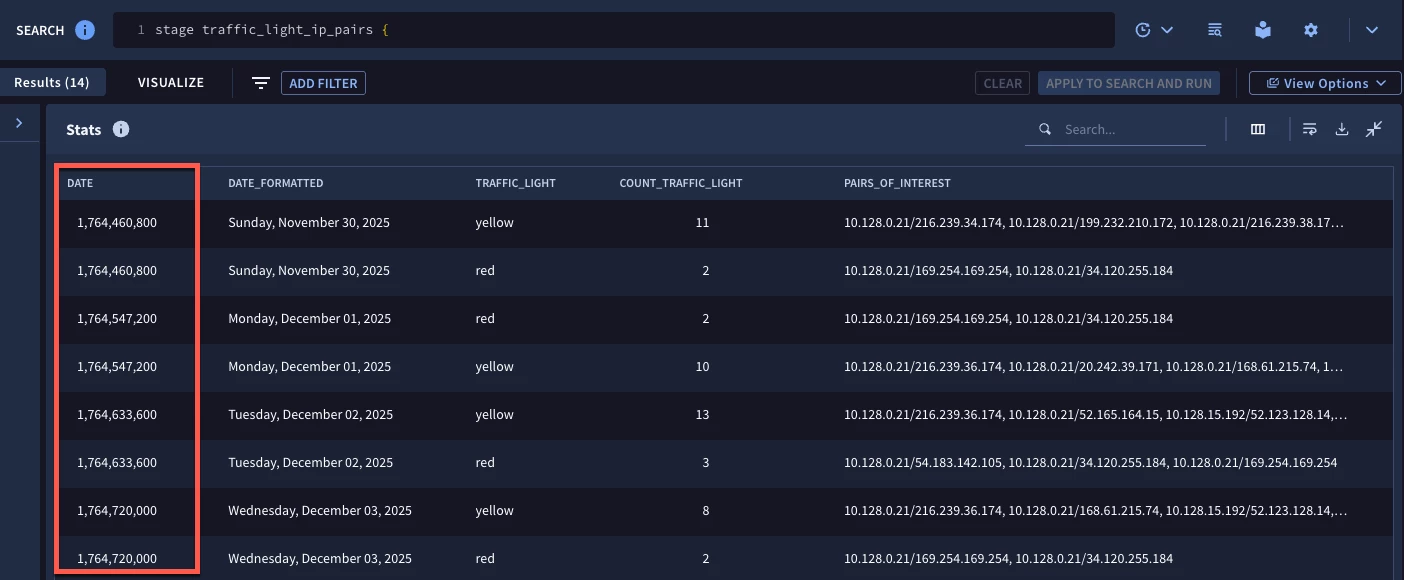
At this point, we are looking pretty good but, we probably don’t need a big epoch value in the results, so let’s use the unselect section to remove the $date value from the view so that we are left with the nicely formatted date along with the traffic light value, the count and the IP pairs.
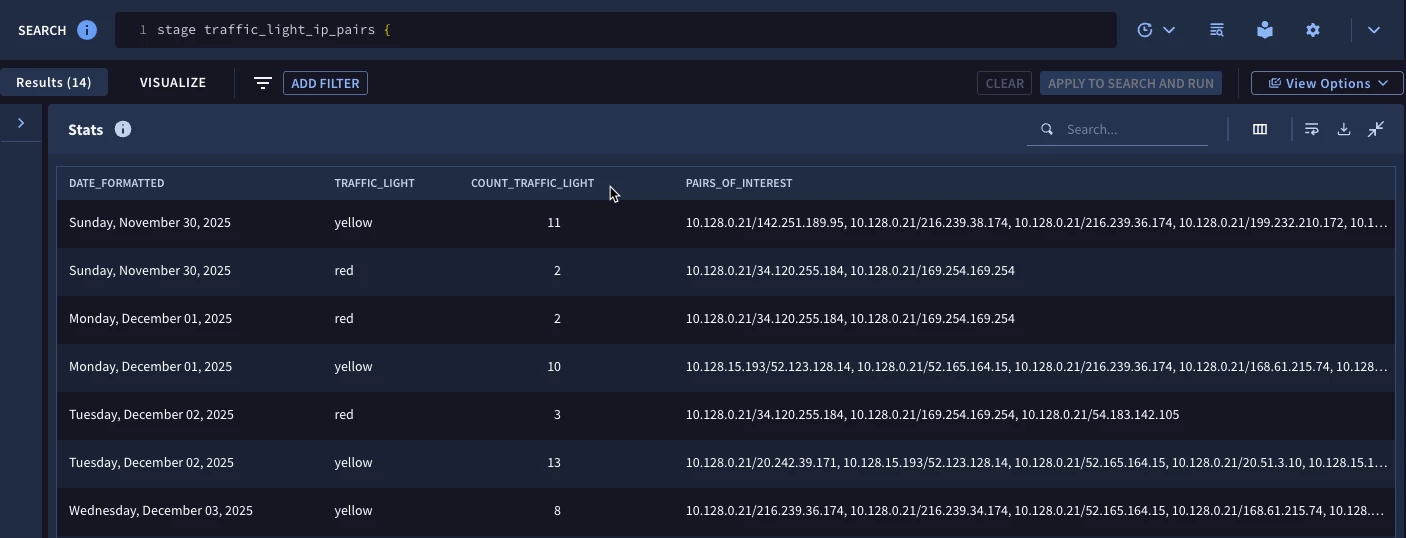
With these results, we can prioritize hunting or investigating further on the outlier IP pairs for a specific day and could chart these over time and potentially determine days when we have more IP pairs in the “Red” versus other days.
Here are a few things to keep in mind when building windowed multi-stage searches:
- The three window types supported are hop, sliding and tumbling but most of the time tumbling windows will be sufficient
- The BY keyword followed by a time unit is how a tumbling window is called
- Windowed stages have two special fields window_start and window_end available to be used in other stages
I hope this provides you with some ideas how windowed multi-stage searches can be used in your environment. The syntax we walked through is above, paste it into your tenant and use it with other fields, time units and filtering statements to learn how these kinds of use cases can work for you!
