Hi
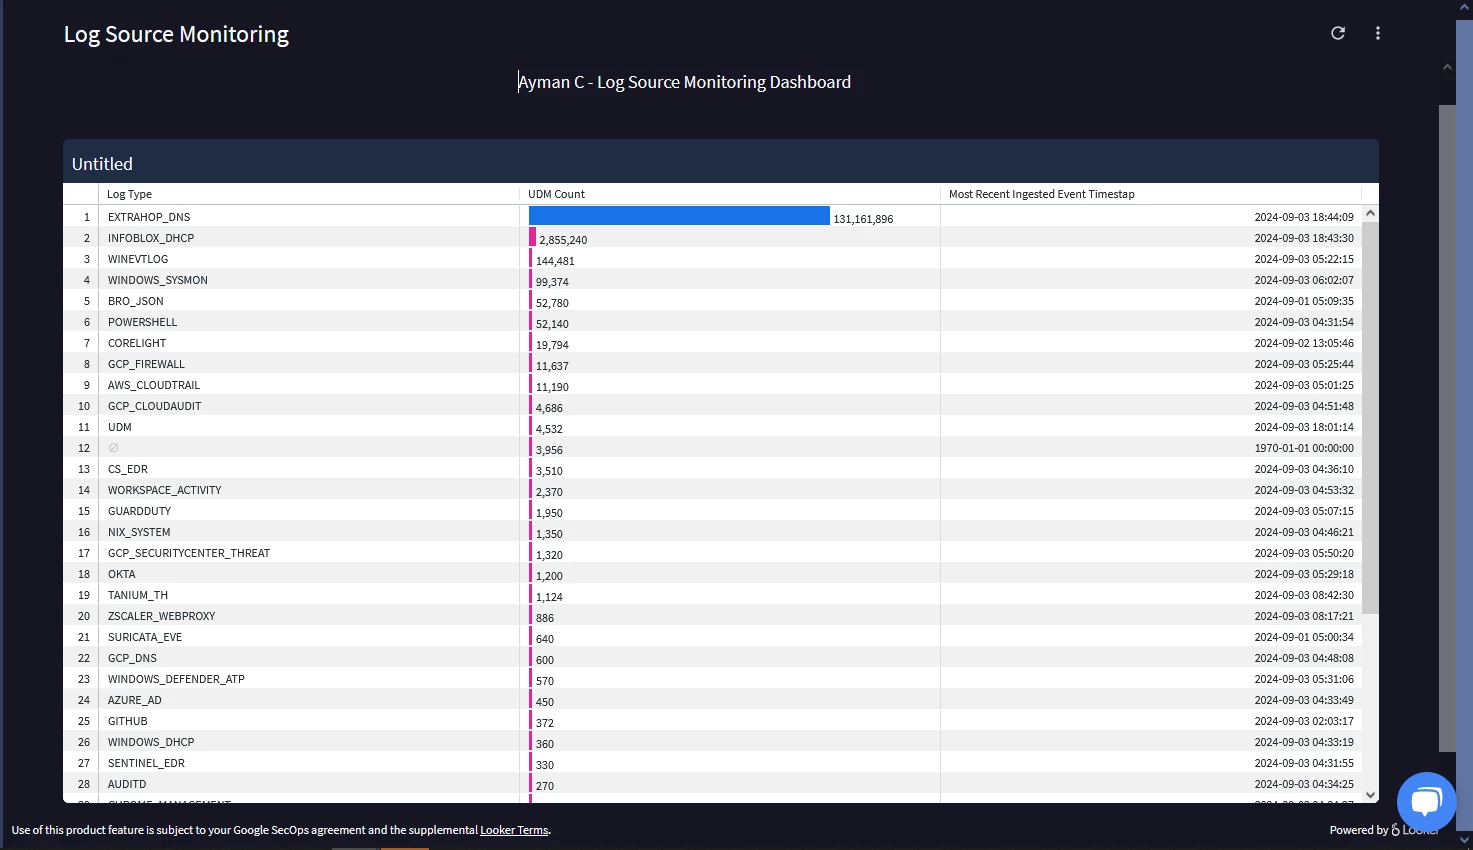
I like to have a panel that shows all my ingested log sources and its last ingested time . i do see a panel "Recently Ingested Events" under Data Ingestion and Health but it shows only some log sources and not all the ones .I want panel showing all the log sources and its time , can some one help me understand how i can build it . @jstoner any suggestion .

Page 1 / 1
Hi @rahul7514
This should be what you want.
lookml:

- dashboard: log_source_monitoring

  description: ""

  elements:

  - col: 0

    column_limit: 50

    conditional_formatting_include_nulls: false

    conditional_formatting_include_totals: false

    defaults_version: 1

    enable_conditional_formatting: false

    explore: events_connector

    fields:

    - events.count

    - events.metadata__log_type

    - events.metadata__event_timestamp_max_second

    filters:

      events.time_filter: ""

    header_font_size: "12"

    header_text_alignment: left

    height: 13

    hidden_pivots: {}

    hide_row_totals: false

    hide_totals: false

    limit: 500

    limit_displayed_rows: false

    minimum_column_width: 75

    model: scn

    name: Untitled

    row: 2

    rows_font_size: "12"

    series_cell_visualizations:

      events.count:

        is_active: true

    series_labels:

      events.count: UDM Count

      events.metadata__event_timestamp_max_second: Most Recent Ingested Event Timestap

      events.metadata__log_type: Log Type

    show_row_numbers: true

    show_row_totals: true

    show_sql_query_menu_options: false

    show_totals: true

    show_view_names: false

    size_to_fit: true

    sorts:

    - events.count desc 0

    table_theme: white

    title: Untitled

    transpose: false

    truncate_header: false

    truncate_text: true

    type: looker_grid

    width: 24

  - body_text: ""

    col: 8

    height: 2

    name: Ayman C - Log Source Monitoring Dashboard

    row: 0

    subtitle_text: ""

    title_text: Ayman C - Log Source Monitoring Dashboard

    type: text

    width: 7

  layout: newspaper

  title: Log Source Monitoring

metadata:

  exported_at: "2024-09-03T12:28:25-07:00"

  file_fingerprint: "127765673354839399756613081162743290298"

  looker_version: 24.0.66

  version: "1"
Thanks @AymanC .
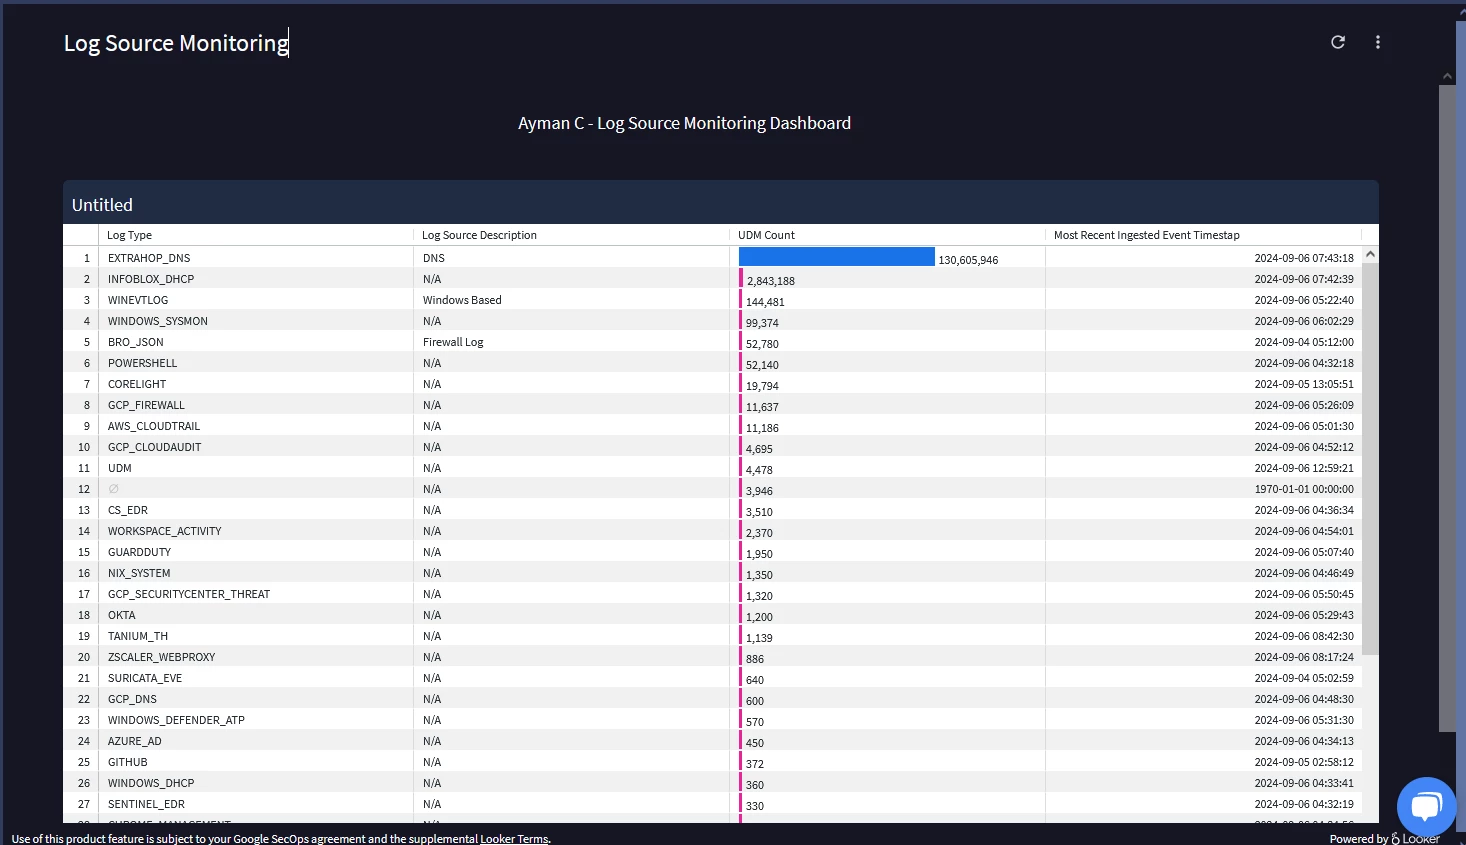
Just one add on question , if we like to add a column to describe the log source ,as in to say its a firewall ,or a load balancer , is it possible ? @AymanC
Just one add on question , if we like to add a column to describe the log source ,as in to say its a firewall ,or a load balancer , is it possible ? @AymanC
Synthetically describe it, or do you pull in a value into a udm field to describe the log source? @rahul7514
Synthetically describe it, or do you pull in a value into a udm field to describe the log source? @rahul7514
Manually add it, because there doesn't exist such a field by default @AymanC
Manually add it, because there doesn't exist such a field by default @AymanC
This is achievable via a table calculation, using 'IF Statements'
lookml:

- dashboard: log_source_monitoring

  description: ""

  elements:

  - col: 0

    column_limit: 50

    conditional_formatting_include_nulls: false

    conditional_formatting_include_totals: false

    defaults_version: 1

    dynamic_fields:

    - _kind_hint: dimension

      _type_hint: string

      category: table_calculation

      expression: |-

        if(${events.metadata__log_type} = "EXTRAHOP_DNS", "DNS",

        if(${events.metadata__log_type} = "WINEVTLOG", "Windows Based",

        if(${events.metadata__log_type} = "BRO_JSON", "Firewall Log", "N/A")))

      label: Log Source Description

      table_calculation: log_source_description

      value_format: null

      value_format_name: null

    enable_conditional_formatting: false

    explore: events_connector

    fields:

    - events.count

    - events.metadata__log_type

    - events.metadata__event_timestamp_max_second

    filters:

      events.time_filter: ""

    header_font_size: "12"

    header_text_alignment: left

    height: 13

    hidden_pivots: {}

    hide_row_totals: false

    hide_totals: false

    limit: 500

    limit_displayed_rows: false

    listen: {}

    minimum_column_width: 75

    model: scn

    name: Untitled

    row: 2

    rows_font_size: "12"

    series_cell_visualizations:

      events.count:

        is_active: true

    series_labels:

      events.count: UDM Count

      events.metadata__event_timestamp_max_second: Most Recent Ingested Event Timestap

      events.metadata__log_type: Log Type

    show_row_numbers: true

    show_row_totals: true

    show_sql_query_menu_options: false

    show_totals: true

    show_view_names: false

    size_to_fit: true

    sorts:

    - events.count desc 0

    table_theme: white

    title: Untitled

    transpose: false

    truncate_header: false

    truncate_text: true

    type: looker_grid

    width: 24

  - body_text: ""

    col: 8

    height: 2

    name: Ayman C - Log Source Monitoring Dashboard

    row: 0

    title_text: Ayman C - Log Source Monitoring Dashboard

    type: text

    width: 7

  layout: newspaper

  title: Log Source Monitoring

metadata:

  exported_at: "2024-09-06T06:05:17-07:00"

  file_fingerprint: "394529975020477682314068254218476102263"

  looker_version: 24.12.51

  version: "1"
Wow thanks @AymanC , didn't think there was such a capability.
Hello @AymanC ,
How do you write this code ? will you be able to suggest some tutorials to learn this ? and i dont find any space to write this code in siem dashboard tab. where exactly i can write scripts to build dashboards in chronicle ?
Hello @AymanC ,
How do you write this code ? will you be able to suggest some tutorials to learn this ? and i dont find any space to write this code in siem dashboard tab. where exactly i can write scripts to build dashboards in chronicle ?
Hi @leodas
Official Documentation can be found here -https://cloud.google.com/chronicle/docs/reports/dashboards-overview#default
Essentially, the majority of the functionality is clicking, which in the back end forms a SQL query in the instance's back-end Bigquery Project. If you click on the 'SQL' tab at the bottom, you can see (if you were to manually write the query) what it would be.
Since the functionality is based on Looker, I would recommend looking at Looker's documentation, which has more documentation - however, note that since Chronicle's dashboard uses 'Looker Embedded' not all functionality is available.
How I like to think of it is,
Explore = Data source within your instance
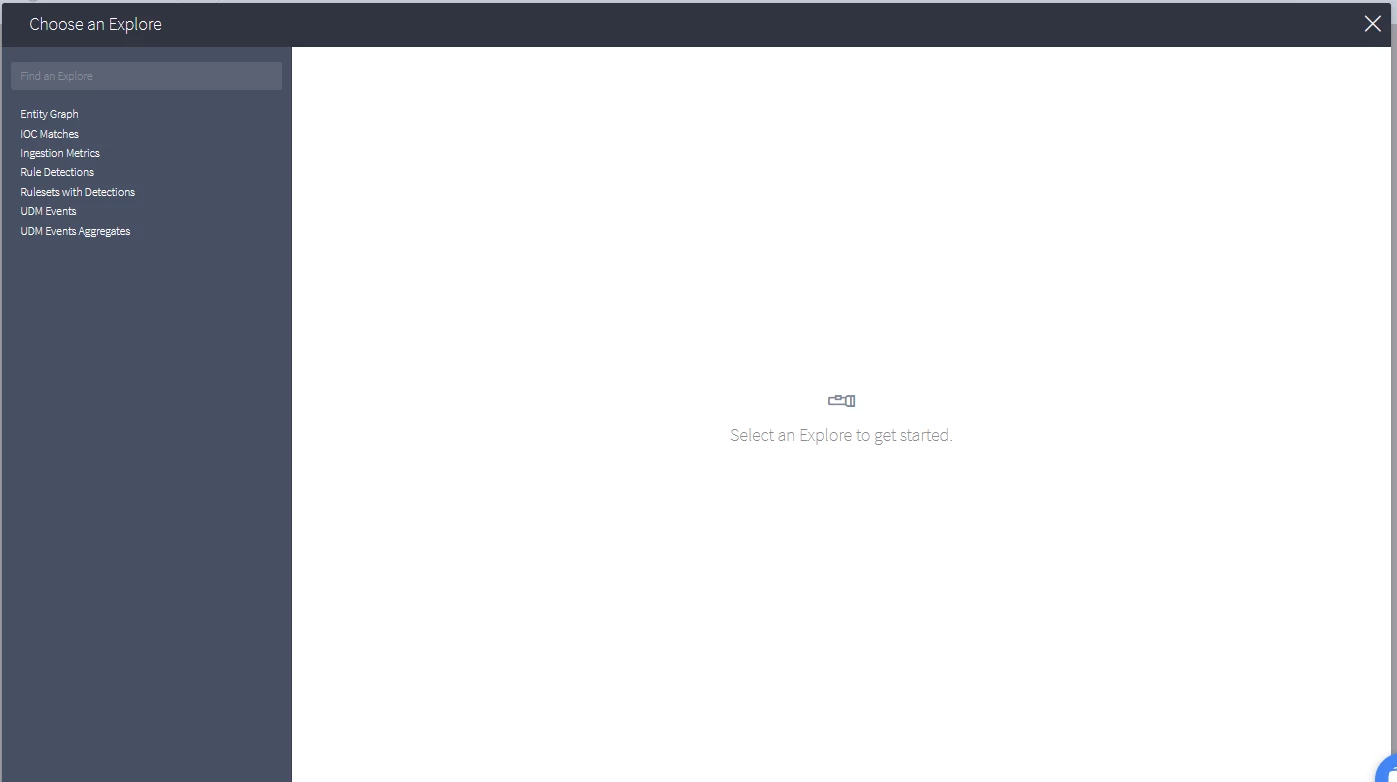
Once we click an 'Explore' (I like to think of this as a data source) we see the following (main areas):
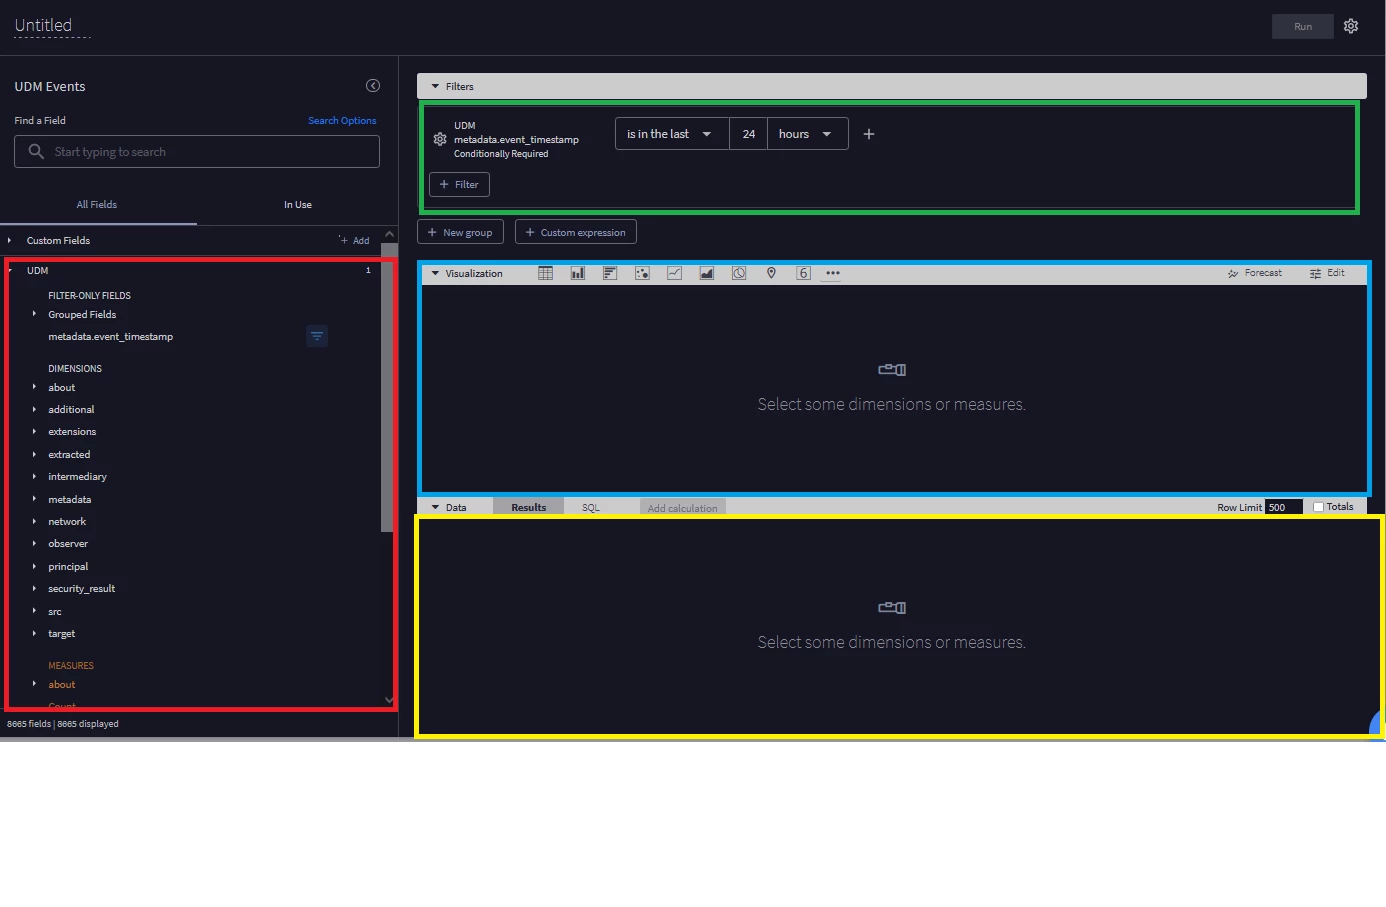
How I like to think of it is as follows:
Red Box = The data we want to select to see
Green Box = Filter (what we want to see from the selected data source, or not see etc) from the selected data that we wanted to see (chosen from the red box)
Blue Box = What the end-user sees (a table, a graph etc)
Yellow Box = What the back-end sees.
The above are the main areas, there are additional areas such as:
Table Calculations - https://cloud.google.com/looker/docs/table-calculations, https://cloud.google.com/looker/docs/functions-and-operators
Custom (filter) expressions - https://cloud.google.com/looker/docs/filter-expressions
On top of this, grouping, Custom Measures, custom Dimensions, Visualisation editing, measures for field selections, hiding certain selected visualisations from the visualisation element etc.
Hope this helps a bit better!
Kind Regards,
Ayman
Hi @leodas
Official Documentation can be found here -https://cloud.google.com/chronicle/docs/reports/dashboards-overview#default
Essentially, the majority of the functionality is clicking, which in the back end forms a SQL query in the instance's back-end Bigquery Project. If you click on the 'SQL' tab at the bottom, you can see (if you were to manually write the query) what it would be.
Since the functionality is based on Looker, I would recommend looking at Looker's documentation, which has more documentation - however, note that since Chronicle's dashboard uses 'Looker Embedded' not all functionality is available.
How I like to think of it is,
Explore = Data source within your instance
Once we click an 'Explore' (I like to think of this as a data source) we see the following (main areas):
How I like to think of it is as follows:
Red Box = The data we want to select to see
Green Box = Filter (what we want to see from the selected data source, or not see etc) from the selected data that we wanted to see (chosen from the red box)
Blue Box = What the end-user sees (a table, a graph etc)
Yellow Box = What the back-end sees.
The above are the main areas, there are additional areas such as:
Table Calculations - https://cloud.google.com/looker/docs/table-calculations, https://cloud.google.com/looker/docs/functions-and-operators
Custom (filter) expressions - https://cloud.google.com/looker/docs/filter-expressions
On top of this, grouping, Custom Measures, custom Dimensions, Visualisation editing, measures for field selections, hiding certain selected visualisations from the visualisation element etc.
Hope this helps a bit better!
Kind Regards,
Ayman
thank you, so i will explore more on looker to build some advanced dashboards ..
This is achievable via a table calculation, using 'IF Statements'
lookml:

- dashboard: log_source_monitoring

  description: ""

  elements:

  - col: 0

    column_limit: 50

    conditional_formatting_include_nulls: false

    conditional_formatting_include_totals: false

    defaults_version: 1

    dynamic_fields:

    - _kind_hint: dimension

      _type_hint: string

      category: table_calculation

      expression: |-

        if(${events.metadata__log_type} = "EXTRAHOP_DNS", "DNS",

        if(${events.metadata__log_type} = "WINEVTLOG", "Windows Based",

        if(${events.metadata__log_type} = "BRO_JSON", "Firewall Log", "N/A")))

      label: Log Source Description

      table_calculation: log_source_description

      value_format: null

      value_format_name: null

    enable_conditional_formatting: false

    explore: events_connector

    fields:

    - events.count

    - events.metadata__log_type

    - events.metadata__event_timestamp_max_second

    filters:

      events.time_filter: ""

    header_font_size: "12"

    header_text_alignment: left

    height: 13

    hidden_pivots: {}

    hide_row_totals: false

    hide_totals: false

    limit: 500

    limit_displayed_rows: false

    listen: {}

    minimum_column_width: 75

    model: scn

    name: Untitled

    row: 2

    rows_font_size: "12"

    series_cell_visualizations:

      events.count:

        is_active: true

    series_labels:

      events.count: UDM Count

      events.metadata__event_timestamp_max_second: Most Recent Ingested Event Timestap

      events.metadata__log_type: Log Type

    show_row_numbers: true

    show_row_totals: true

    show_sql_query_menu_options: false

    show_totals: true

    show_view_names: false

    size_to_fit: true

    sorts:

    - events.count desc 0

    table_theme: white

    title: Untitled

    transpose: false

    truncate_header: false

    truncate_text: true

    type: looker_grid

    width: 24

  - body_text: ""

    col: 8

    height: 2

    name: Ayman C - Log Source Monitoring Dashboard

    row: 0

    title_text: Ayman C - Log Source Monitoring Dashboard

    type: text

    width: 7

  layout: newspaper

  title: Log Source Monitoring

metadata:

  exported_at: "2024-09-06T06:05:17-07:00"

  file_fingerprint: "394529975020477682314068254218476102263"

  looker_version: 24.12.51

  version: "1"
@AymanC : is it possible to use a different field above as in i have 4 log sources for which i dont see log type getting captured in raw log
GCP Storage Context
GCP BigQuery
GCP IAM context
GCP Compute Context
, can i use metadata.product_name for those ,something like below .
expression: |-

        if(${events.metadata__log_type} = "GCP_CLOUDAUDIT", "Google Cloud Audit Logs",

        if(${events.metadata__log_type} = "GCP_DNS", "Google Cloud DNS logs",

        if(${events.metadata__log_type} = "OFFICE_365", "Microsoft office 365 logs",

        if(${events.metadata_product_name} = "GCP BigQuery", "Google Cloud BigQuery logs",

        if(${events.metadata__log_type} = "CHECKPOINT_FIREWALL", "Checkpoint Firewall logs",
i did give a try but it throws error for the error description field .
Reply
Enter your E-mail address. We'll send you an e-mail with instructions to reset your password.