I have logs ingested with a custom parser that sets the following fields in one log.
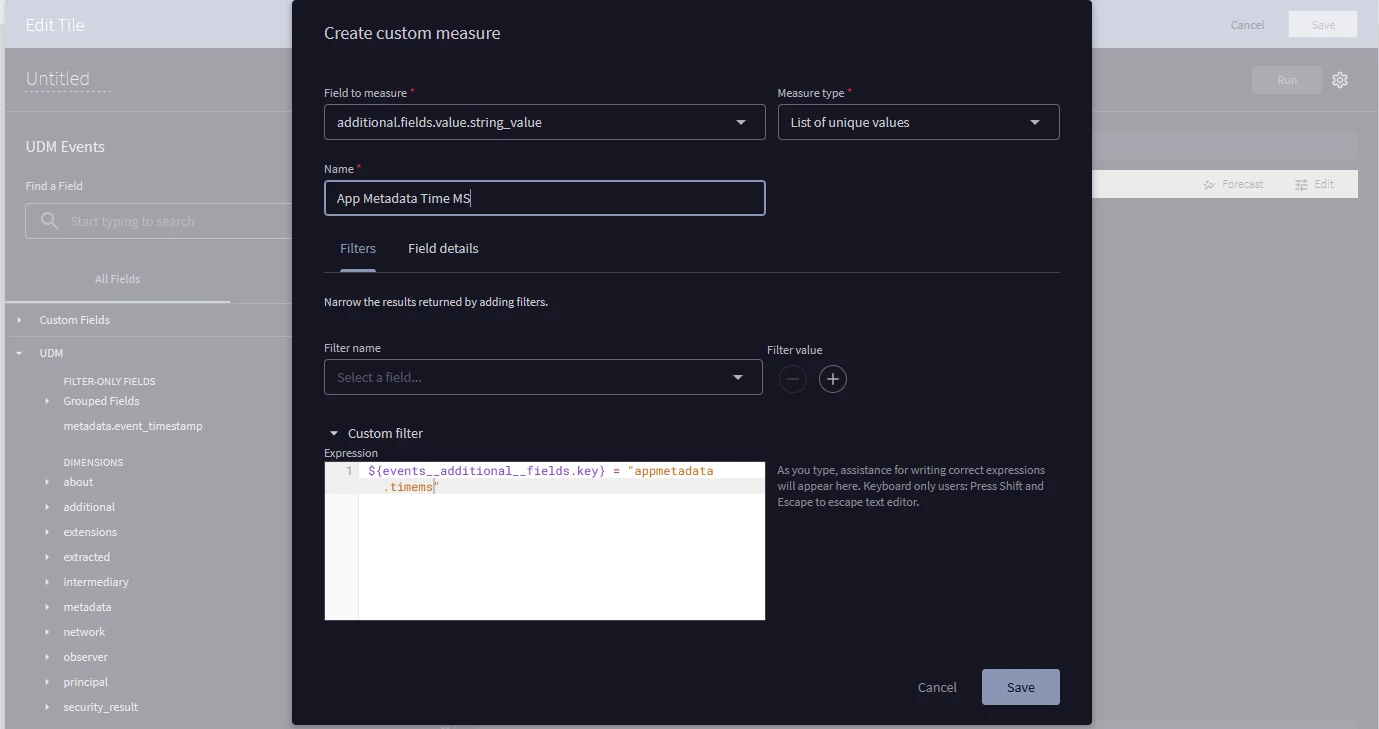
- additional.value["appmetadata.timems"] = "a string"
- additional.value["appmetadata.name"] = "a string"
Appmetadata.timems must be converted to a number. Appmetadata.name must contain "job-success".
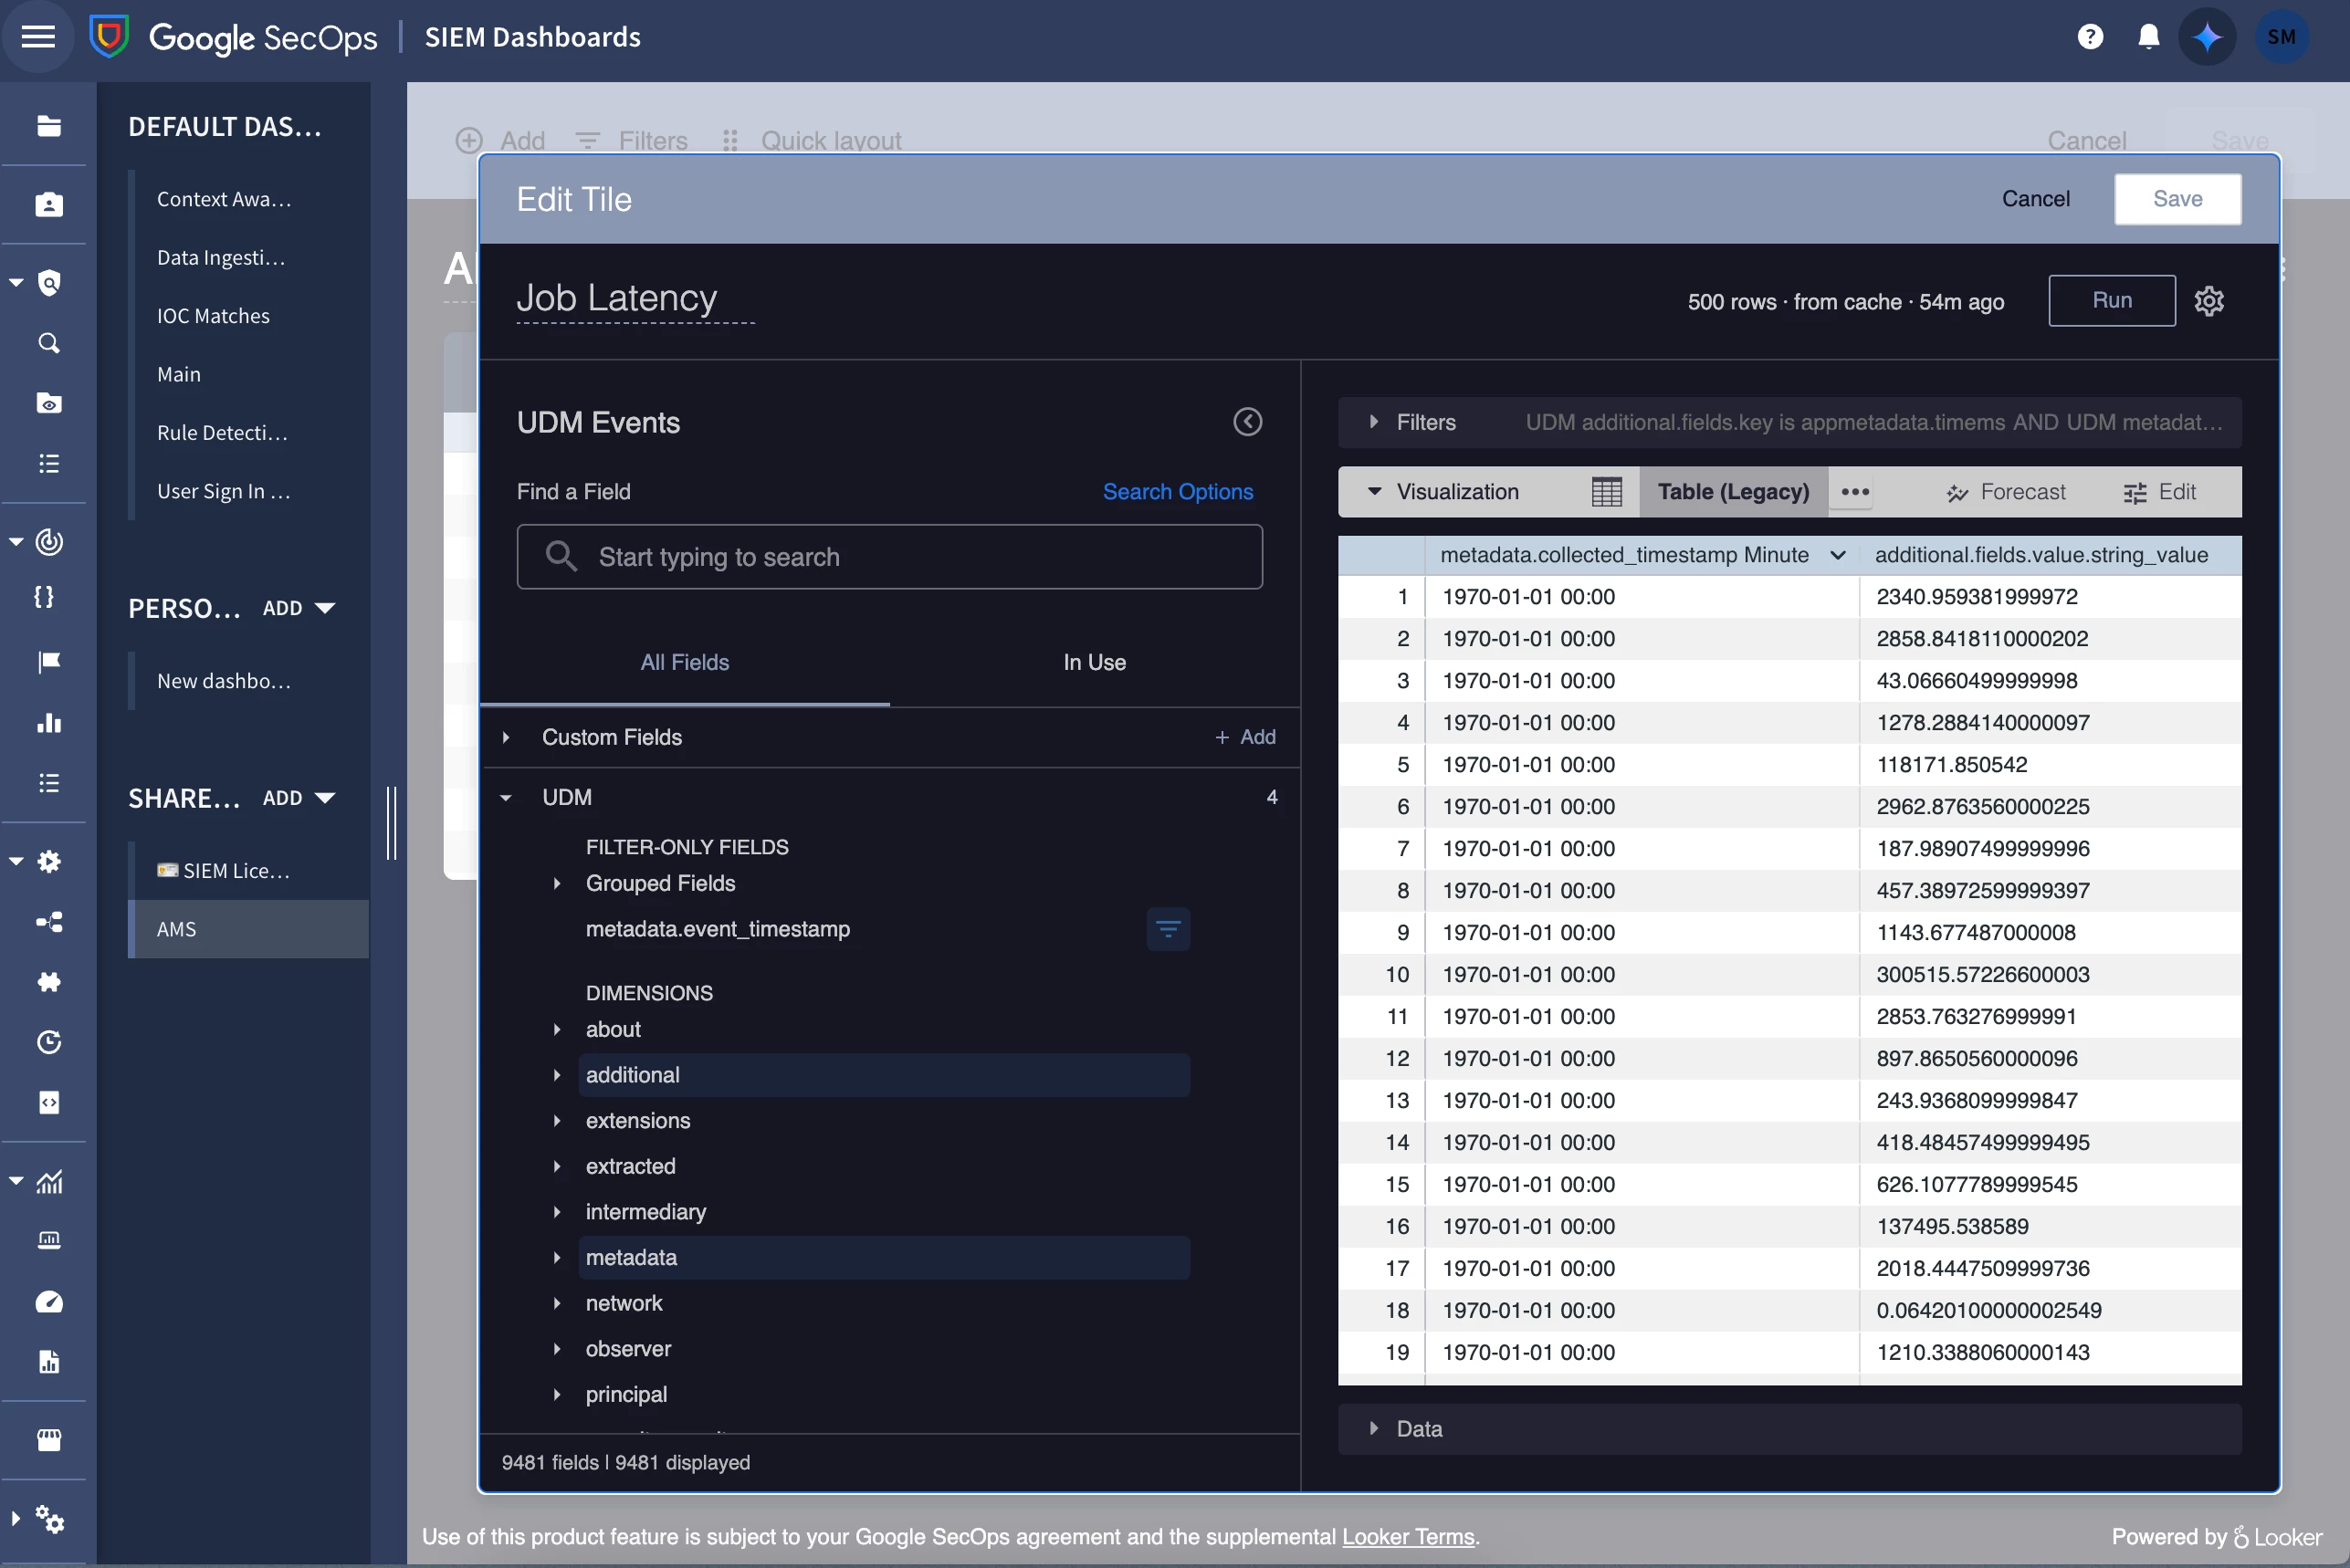
I would like to create a dashboard that shows a graph of Appmetadata.timems values over time. I would also like to see appmetadata.name values when hovering over a point in the line graph.
I am struggling to use custom fields as column headers when attempting to pull in more than on additional.field.value, what is the proper way for me to create this visualization?