



Introduction
A SIEM is only as good as the data reaching it. When a feed stalls, a parser breaks or a forwarder falls silent, detections go quiet with it, and nobody is told. This guide closes that gap without loosening a single control on your SecOps project.
It walks through the Google Cloud console, click by click. You link the SecOps project to a central monitoring project through a metrics scope, then build three alerts on the native metrics SecOps already publishes. Alerting roles, policies and notification channels all live in the central project, so the SecOps project stays exactly as locked down as it is today.
How it fits together
The central monitoring project reads SecOps metrics through its metrics scope, so every alerting policy and notification channel is created outside the SecOps project.
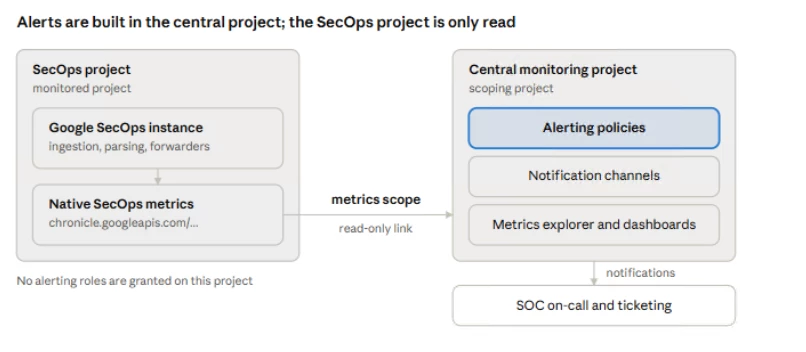
SecOps metrics stay in the SecOps project. The metrics scope lets the central project read them and alert on them.
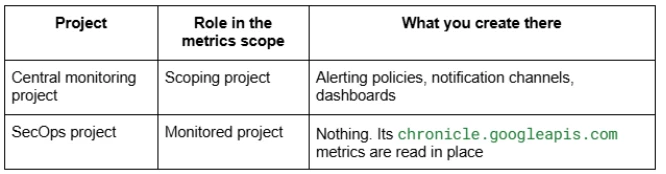
This guide uses CENTRAL_PROJECT and SECOPS_PROJECT as placeholders for the two project IDs.
***
Before you begin
Alerting roles are granted on the central project only. The SecOps project needs one role, once, to create the link.
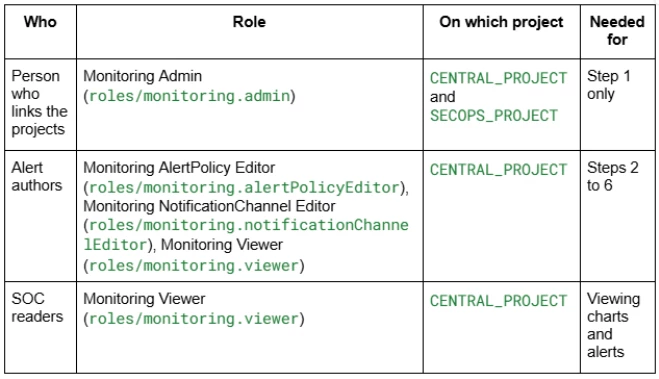
Monitoring Viewer lets alert authors browse metrics and see the chart preview while they build a policy. Google's Console instructions name Monitoring Editor (roles/monitoring.editor) as the single-role alternative.
Check three things before Step 1:
- SecOps metrics exist. The SecOps instance is linked to SECOPS_PROJECT, and someone with access there can see Chronicle metrics in that project's Metrics explorer.
- VPC Service Controls. If SECOPS_PROJECT sits inside a service perimeter, CENTRAL_PROJECT must be in the same perimeter or joined to it by a perimeter bridge. Otherwise the add in Step 1 fails.
- Audit trail. Metrics scope changes made in the Console are not written to audit logs. If your security team needs a record, make the same change with the Cloud Monitoring API or gcloud.
***
Step 1: Add the SecOps project to the metrics scope
Do this from the central project, signed in as the person who holds Monitoring Admin on both projects.
- In the Google Cloud console project picker, select CENTRAL_PROJECT.
- Open the navigation menu and go to Monitoring > Settings. If you use the search bar, pick the result whose subheading is Monitoring.
- Select the Metric Scope tab. It lists the projects this project monitors.
- In the Google Cloud Projects pane, click Add Projects.
- In the Add Google Cloud projects dialog, click Select Projects, tick SECOPS_PROJECT, then click Add Projects. (okkes-secops-2025 is the Secops project on my tenant)
-
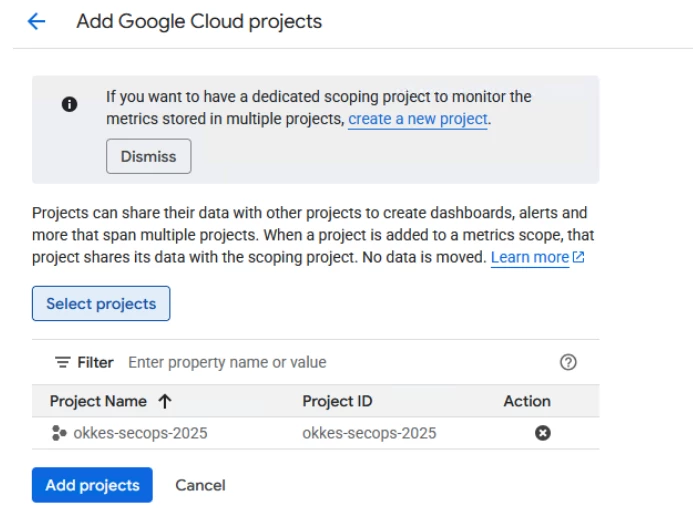
Back on the Settings page, confirm SECOPS_PROJECT appears in the table.
-
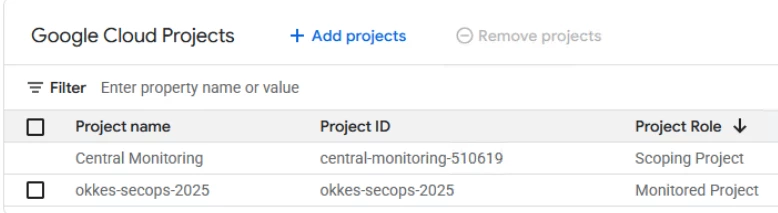
Wait at least 60 seconds, then refresh the page before you chart or alert on the new metrics.
To undo the link later, select the project in the same pane and click Remove project. Existing alerting policies stay in place but stop receiving SecOps data.
***
Step 2: Confirm SecOps metrics are visible
Chart one SecOps metric from the central project before you build any alert. It proves the link works and shows you the label values you will filter on.
- With CENTRAL_PROJECT still selected, go to Monitoring > Metrics explorer.
- Click Select a metric and type chronicle in the filter bar.
- If nothing is listed, clear the Active toggle. It hides metrics that have had no recent data.
- Choose Chronicle Collector > Ingestion > Total Ingested Log Count, then click Apply.
-
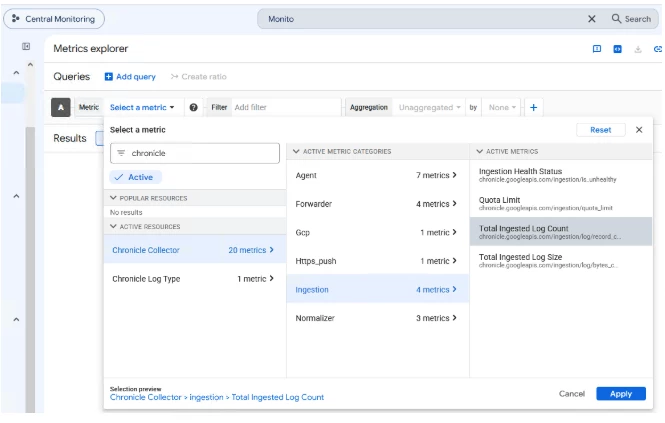
Click Add filter, choose project_id, and set it to SECOPS_PROJECT.
- In the Grouping control, leave the function on Sum, open the "by" menu next to it (it shows None), and tick log_type. Check the chart, then swap it for collector_id. Note the exact values for the feeds and forwarders you care about.
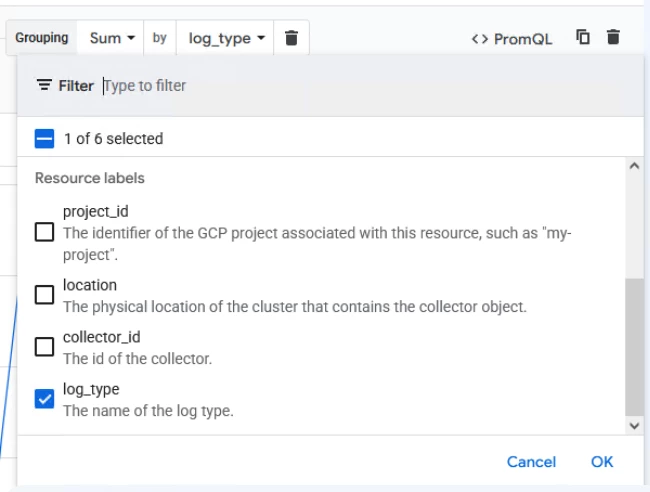
If the chart stays empty, recheck Step 1, the 60-second wait, and the VPC Service Controls note above.
SecOps metrics carry four resource labels you can filter on in every step below: project_id, location, collector_id and log_type. In the Console's filter menu they appear by these short names.
***
Step 3: Create notification channels
Notification channels belong to the central project, so create them there before the first policy.
- With CENTRAL_PROJECT selected, go to Monitoring > Alerting.
- Click Edit notification channels.
- Find the channel type you want, such as Email, PagerDuty, Slack, Webhooks or Pub/Sub, and click Add new.
- Complete the form. For email, enter the Email Address and a Display Name such as SOC on-call.
- Click Save.
Google recommends at least two channel types per policy for redundancy, for example email plus a paging tool.
***
Step 4: Alert when a critical data feed stalls
A metric-absence policy notifies the SOC when a log type stops arriving. The example uses GCP_CLOUDAUDIT and a 60-minute silence.
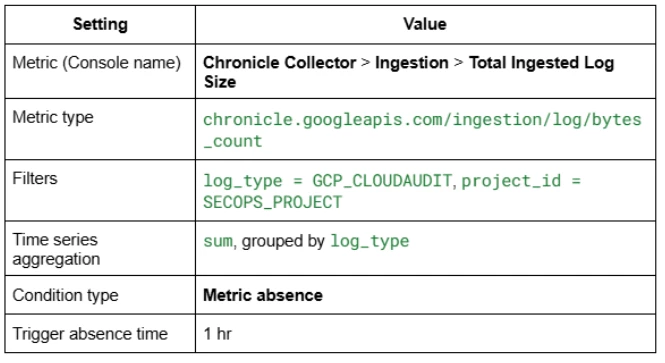
- With CENTRAL_PROJECT selected, go to Monitoring > Alerting and click Create policy.
- Click Select a metric. Clear the Active toggle if the metric is not listed.
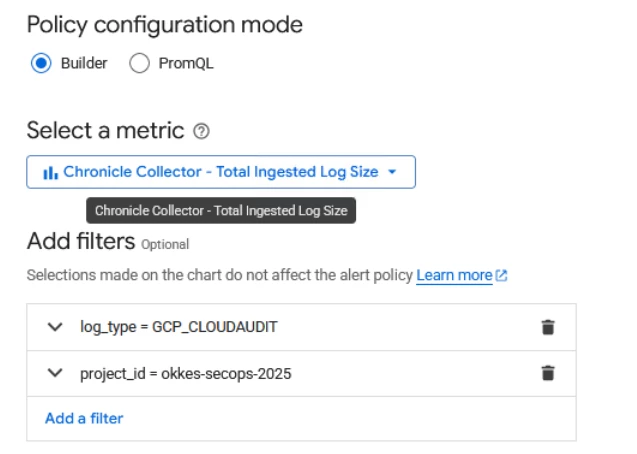
- Choose Chronicle Collector > Ingestion > Total Ingested Log Size, then click Apply.
- Click Add filter, choose log_type, the = comparator and GCP_CLOUDAUDIT (or any logtype you want to monitor), then click Done.
- Click Add filter again and set project_id to SECOPS_PROJECT.
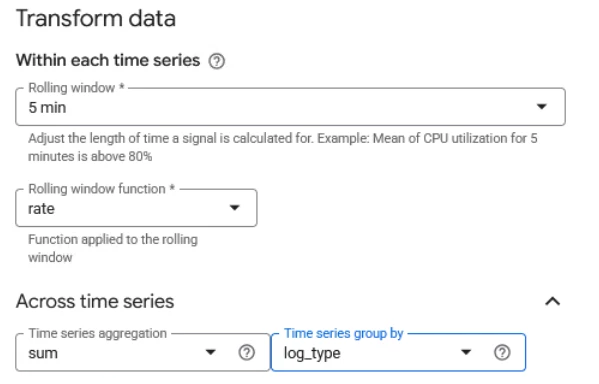
- In the Across time series section, click Expand. Set Time series aggregation to sum and Time series group by to log_type.
- Click Next.
-
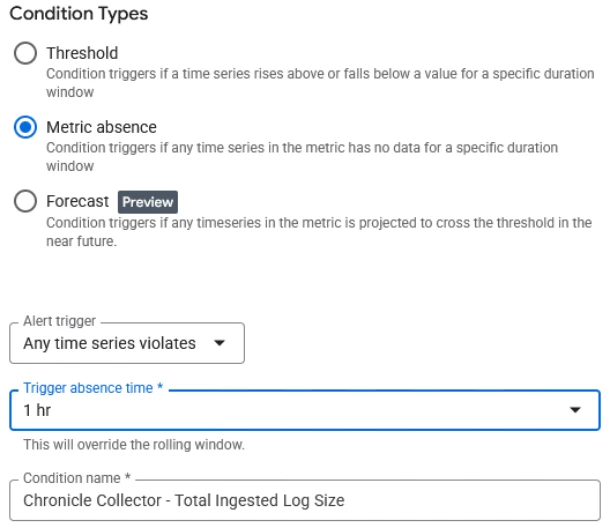
For the condition type, select Metric absence.
- Leave Alert trigger on Any time series violates and set Trigger absence time to 1 hr. (Or less, depends on the log type criticality)
-
Click Next.
-
Under Notifications and name, select the channels from Step 3.
-
Optional: tick Notify on alert closure, set Policy severity level to Critical, and write triage notes in Documentation.
-
In Alert name, enter a name such as SecOps: GCP_CLOUDAUDIT ingestion stalled.
-
Review the summary and click Create policy.
Three things to know about this policy:
- Grouping matters. Without step 6, each collector and namespace is its own time series, and the alert fires when any one of them goes quiet.
- Keep the absence time at 30 minutes or more. SecOps metrics are sampled every 60 seconds and can take up to 12 minutes to become visible. The maximum is 23.5 hours.
- The feed must report once first. A metric-absence condition needs at least one data point after the policy is created before it can fire.
To cover several critical log types, change the filter comparator to one_of and list them. The grouping in step 6 then raises a separate alert per log type.
***
Step 5: Alert when logs fail to parse
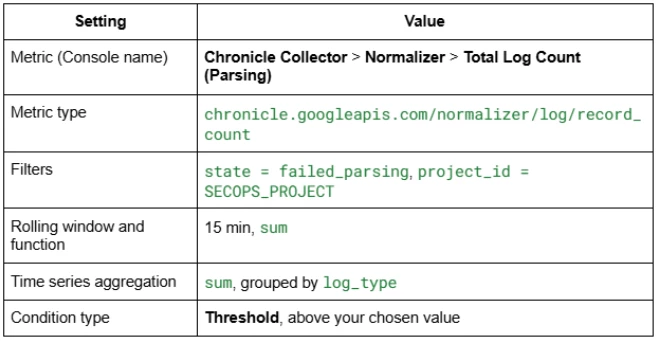
A metric-threshold policy on the Normalizer metric tells engineering when logs arrive but are not turned into UDM events.
Follow steps 1 to 14 of Step 4, with these differences:
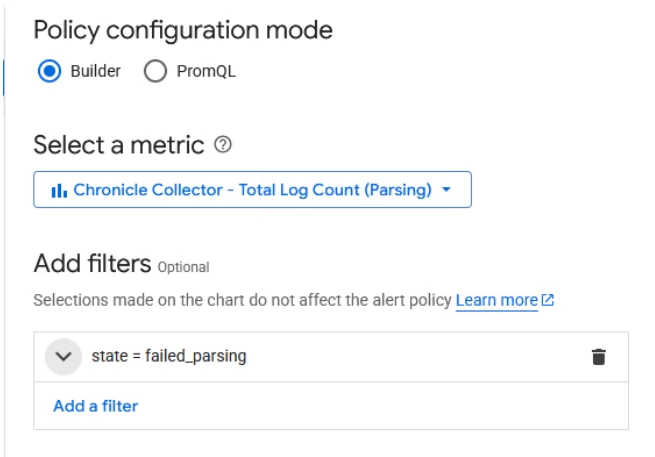
- In Select a metric, type normalizer in the filter bar and choose Total Log Count (Parsing). Some Console and documentation versions label it Total record count.
- Click Add filter, choose the metric label state, and set it to failed_parsing.
- Under Transform data, set Rolling window to 15 min and Rolling window function to sum.
- On the next page, select Threshold as the condition type.
- Leave Alert trigger on Any time series violates. Set Threshold position to Above threshold and enter your Threshold value.
- Under Advanced Options, leave Retest window on No retest. The 15-minute rolling window already smooths short spikes.
- Name it, for example SecOps: parsing failures above threshold.
The state label takes five values: parsed, validated, failed_parsing, failed_validation and failed_indexing.
The Value menu in the filter dialog only lists values seen in the last week, and it narrows as you type. If failed_parsing is not offered, your parsers have been healthy. Type the value by hand; the policy saves normally and fires when failures appear. With no failure history to baseline from, start with a low threshold and raise it if it proves noisy.
To pick the threshold, chart the same filtered metric in Metrics explorer over one to two weeks and set the value above the normal peak for your noisiest log type.
To catch logs that parse but break UDM validation, create a second policy on Total Event Count (Parsing) (chronicle.googleapis.com/normalizer/event/record_count) with state = failed_validation.
***
Step 6: Alert when a collection agent goes silent
Google's documented way to detect a failed forwarder is a metric-absence policy grouped by collector_id. It fires once per collector that stops sending.
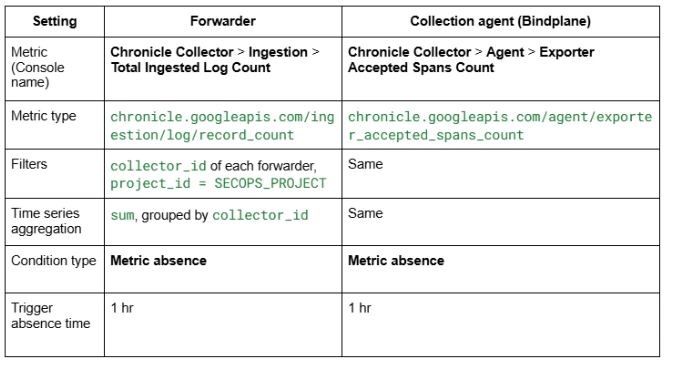
Follow steps 1 to 14 of Step 4, with these differences:
- In Select a metric, choose the metric for your collector type from the table.
- Click Add filter, choose collector_id, the one_of comparator, and select the IDs you noted in Step 2.
- In Across time series, set Time series aggregation to sum and Time series group by to collector_id.
- Select Metric absence, keep Any time series violates, and set Trigger absence time to 1 hr.
- Name it, for example SecOps: forwarder silent for 60 minutes.
Collector IDs made of one repeated character, such as bbbbbbbb-bbbb-bbbb-bbbb-bbbbbbbbbbbb, are shared Google-side sources such as the Ingestion API and feeds, not forwarders. Leave them out of this policy. Google's page lists each one.
***
Step 7: Test the alerts
Prove each policy fires once before the SOC relies on it.
- On Monitoring > Alerting, confirm all three policies are listed and enabled.
- Open each policy and check that its chart shows SecOps data from SECOPS_PROJECT.
- Copy the threshold policy, set its Threshold value below current volume, and confirm a notification reaches every channel. Then delete the copy.
- For an absence policy, point a copy at a test log type you can pause, with a short Trigger absence time.
- Update the collector_id filters whenever a forwarder is added, replaced or retired.
During planned maintenance, use Snooze on the Alerting page to silence a policy for a fixed period instead of disabling it.
***
Considerations
Four points affect how you run this setup after it is built.
- Read access follows the central project. Anyone with Monitoring Viewer on CENTRAL_PROJECT can see SecOps time-series data. They need no role on SECOPS_PROJECT. Treat membership of the central project as access to SecOps ingestion telemetry.
- Only metrics cross the link. A metrics scope does not expose SecOps logs, rules, cases or configuration.
- Custom log-based metrics stay local. A log-based metric must be defined in SECOPS_PROJECT, where the logs are. Once it exists, the central project can chart and alert on it through the same scope. Log-based alerting policies, which match log entries directly, cannot be created from the central project.
- Limits. A metrics scope holds 375 projects by default. A project can be monitored by more than one scope, so a separate SOC or platform scope remains possible.
***
Summary
One metrics scope link gives the central monitoring project a read-only view of SecOps ingestion telemetry. Three policies then cover the failures that matter most: a critical feed going quiet, logs failing to parse, and a forwarder or collection agent falling silent.
The SecOps project gains no alerting roles, no policies and no notification channels. The only change it sees is a one-time Monitoring Admin grant to create the link. Everything else is built, tuned and owned in the central project.
From here, extend the same pattern. Add more log types to the absence policy, baseline your parsing thresholds over a week or two, and switch on the optional forwarder resource alerts once the core three are steady.
***
Reference: SecOps metrics used in this guide
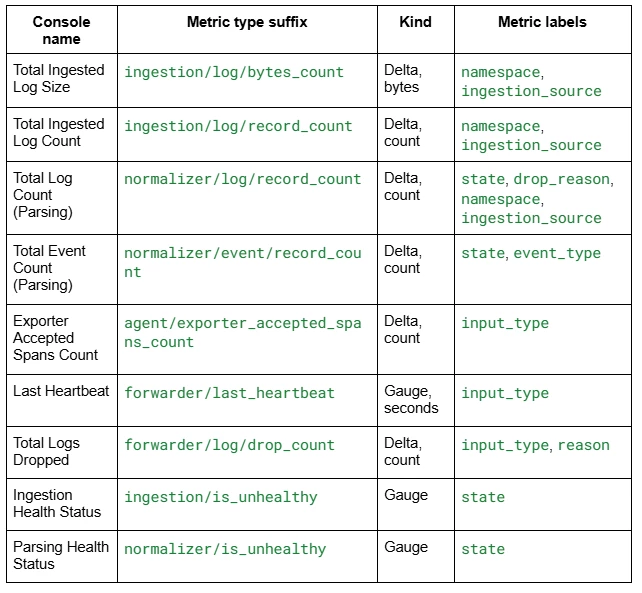
Every metric type below starts with chronicle.googleapis.com/ and is listed in Google's published metric catalogue as of September 2026.
Sources
• Configure a metrics scope (Console steps, roles, VPC Service Controls, quota)
• Metrics scopes overview (data model, read access)
• Configure a metrics scope by using the API (audit logging note)
• Create metric-absence alerting policies (Console steps and field names)
• Create metric-threshold alerting policies
• Google Cloud metrics: chronicle (metric types and labels)
• Analyze ingestion with Cloud Monitoring (SecOps filters, silent forwarder and agent policies)
