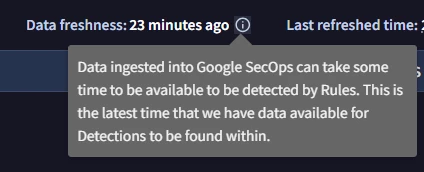
An associate of mine ran a SIEM search and got 4 results. They then ran a test of a YARA-L rule with the same logic and got 2 of those 4 results. 10 minutes later it showed 3 of the results. 30 minutes later it showed all 4 results. Is there a known lag when using the “RUN TEST” feature in the Detection Rules?
The logic used to search was straightforward -- just filtering on 4 UDM fields. No match section.
Thanks,
Eric
Page 1 / 1
I haven’t run into any lag with the test rule function. The same query logic over the same time range should produce the same results.
The 2 main things I run into which causes a difference from UDM search and test rules is either a mis matched time range between the two, or a difference caused by UDM search defaulting to ‘nocase’ and the detection requiring individual fields be marked nocase.
There is a small latency on the pipeline used for Rules Engine. If you go to your Rules Dashboard tab you should see a `Data freshness` value which gives you an indicator of the latency at that moment in time, and that latency, and you can also infer this based on the last available timestamp for Rule Test time range picker.
For rule development and testing I would recommend you don’t focus on near realtime logs if you need to evaluate and compare against a baseline of data from UDM Search.
What variables impact data freshness?
I'm not aware it’s officially documented but there are multiple enrichment pipelines that are used in the platform, e.g,. pipelines that apply user or asset enrichment, process aliasing, geo-ip enrichment, etc… within the rules engine one taking longer to be applied than in the UDM Search pipeline. The plan is that the Rules Engine one will be reduced in latency in the next few months and you should see lower time, but to the original question, unless you need to test against real time logs it’s best to choose end end time of -1 hour in both rules and search and then (other than if you have late arriving data) you will get more consistent results for rule development and validation
Just so I’m crystal clear, the value in my attached screenshot means all of our SIEM rules will be delayed by 41 minutes?
Single event rules would be expected to have a lower latency (a minute), varying from near realtime to rules using a run frequency (for example using a match statement in your single event rule) to a few minutes.
So not all, but some rules, and also it’s a snapshot at the time you took it, and so it wont always be that value.
The article you linked explains several factors impacting rules applying to live data. That’s useful info, but what exactly does data freshness represent? Is it only a measure of latency related to testing rules?
As I understand it, different components have their own pipeline for data processing, aliasing, and enrichment, those being sSearch and Rules) and within Rules Single Event rules are processed separately to Multi-event rules (hence they can fire at near realtime, where as Multi-events are using their own pipeline which has a higher latency.
The data freshness shows you the latest available data that would be used for a multi-event rule in that part of the Rules Engine pipeline. You can usually see a correlation between this Data Freshness value and the Rules Editor, e.g., if you try to test a rule you’ll see the end timestamp is often near or around that time range.