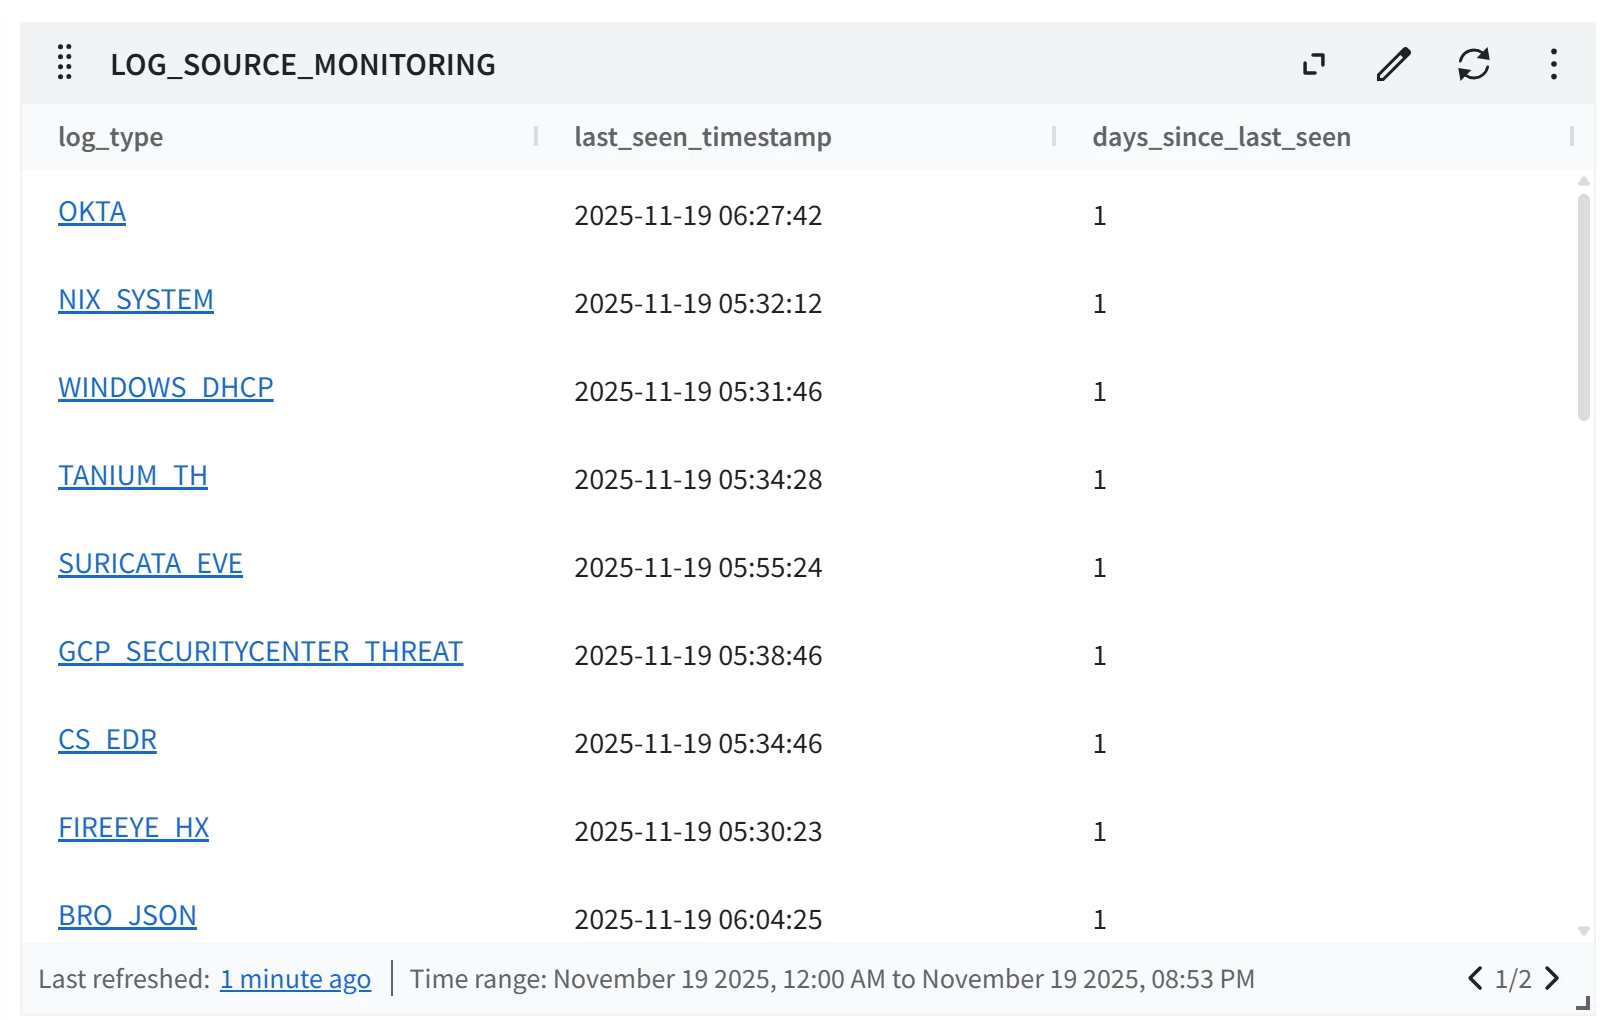
Is this correct way to track device not reporting
lookml:
- dashboard: device_reporting_
 description: ""
 elements:
 - col: 0
 column_limit: 50
 conditional_formatting_include_nulls: false
 conditional_formatting_include_totals: false
 defaults_version: 1
 enable_conditional_formatting: false
 explore: events_connector
 fields:
 - events.count
 - events.metadata__event_timestamp_max_second
 - events__metadata__base_labels__namespaces.events__metadata__base_labels__namespaces
 filters:
 events.metadata__log_type: -NULL
 events.time_filter: ""
 events__metadata__base_labels__namespaces.events__metadata__base_labels__namespaces: -"AWS_Cloudtrail_Staging",-"AWS_Cloudtrail_SharedServices",-"AWS_Cloudtrail_SharedServices",-"AWS_Cloudtrail_Production",-"AWS_Cloudtrail_PrintProd",-"AWS_Cloudtrail_Dev",-"AWS_Cloudtrail",-"AWS_GuardDuty_SharedServices",-"AWS_GuardDuty",-"SonicWall_Firewall_Logs",-"Cradlepoint_NetCloud_Logs"
 header_font_size: "12"
 header_text_alignment: left
 height: 13
 hidden_pivots: {}
 hide_row_totals: false
 hide_totals: false
 limit: 500
 limit_displayed_rows: false
 listen: {}
 minimum_column_width: 75
 model: scn
 name: Log Source Monitoring
 row: 2
 rows_font_size: "12"
 series_cell_visualizations:
 events.count:
 is_active: true
 series_labels:
 events.count: UDM Count
 events.metadata__event_timestamp_max_second: Most Recent Ingested Event Timestap
 events.metadata__log_type: Log Type
 log_source_description: Log Source Description
 show_row_numbers: true
 show_row_totals: true
 show_sql_query_menu_options: false
 show_totals: true
 show_view_names: false
 size_to_fit: true
 sorts:
 - events__metadata__base_labels__namespaces.events__metadata__base_labels__namespaces
 desc
 table_theme: white
 title: Log Source Monitoring
 transpose: false
 truncate_header: false
 truncate_text: true
 type: looker_grid
 width: 24
 - body_text: ""
 col: 0
 height: 2
 name: Log Source Monitoring Dashboard
 row: 0
 subtitle_text: ""
 title_text: Log Source Monitoring Dashboard
 type: text
 width: 11
 - col: 0
 column_limit: 50
 conditional_formatting_include_nulls: false
 conditional_formatting_include_totals: false
 defaults_version: 1
 enable_conditional_formatting: false
 explore: ingestion_metrics_connector
 fields:
 - ingestion_metrics.namespace
 - ingestion_metrics.total_entry_number
 - ingestion_metrics.timestamp_hour
 filters:
 ingestion_metrics.namespace: cisco-meraki-sd-wan-logs-italy
 ingestion_metrics.timestamp_date: 12 hours
 header_font_size: 12
 header_text_alignment: left
 height: 12
 hidden_pivots: {}
 hide_row_totals: false
 hide_totals: false
 interpolation: linear
 label_density: 25
 legend_position: center
 limit: 500
 limit_displayed_rows: false
 listen: {}
 model: scn
 name: Each Device reporting trend timeline (last 12 hrs)
 ordering: none
 plot_size_by_field: false
 point_style: none
 row: 15
 rows_font_size: 12
 show_null_labels: false
 show_null_points: true
 show_row_numbers: true
 show_silhouette: false
 show_totals_labels: false
 show_value_labels: false
 show_view_names: false
 show_x_axis_label: true
 show_x_axis_ticks: true
 show_y_axis_labels: true
 show_y_axis_ticks: true
 size_to_fit: true
 sorts:
 - ingestion_metrics.timestamp_hour desc
 stacking: ""
 table_theme: white
 title: Each Device reporting trend timeline (last 12 hrs)
 totals_color: '#808080'
 transpose: false
 trellis: ""
 truncate_text: true
 type: looker_grid
 width: 24
 x_axis_gridlines: false
 x_axis_reversed: false
 x_axis_scale: auto
 y_axis_combined: true
 y_axis_gridlines: true
 y_axis_reversed: false
 y_axis_scale_mode: linear
 y_axis_tick_density: default
 y_axis_tick_density_custom: 5
 - col: 0
 column_limit: 50
 conditional_formatting_include_nulls: false
 conditional_formatting_include_totals: false
 defaults_version: 1
 enable_conditional_formatting: false
 explore: ingestion_metrics_connector
 fields:
 - ingestion_metrics.namespace
 - ingestion_metrics.timestamp_date
 - ingestion_metrics.total_entry_number
 filters:
 ingestion_metrics.namespace: '"O365_DLP_USA"'
 ingestion_metrics.timestamp_date: 90 days
 header_font_size: 12
 header_text_alignment: left
 height: 12
 hidden_pivots: {}
 hide_row_totals: false
 hide_totals: false
 interpolation: linear
 label_density: 25
 legend_position: center
 limit: 500
 limit_displayed_rows: false
 listen: {}
 model: scn
 name: Each Device reporting trend timeline (last 90 days)
 ordering: none
 plot_size_by_field: false
 point_style: none
 row: 27
 rows_font_size: 12
 show_null_labels: false
 show_null_points: true
 show_row_numbers: true
 show_silhouette: false
 show_totals_labels: false
 show_value_labels: false
 show_view_names: false
 show_x_axis_label: true
 show_x_axis_ticks: true
 show_y_axis_labels: true
 show_y_axis_ticks: true
 size_to_fit: true
 sorts:
 - ingestion_metrics.timestamp_date
 - ingestion_metrics.total_entry_number desc
 stacking: ""
 table_theme: white
 title: Each Device reporting trend timeline (last 90 days)
 totals_color: '#808080'
 transpose: false
 trellis: ""
 truncate_text: true
 type: looker_grid
 width: 24
 x_axis_gridlines: false
 x_axis_reversed: false
 x_axis_scale: auto
 y_axis_combined: true
 y_axis_gridlines: true
 y_axis_reversed: false
 y_axis_scale_mode: linear
 y_axis_tick_density: default
 y_axis_tick_density_custom: 5
 layout: newspaper
 title: 'Device reporting '
metadata:
 exported_at: "2024-12-19T03:08:47-08:00"
 file_fingerprint: " [removed by moderator]  [removed by moderator]  [removed by moderator] 7"
 looker_version: 24.18.128
 version: "1"