


I’m encountering a strange filtering behavior in Google SecOps SIEM dashboards specifically when working with Entity data. I’m hoping to get some clarity on why the global time filters are behaving differently,
The Issue:
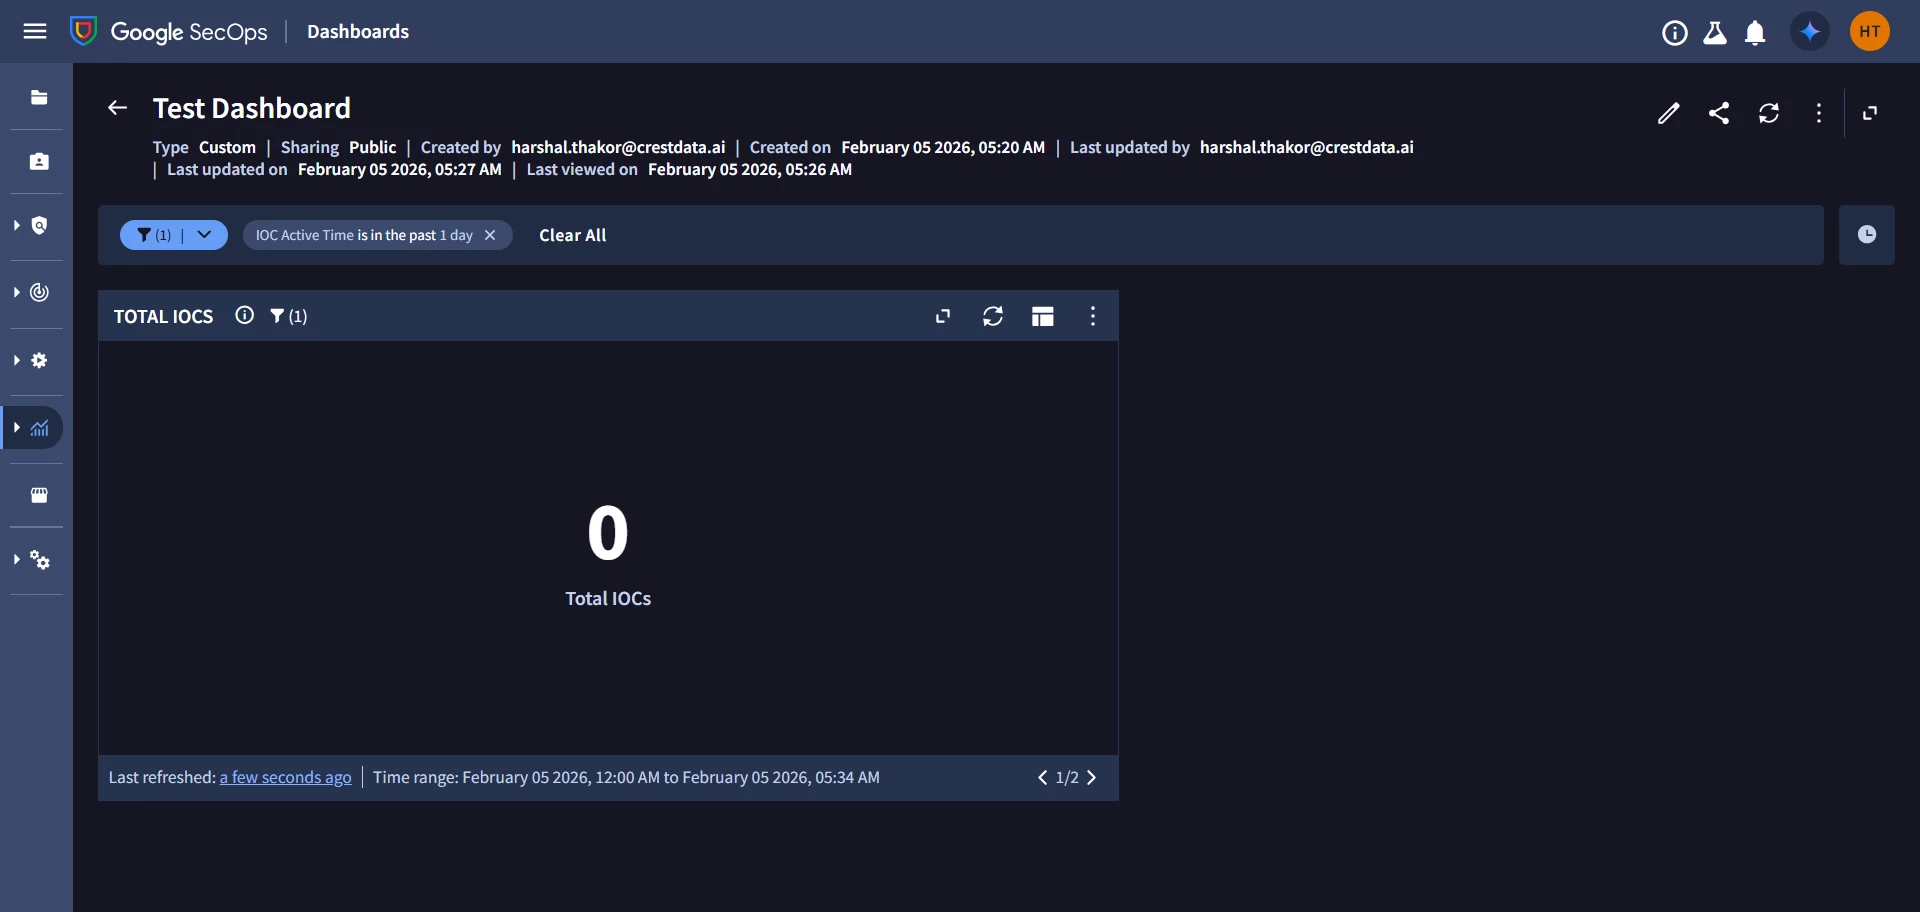
- When I use the dashboard-level filter ( in example below - IOC Active time) based on UDM field graph.metadata.interval.start_time set to "Last 1 Day," the dashboard panels show no data as shown below.
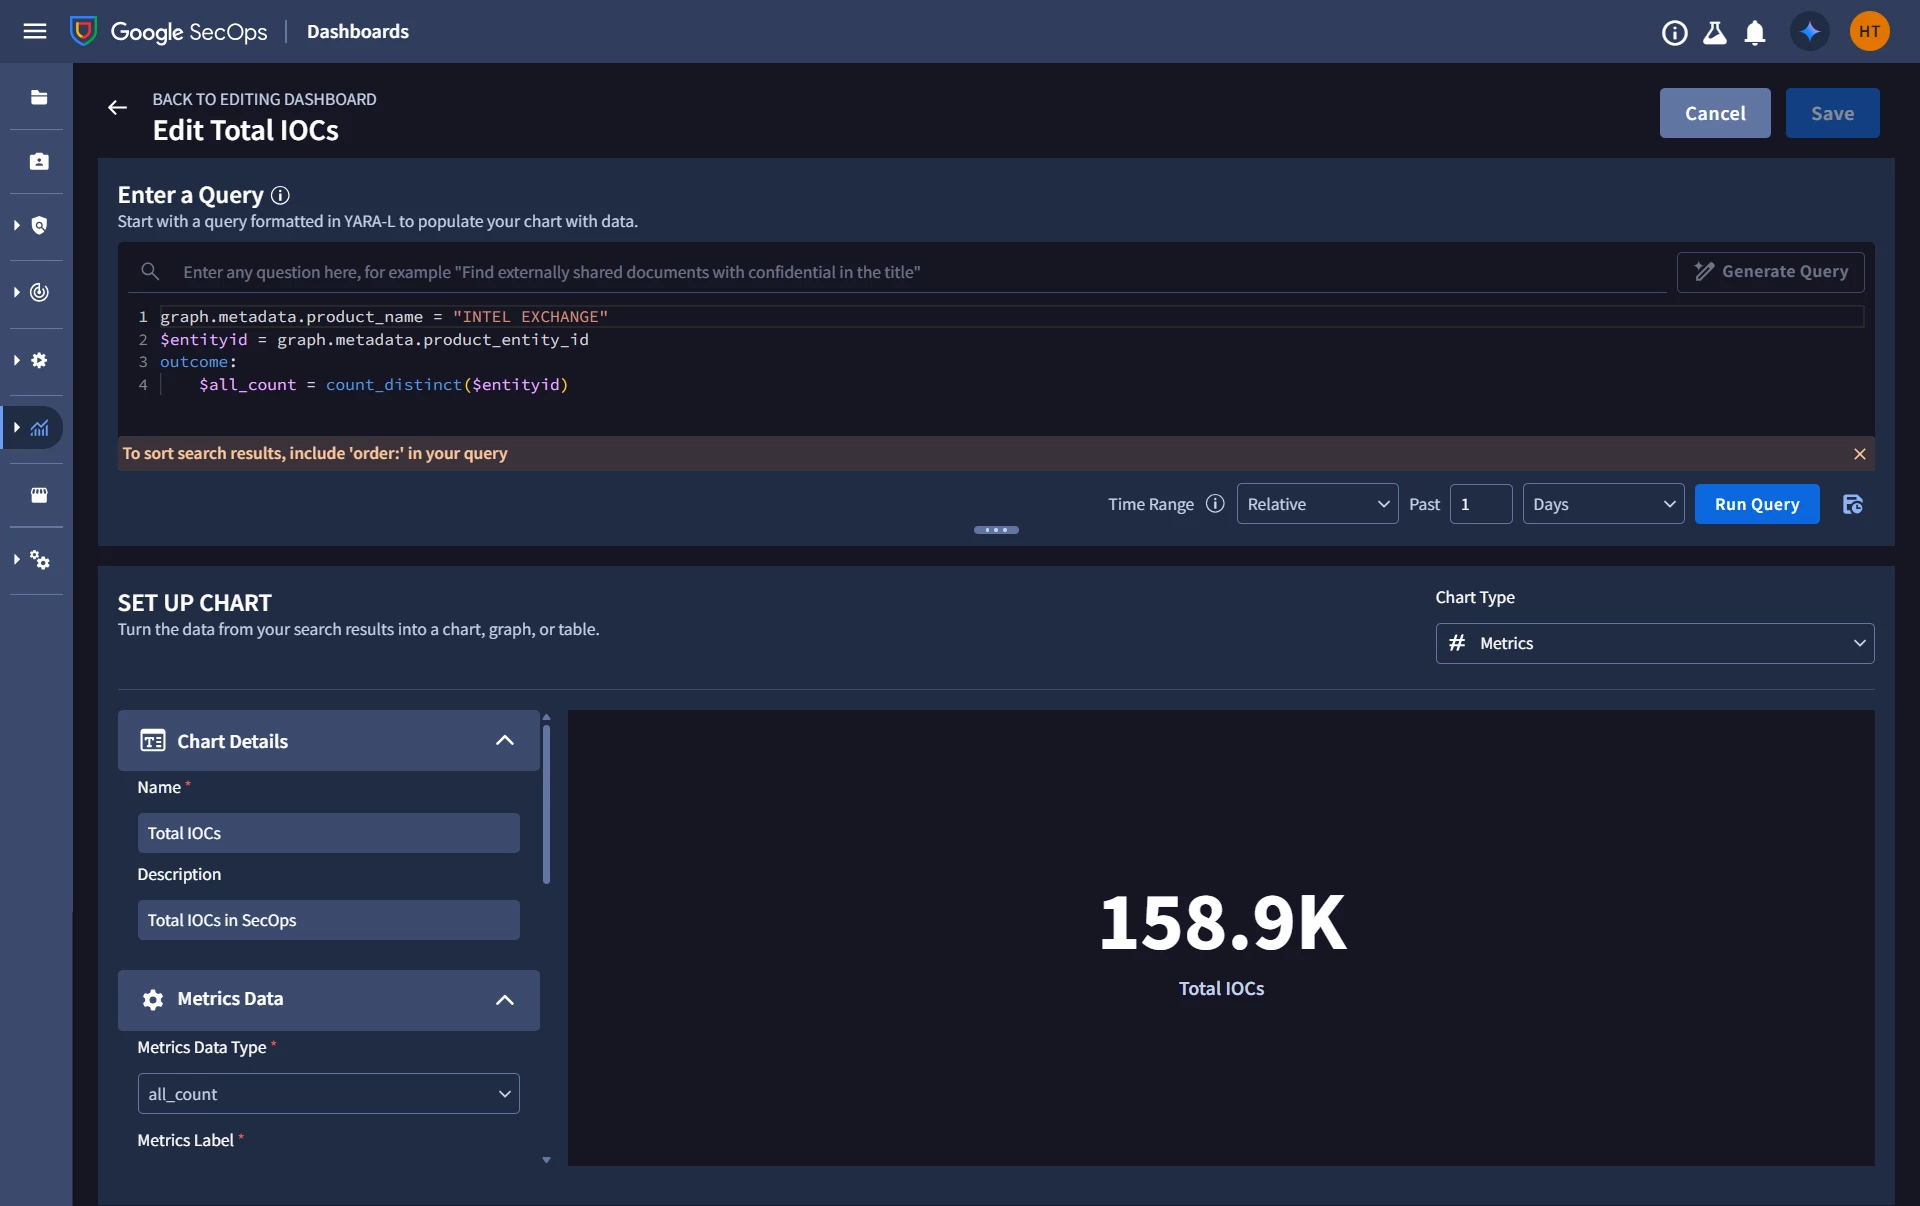
- But, If I go in the Edit Mode inside dashboard for that specific panel and apply a time filter for the "Last 1 Days" within the query/filter settings, the data populates for panel.
Technical Details:
-
Data Type: The panels queries are pulling Entity data (not UDM events).
- Filter Used: graph.metadata,interval.start_time
Questions:
- Why does the graph.metadata.interval.start_time fail to pull Entity data that is clearly available when filtered inside the edit mode of panel?
- Is the time filter inside the edit mode of panel work on metadata.interval.start_time or is there any other UDM field on that time filter is applying for entity model?
Any advice on how to properly sync these would be greatly appreciated.
