
Hello , actually i'm searching for dropped logs on my forwarder
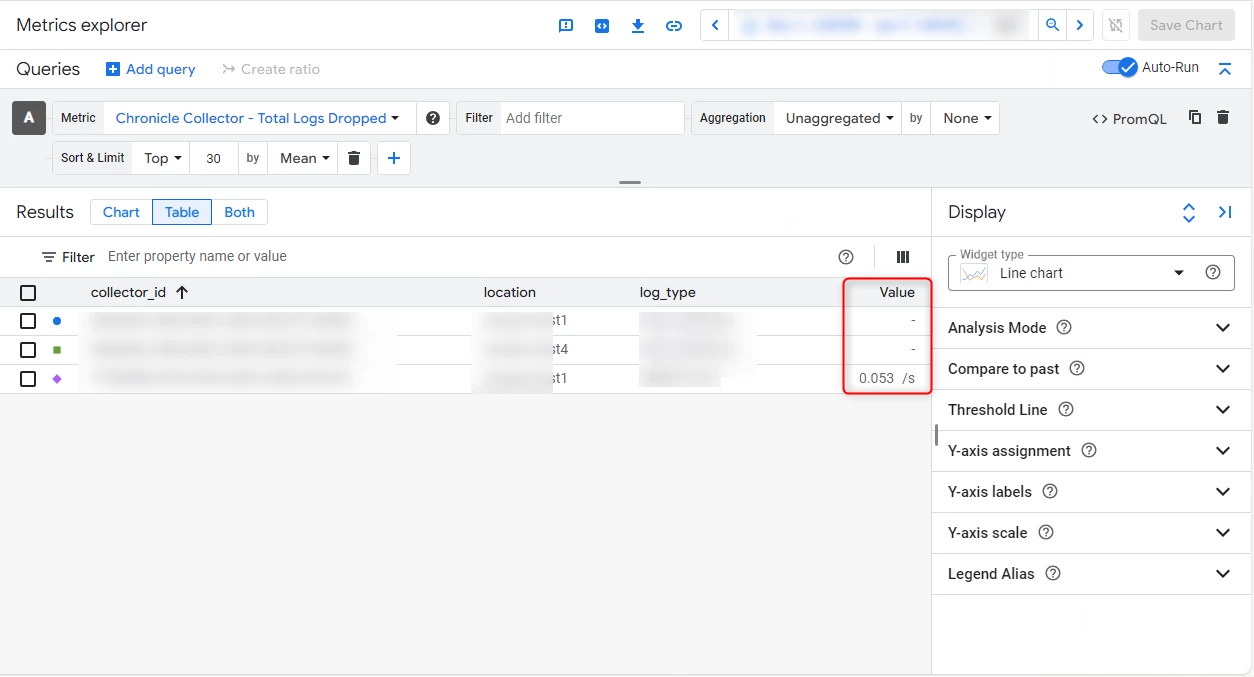
In gcp monitoring ( metric explorer ) i can see the value of total logs dropped which is 0.053/s ( mentionnedin the screenshot ) 
i can't understand the value , what does that mean 0.053/s 
can any one help ?


The metric you are monitoring is logs dropped, the value appears to be correspond to 0.053 logs dropped per second over the time interval you are looking at.


The metric you are monitoring is logs dropped, the value appears to be correspond to 0.053 logs dropped per second over the time interval you are looking at.


In essence,  .1 log every 2 seconds. 


6 logs per minute.  


how can i know the total number of logs dropped in one hour for exemple ? i can't understand that value 0.053/s
one other question please , how can i know the reason of drops ? the issue causing the drop
thnks


how can i know the total number of logs dropped in one hour for exemple ? i can't understand that value 0.053/s
one other question please , how can i know the reason of drops ? the issue causing the drop
thnks


You can apply a filter with the drop reason code - https://cloud.google.com/chronicle/docs/ingestion/ingestion-notifications-for-health-metrics#:~:text=Metric%20label%20%3E%20drop_reason_code%3A%20This%20field%20is%20populated%20if%20the%20ingestion%20source%20is%20the%20Google%20SecOps%20forwarder%20and%20indicates%20the%20reason%20why%20a%20log%20was%20dropped%20during%20normalization.


As far as telling the number of logs dropped in one hour, if we know it's 0.053 per second we can multiply by the seconds in a hour and it looks to be around 191 logs per hour. You may also be able to adjust the metric here.


Here for the reason what does mean Backlog ? 


Here for the reason what does mean Backlog ? 


I would take a look here and see if you see a similar message in your logs - https://cloud.google.com/chronicle/docs/install/troubleshoot-forwarder#possible_cause_3_buffer_size


I would take a look here and see if you see a similar message in your logs - https://cloud.google.com/chronicle/docs/install/troubleshoot-forwarder#possible_cause_3_buffer_size


Thanks Morris for the reply , now i see for exemple AT 7:35 PM a drop of 2.85/s , how i can know the duration of drop activity ? for exemple it lasts for 1 minutes , one hour ? thanks in advance


Thanks Morris for the reply , now i see for exemple AT 7:35 PM a drop of 2.85/s , how i can know the duration of drop activity ? for exemple it lasts for 1 minutes , one hour ? thanks in advance


That is configurable when you set up monitoring in the Transform Data options.


Reply