
Hello Everyone,

I am working on building native dashboards in Google SecOps and came across multiple issues related to global filters and drill-downs.

1. Additional Field Filters for Entity

I need to create a global filter on a native dashboard using graph.additional.fields["key"].

  • Has anyone been able to use Entity additional fields as filters in native dashboards?

  • Example: graph.additional.fields["key"] = "value"

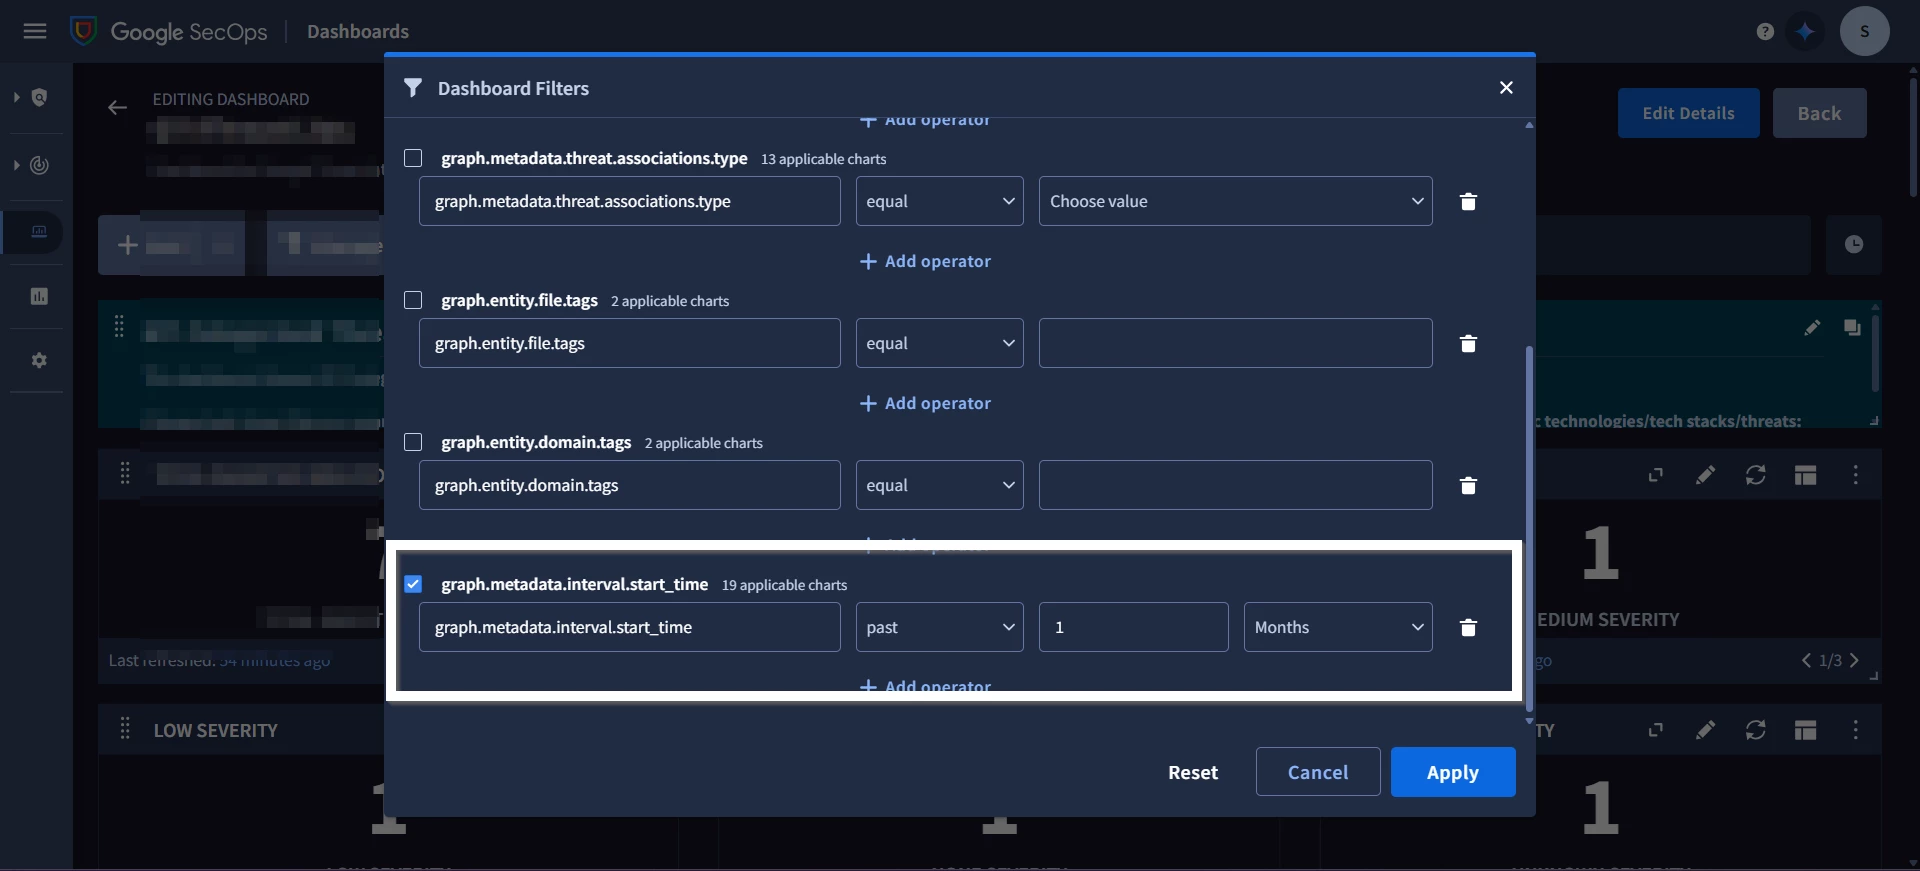
2. Time Range Filter Not Working as Expected

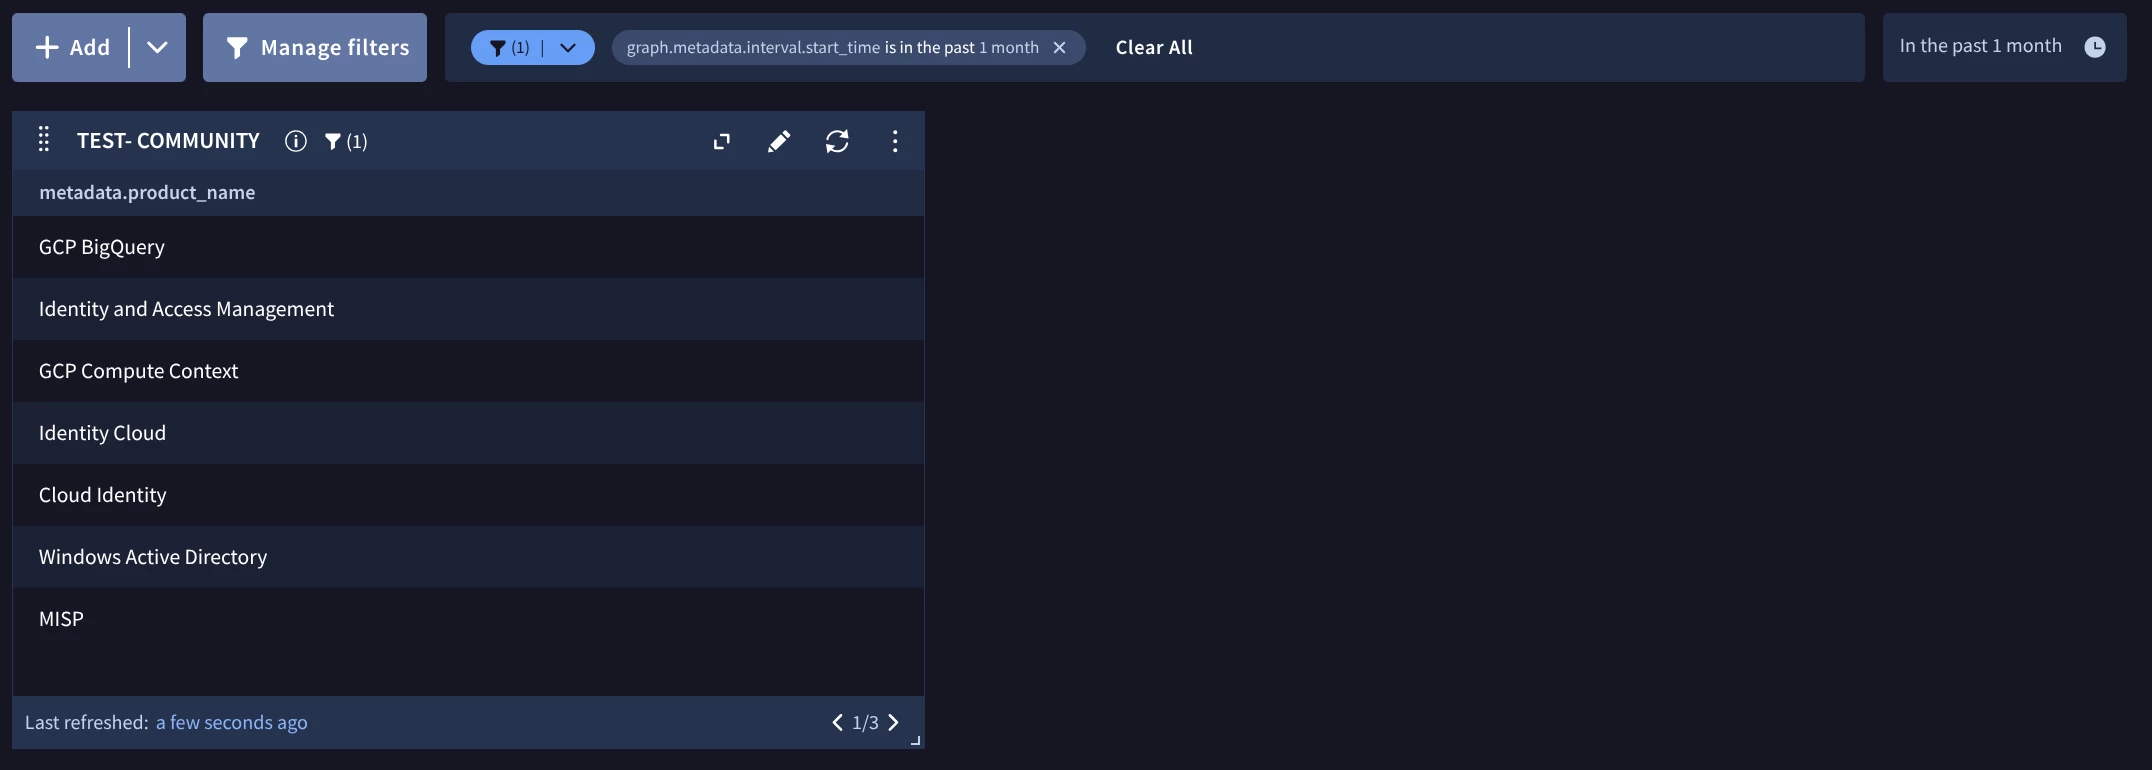
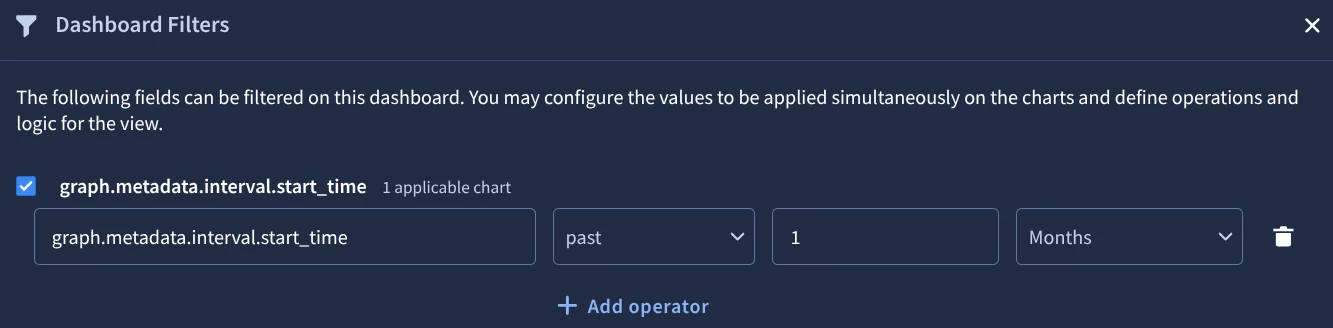
I applied a global filter using graph.metadata.interval.start_time across all charts in a native dashboard.

  • When applied, no data is returned.

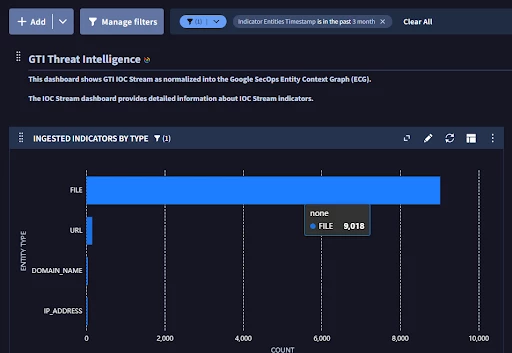
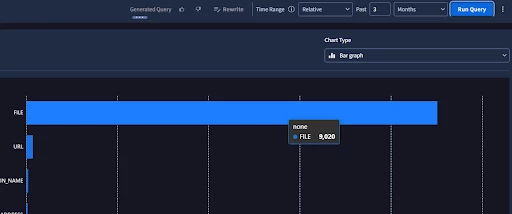
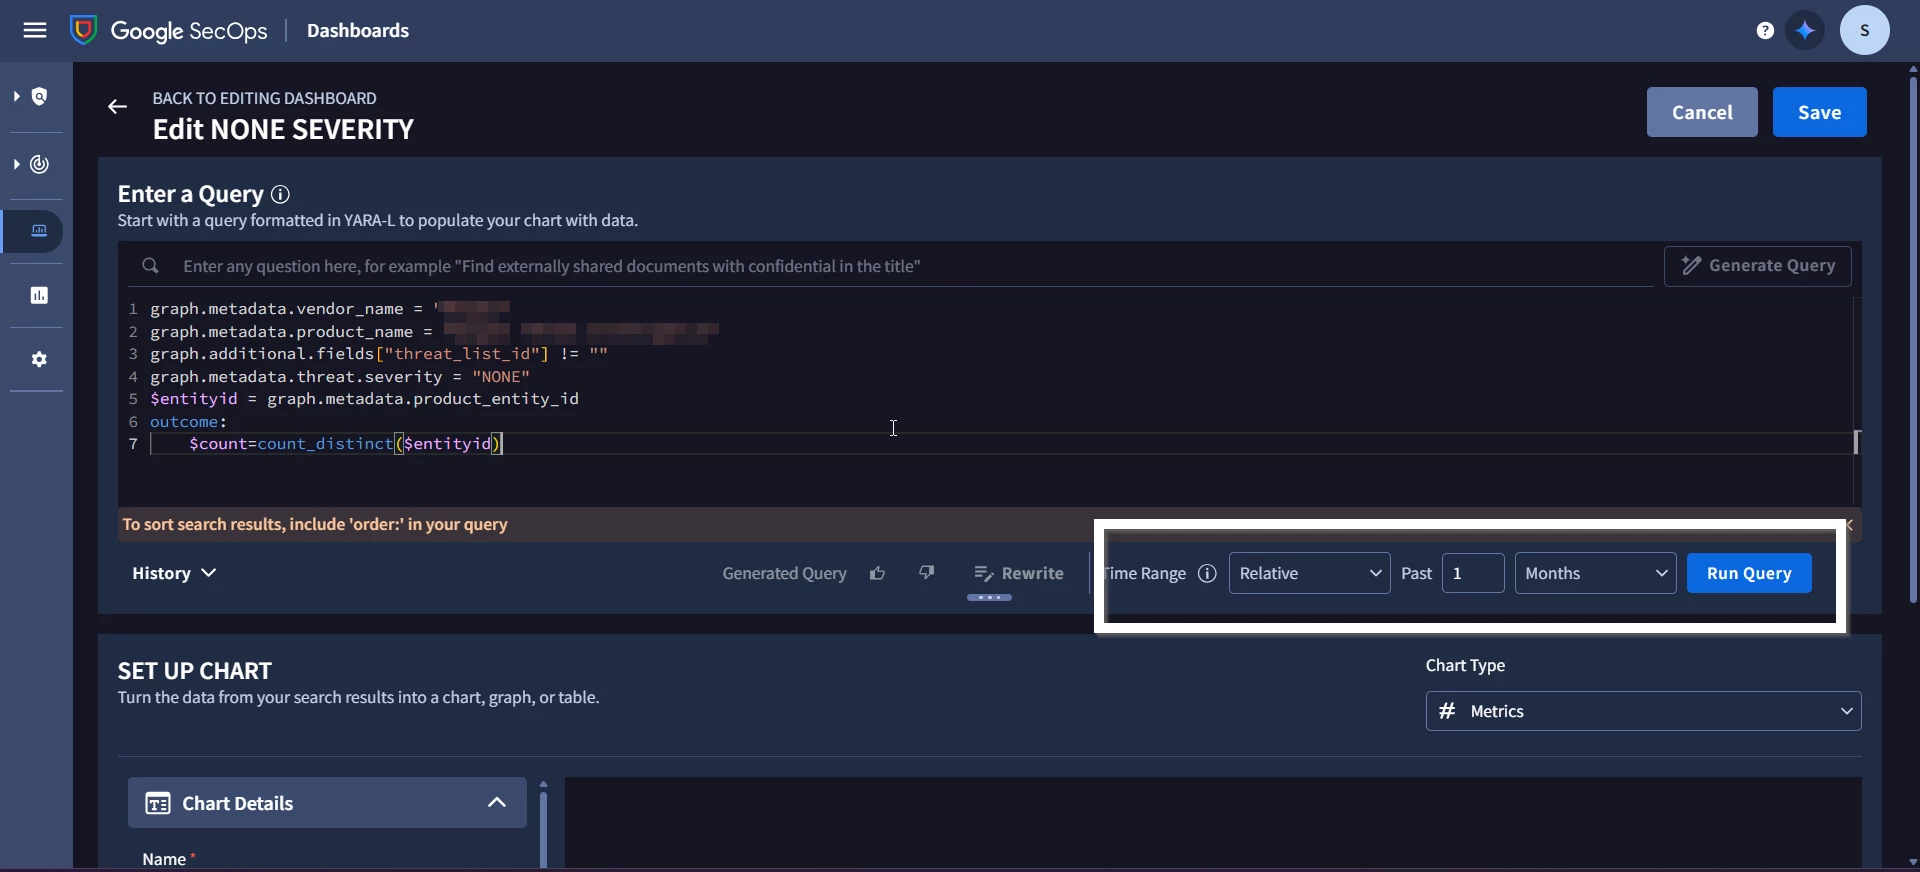
  • But when editing an individual panel and applying the same time range, data is shown correctly.

👉 Question: Does the panel time filter actually use graph.metadata.interval.start_time, or is it mapped to another field internally? If so, which one?

Global FIlter

Panel Filter


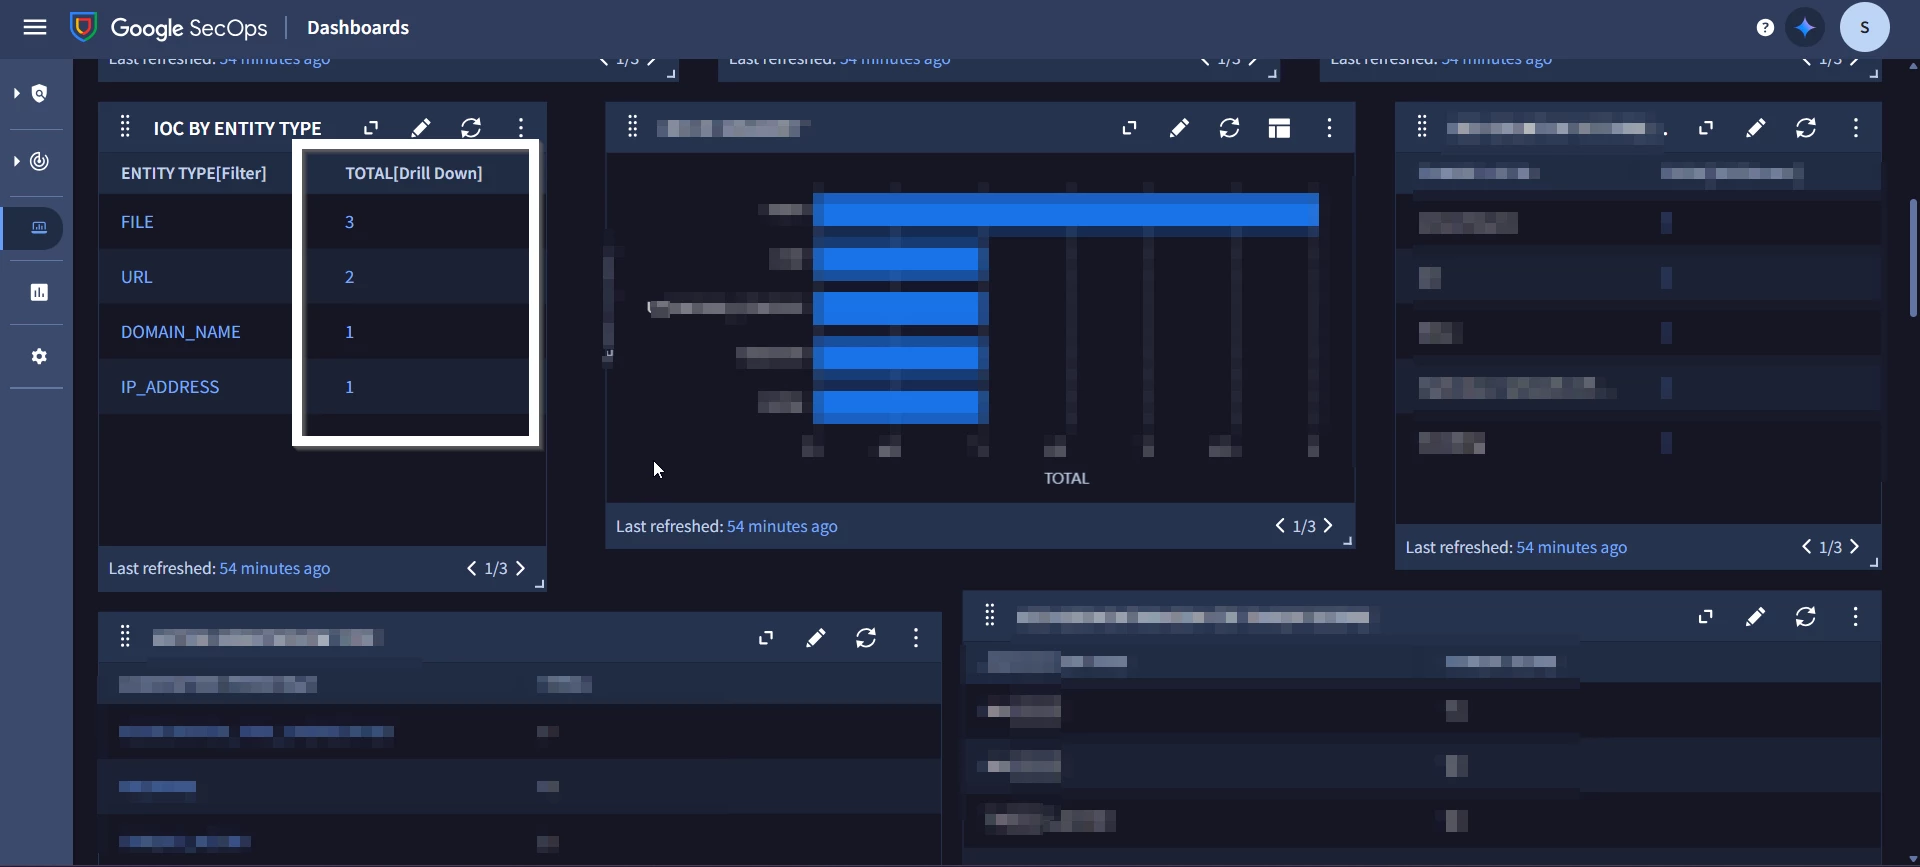
3. Drill-Down Default Time Range

I configured a drill-down on a column in a native dashboard.

  • When I click drill-down, it runs the search with the time range from the saved test query, not the global filter range.

  • Expected behavior: drill-down should inherit the global filter (e.g., if dashboard filter = last 2 days, drill-down should respect that).

👉 Question: Is there a way to make drill-down queries inherit the dashboard/global filter time range instead of being locked to the configured query?

<Drill Down in Panel>

<Drill Down Configuration>

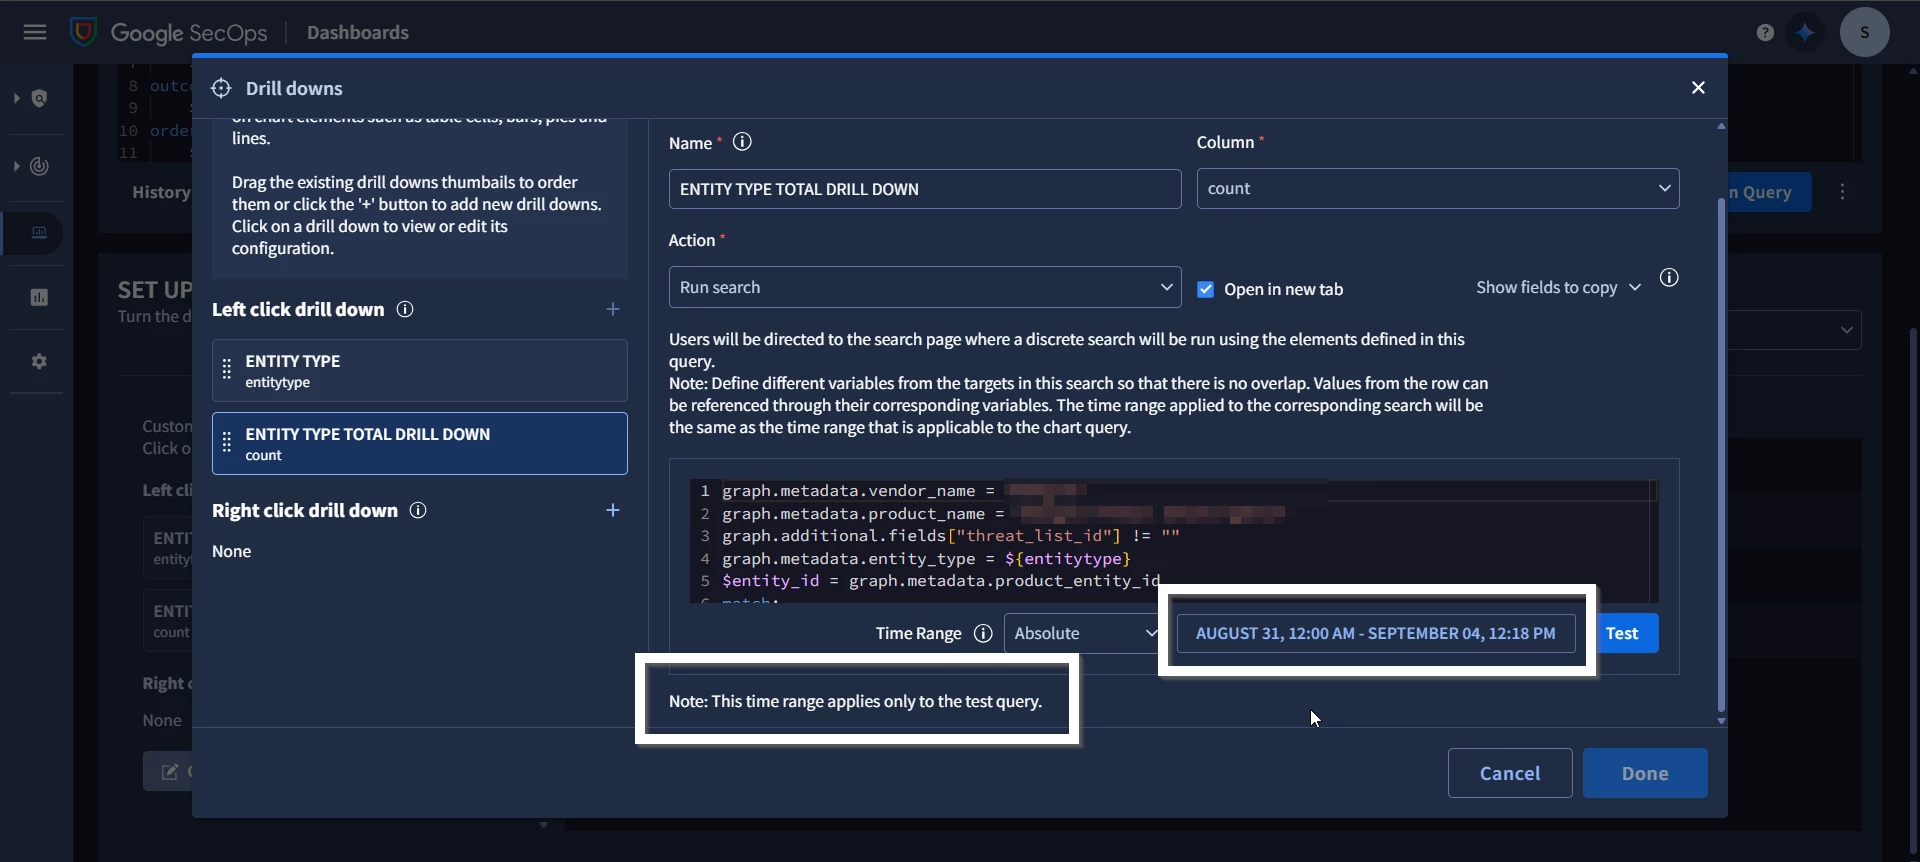
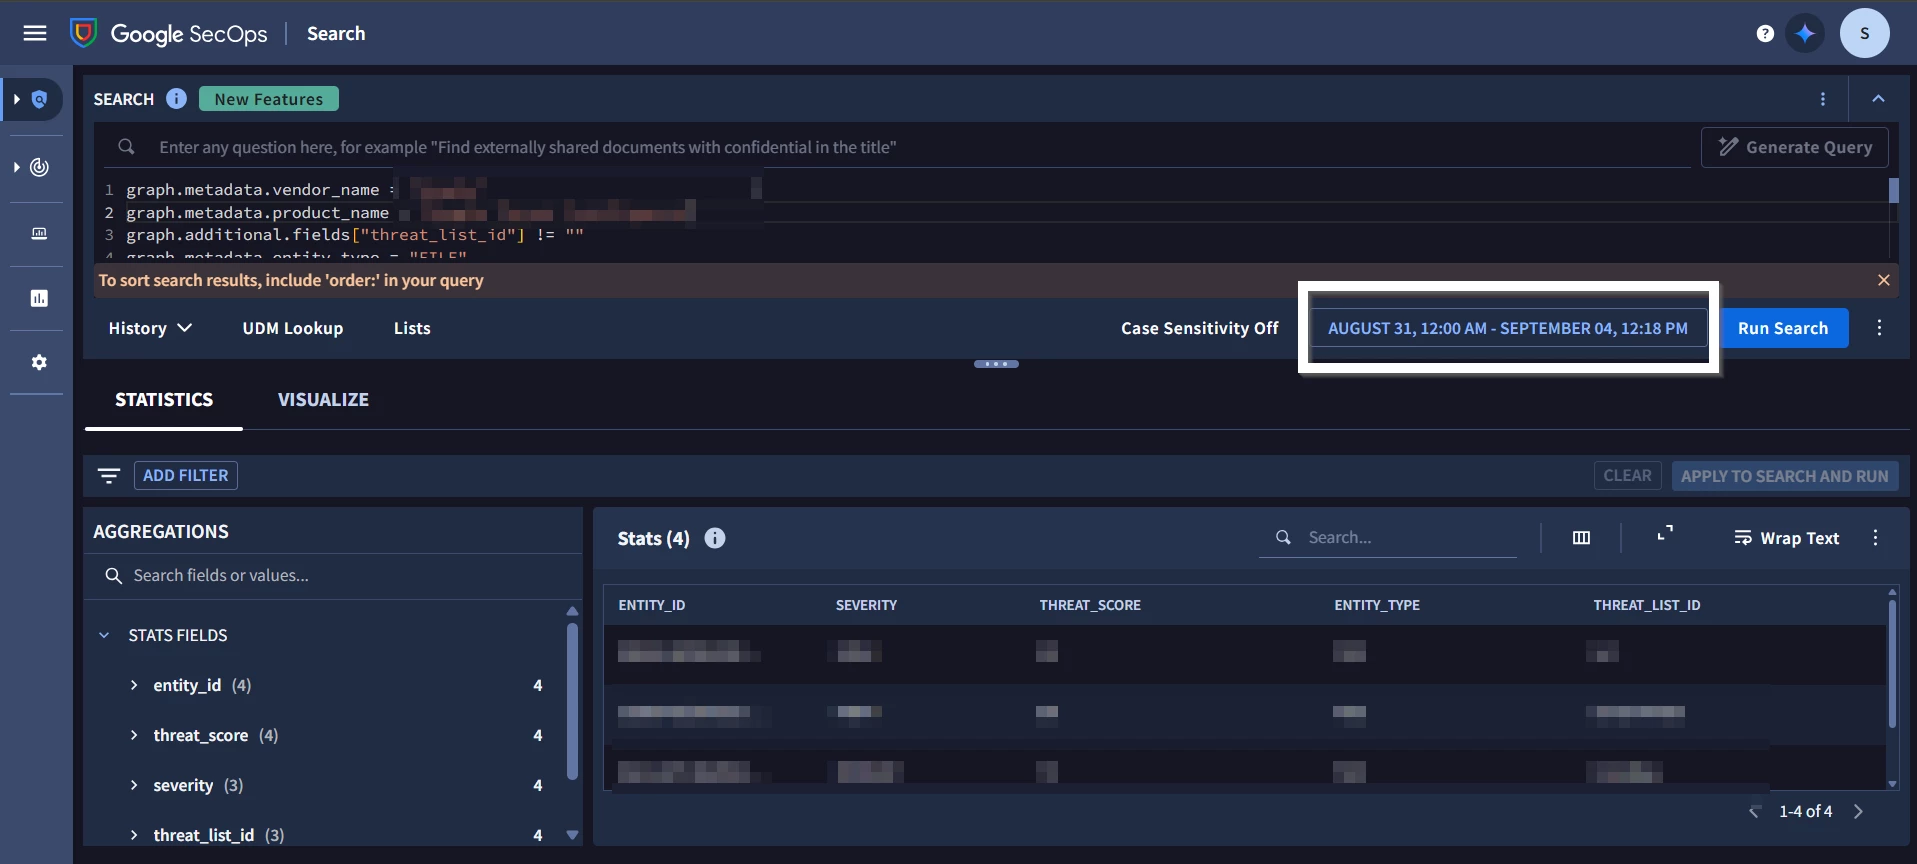
<Search query upon clicking the drill down column>


Thank you in advance for your time and support.

I don’t think the panel time filter use graph.metadata.interval.start_time. Instead it utilizes the global time filter, which can be set using either absolute or relative time values.  Please confirm details at Dashboard filters.


Hi ​@kentphelps

Thank you for your response.

I now understand that the panel time filter does not apply to graph.metadata.interval.start_time. Could you clarify which field it does work on? Is it the same field used by the Dashboard Global Filter?

Additionally, I have shared a few other related queries in this and other post. If possible, could you please redirect me to the right person who might be able to address those?

Thanks again for your help.


Yes - that is correct.  See Global Time Filter in the documentation.


Hi ​@kentphelps,

For this question: Time Range Filter Not Working as Expected

I got to know that in UDM Search, the time range filter applied on graph.metadata.interval.start_time works correctly, and we are able to view data for the selected time frame. However, when we use the same field to create Dashboard filters and attempt to filter data for the same time frame, it does not work as expected.

is it the limitaiton of the Dashboard filter that it doesn’t work with the graph.metadata.interval.start_time field? Can you confirm this?

<screenshot for dashboard filter>


Have you been able to check the interval start time values from the data you are looking at and confirm that they have values in the last month?

In my test tenant, I set up a dashboard to query the entity graph for the different product_names. With the global time filter set to one month and interval start time set to past 1 month, I returned results:

With the interval start time set to past 1 day, I did not return results, as I do not have entity data with an interval start time in that range. To validate on your side, consider changing the filtering statement for the dashboard to show additional entity data sources and see if you see the same behavior or not.


For the additional fields filter, it looks like that one is a bug. Being tracked with the number 436187577.


Okay so I have some entity data in the UDM Dashboard and I am observing a count mismatch between the Dashboard time filter and the Panel time filter, even though both are works on the same field graph.metadata.interval.start_time and with the exact same time range.

For example:

When applying a Dashboard filter with a past 3-month time range, the panel shows FILE count = 9018.


When applying the same time range directly as a Panel filter, the same panel shows FILE count = 9020.


This results in a mismatch of counts between Dashboard-level filters and Panel-level filters.

Could you please help us understand why this mismatch is happening and whether this is a known limitation or an expected behavior?


Hi ​@cmorris Do you have any idea regarding this behaviour? Thanks in advance.


Okay so I have some entity data in the UDM Dashboard and I am observing a count mismatch between the Dashboard time filter and the Panel time filter, even though both are works on the same field graph.metadata.interval.start_time and with the exact same time range.

For example:

When applying a Dashboard filter with a past 3-month time range, the panel shows FILE count = 9018.


When applying the same time range directly as a Panel filter, the same panel shows FILE count = 9020.


This results in a mismatch of counts between Dashboard-level filters and Panel-level filters.

Could you please help us understand why this mismatch is happening and whether this is a known limitation or an expected behavior?


My guess (due to it being close now) would be that the panel filter is using a relative time frame and the dashboard filter is using an absolute time frame - so not a direct match. I would try updating the panel filter and seeing if that results in 1:1.


Hi ​@cmorris Thanks for your response. So have you tried out updating time frame and did you get any results? 

My guess (due to it being close now) would be that the panel filter is using a relative time frame and the dashboard filter is using an absolute time frame - so not a direct match. I would try updating the panel filter and seeing if that results in 1:1.


Thank you all for the discussion and insights regarding native dashboard behavior in Google SecOps. Based on our observations and forum discussions:

  1. Additional Field Filters:
    • Using graph.additional.fields["key"] as a global filter on dashboards is currently not fully supported and has been logged as a bug (tracked as 436187577).
       
  2. Time Range Filters:
    • The UDM Search time filter on graph.metadata.interval.start_time works correctly.
    • Dashboard-level filters on the same field can behave differently due to differences between absolute and relative time ranges, which may result in count mismatches between panel-level and dashboard-level filters.
    • Drill-down queries currently inherit the saved query time range, not the global dashboard filter. There is no native mechanism to make drill-downs automatically respect the dashboard/global filter range.