Usually running a raw log search (like you were doing) for a key term from your log is going to be the quickest way to confirm a log source is being ingested. You can also see log volumes (but not log contents) in the GCO console under metrics explorer https://console.cloud.google.com/monitoring/metrics-explorer using the metric 'Chronicle Collector - Total Ingested Log Count' and aggregation by collector_id or log_type to see if you have any traffic of the type you expect from that collector.
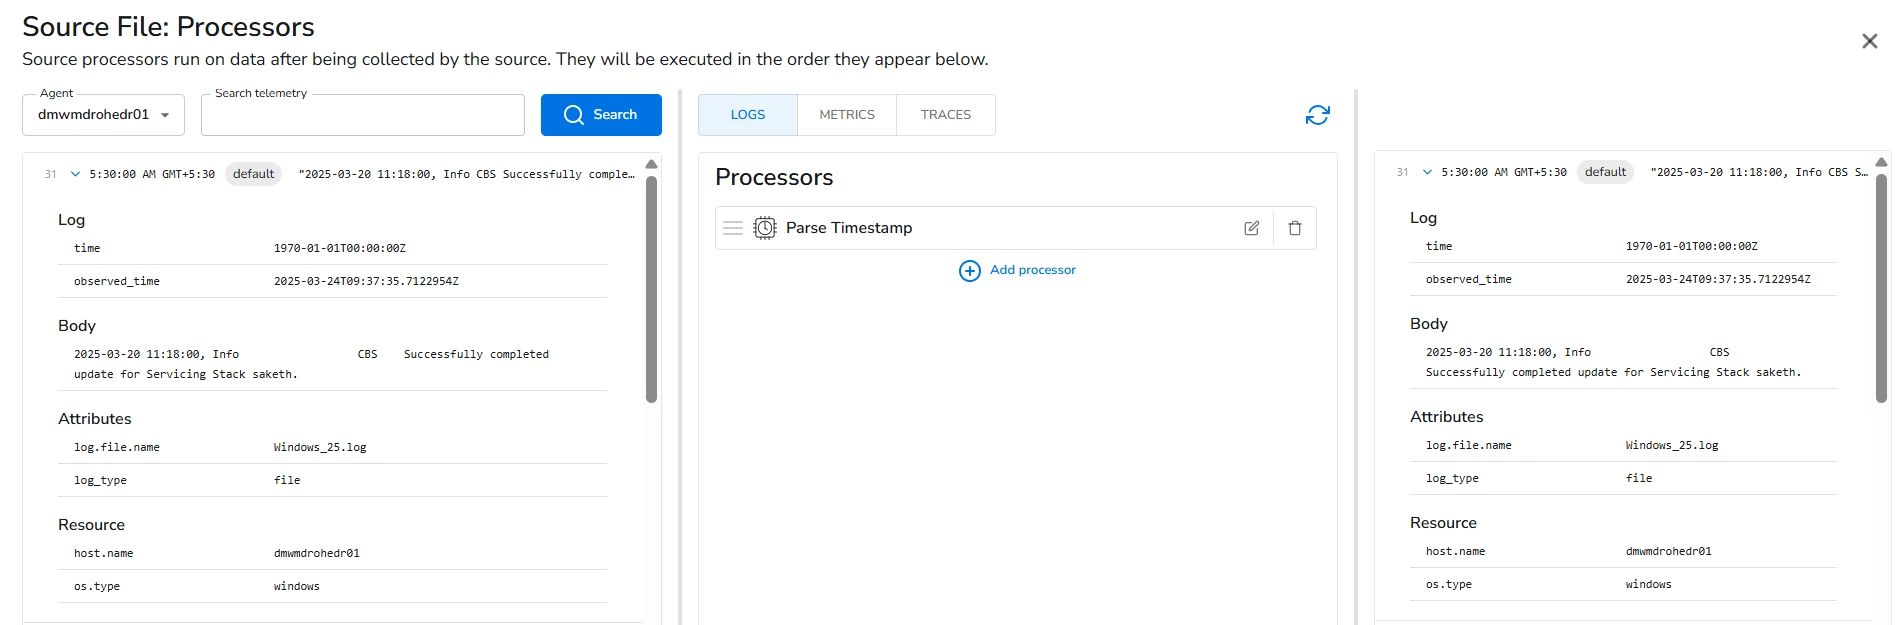
Looking at your example log there's a gap between the log creation time and when bindplane observed it, (which would then impact when SecOps ingests it), the behavior of the time selector in raw log search may be impacted by this. For unparsed logs they'll show up in the console with the time the event was ingested, but if SecOps parses the event properly it will use the event time from the log, so in your case you may want to expand your search range to cover 11:18 on 3/20.
The timestamp that bindplane parses should not directly be causing the issues since SecOps will use the ingest timestamp and its own parser for the event timestamp.
If you don't find the log in SecOps you should check the collector.log (linux: /opt/observiq-otel-collector/log/collector.log, windows: c:\\program files\\observIQ OpenTelemetry Collector\\log\\collector.log) for error messages and proceed from there.