
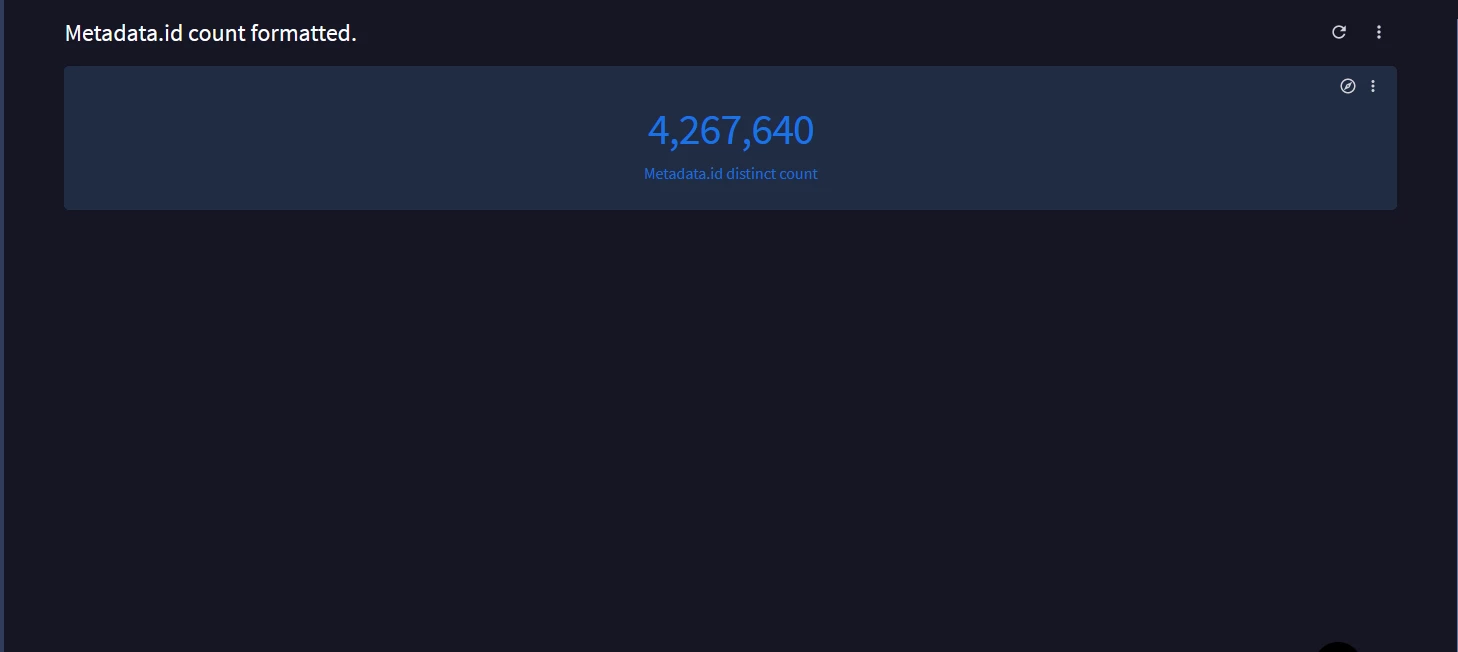
Hello, I am currently struggling with the native dashboard. I want to know if there’s a way to format the metrics with commas for easier reading, such as 12,000,000 instead of 12000000. This would make it easier to read the counts.

Hi @Omskirt 

Is the below what you're trying to achieve?

Please review the below, a yaml export. To import this, save this onto your device. Within your Chronicle instance, go to 'Dashboards' -> 'Import Dashboards' -> Find the file and import the YAML code.

lookml: - dashboard: metadata_id_count_formatted_ description: "" elements: - col: 0 column_limit: 50 comparison_reverse_colors: false comparison_type: value conditional_formatting: - background_color: '#1A73E8' bold: false color_application: collection_id: 7c56cc21-66e4-41c9-81ce-a60e1c3967b2 palette_id: 56d0c358-10a0-4fd6-aa0b-b117bef527ab fields: null font_color: null italic: false strikethrough: false type: along a scale... value: null conditional_formatting_include_nulls: false conditional_formatting_include_totals: false custom_color: '#1A73E8' custom_color_enabled: true defaults_version: 1 dynamic_fields: - _kind_hint: measure _type_hint: number based_on: events.metadata__id category: measure expression: null label: Metadata.id Distinct Count Measure measure: metadataid_distinct_count_measure type: count_distinct value_format: null value_format_name: decimal_0 enable_conditional_formatting: true explore: events_connector fields: - metadataid_distinct_count_measure filters: events.time_filter: 24 hours header_font_size: "12" header_text_alignment: left height: 3 hidden_pivots: {} hide_row_totals: false hide_totals: false limit: 500 limit_displayed_rows: false minimum_column_width: 75 model: scn name: Untitled row: 0 rows_font_size: "12" show_comparison: false show_comparison_label: true show_row_numbers: true show_row_totals: true show_single_value_title: true show_sql_query_menu_options: false show_totals: true show_view_names: false single_value_title: Metadata.id distinct count size_to_fit: true table_theme: white title: Untitled transpose: false truncate_header: false truncate_text: true type: single_value width: 24 layout: newspaper title: Metadata.id count formatted. metadata: exported_at: "2024-10-05T08:46:33-07:00" file_fingerprint: "126049239974212912659754849880101616040" looker_version: 24.12.51 version: "1"


Kind Regards,

Ayman C


Yes, that’s what I’m trying to achieve. Is there any way I can format the metrics with commas in the native dashboard? I'm struggling to do this with the metadata ID count, but I want to do it in the native dashboard, not in Looker. Thanks 


I would suggest you redirect this question back to your account team if they provided you access to this feature as it is not public preview or generally available, the community is not a great place to ask those questions or request improvements.


Yes, that’s what I’m trying to achieve. Is there any way I can format the metrics with commas in the native dashboard? I'm struggling to do this with the metadata ID count, but I want to do it in the native dashboard, not in Looker. Thanks 


Apologies I misinterpreted what Dashboard type you were referring to. I didn’t manage to find a solution using the preview dashboard type. I don’t think this is something possible at the moment.


I would suggest you redirect this question back to your account team if they provided you access to this feature as it is not public preview or generally available, the community is not a great place to ask those questions or request improvements.


Alright noted on this. Thank you so much