
Hey everyone,

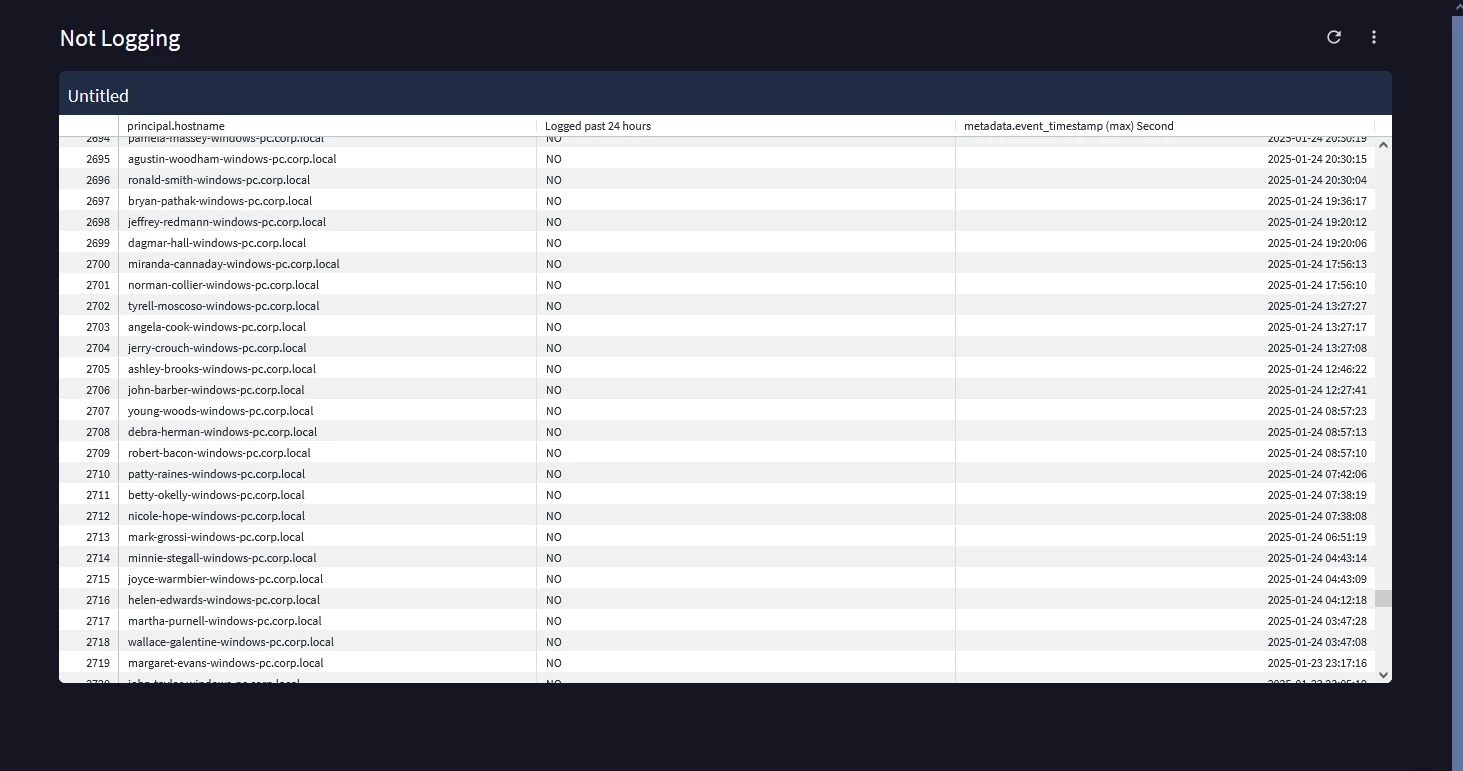
I'm trying to set up an alert in Google SecOps to notify us if a specific device stops sending logs. We want to monitor individual endpoints and get an alert if they stop reporting for a defined period (e.g., 24 hours).

Does anyone know the best way and how to configure this? 

Appreciate any insights or best practices!

Thanks!

Hi,

It's possible to utilise a dashboard, showing the hostname, and max event timestamp, and then for a scheduled email (so not a direct ALERT within the SIEM) to be sent to a specific mailbox showing all hosts are down. You can then integrate your mailbox with a SOAR solution to perform the necessary steps. Below is a simple YAML dashboard, which is for all principal. hostnames, returns the max event timestamp for that host, and if it is greater than 86400 seconds from now, only output those results in the table. You can then utilise the following post - Extracting & Scheduling (Email) -> 99,999 or 5mb o... - Google Cloud Community, which will allow you to monitor for at least 99,999 hosts that may be down, and advanced scheduling capabilities, like only sending an email if there are results, sending the data in multiple formats etc.

lookml: - dashboard: not_logging description: "" elements: - col: 0 column_limit: 50 conditional_formatting_include_nulls: false conditional_formatting_include_totals: false defaults_version: 1 dynamic_fields: - _kind_hint: dimension _type_hint: string category: dimension dimension: logged_past_24_hours expression: if(diff_seconds(${events.metadata__event_timestamp_raw}, now()) > 86400, "NO", "YES") label: Logged past 24 hours value_format: null value_format_name: null enable_conditional_formatting: false explore: events_connector fields: - events.principal__hostname - events.metadata__event_timestamp_max_second - logged_past_24_hours filters: events.time_filter: "" logged_past_24_hours: "NO" header_font_size: 12 header_text_alignment: left height: 12 hidden_pivots: {} hide_row_totals: false hide_totals: false limit: 5000 limit_displayed_rows: false model: scn name: Untitled row: 0 rows_font_size: 12 show_row_numbers: true show_view_names: false size_to_fit: true sorts: - events.metadata__event_timestamp_max_second desc 0 table_theme: white title: Untitled transpose: false truncate_text: true type: looker_grid width: 24 layout: newspaper title: Not Logging metadata: exported_at: "2025-02-11T03:05:49-08:00" file_fingerprint: "1165380805301742877411421594455121855579" looker_version: 24.18.128 version: "1"


Alternatively, if you have both the Chronicle SIEM and SOAR capabilities, you can create a playbook, that has a rule (that matches on each hostname over a 24 hour period) that utilises a reference list full of hostnames, using the detection engine (retrohunt) endpoint to run a retrohunt, list all of the hosts that are logging, and then compare the contents of the reference list, to the list of  hosts that are logging, and then you can identify hosts that haven't been logging, you can then setup a scheduled connector to generate a case, attach this playbook at the specified interval.

Kind Regards,

Ayman


What if I want it to notify me whenever the logs stopped from a specific log source only?
Suppose the combination of (metadata.product_name and principal.ip or maybe some additional field) ? 
Is that possible?

@AymanC 


What if I want it to notify me whenever the logs stopped from a specific log source only?
Suppose the combination of (metadata.product_name and principal.ip or maybe some additional field) ? 
Is that possible?

@AymanC 


Hi @anurag.q.singh,


You would likely add a filter using the “metadata.log_type” UDM field, and set the value to the log type you only want filtered on.


Kind regards,

Ayman


Can you guide me through it?
Suppose I want it to be on the basis of Vendor : CHECKPOINT,  product_name : FIREWALL and an additional field additional.field[add] : 192.168.1.10

@AymanC