Question

How to verify log data ingested from BindPlane into Google SecOps (Chronicle)?

  • September 9, 2026
  • 1 reply
  • 17 views

Denny Dai

Hi everyone,

I am currently setting up a test environment to collect logs from a Linux host using BindPlane, following the official quick start guide: Google SecOps with BindPlane Quick Start

My configurations on BindPlane appear to match the recommended setup, and the agent status looks consistent. However, I am stuck on the verification step:

  1. Data Visibility: I cannot see the ingested data in Google SecOps (Chronicle).

  2. Verification Process: To be precise, I’m not sure how or where to properly verify if the logs are actually reaching Google SecOps, or if they are getting stuck somewhere in the pipeline (e.g., BindPlane collector, Google SecOps ingestion API, or UDM mapping).

Are there recommended troubleshooting steps, CLI tools, or specific queries in Google SecOps to verify that data is flowing correctly? Any guidance on how to inspect and validate this setup would be greatly appreciated!

Thanks in advance!


1 reply

MitchellR
Forum|alt.badge.img+2
  • Bronze 1
  • September 9, 2026

Hey ​@Denny Dai - 

Not sure which of these you may have tried, so let me walk you through my troubleshooting process in a scenario like this and hopefully it helps / gives you more details to share and I can pose some follow-ups:

  1. Are we certain the Bindplane collector itself is reading the intended logs? 
    1. This can be checked either on the host where the collector is running (look at the Otel log records themselves), or even more simply in the Bindplane management UI, if you click on the collector, do you see any telemetry flowing (ensure the Source itself is getting the log source(s) you expect to see, ensure the Processor(s) aren’t dropping it inadvertently, and ensure the Destination is actually getting and sending the logs to SecOps)
  2. Are the BP agent’s logs indicative of an API issue? 
    1. Not sure how the collector is deployed, but say it’s a Unix-based system, you can check the journalctl logs for the observiq process and grep for common error codes like “error” or “fail” or “permission” or associated codes like 400, 401, 403, 429, etc.
    2. You’d get 401/403 from the ingestion endpoint if the authentication is wrong on the Destination, 400 if the metadata around the logs being sent isn’t right (e.g. customer ID, ingestion label), TLS timeouts if maybe firewall rules are blocking egress to your appropriate ingestion endpoint…
  3. Does your auth and network work independent of the BP agent? 
    1. ​​​​​​​Depending on some of the above troubleshooting, you could curl to the ingestion endpoint directly and see what it tosses back for status code. 
  4. Does Cloud Monitoring show any ingestion metrics?
    1. In bring-your-own-project’s Cloud Monitoring’s Metrics Explorer, what do the ingestion/log/log_count/etc filters show? Depending on if you have other data coming into this tenant, you could filter further to make specific to your Bindplane ingestion path, if log_type isn’t a nuanced enough layer to start. Non-zero here would mean SecOps at least accepted the data, so BP is fine and your problem is on the parsing or search side. 
  5. Do the logs show up as raw in SecOps? 
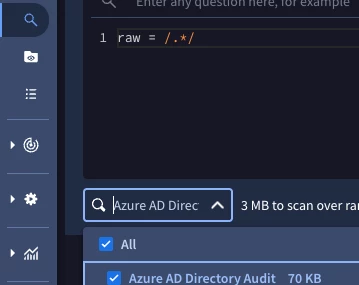
    1. ​​​​​​​In SIEM search, if you do a search like this, do you get the log types you expect in the dropdown? If you do and they’re just raw with no UDM component, then there’s a data format mismatch of some sort resulting in ingestion but the parser is dropping them, e.g. no UDM output. 
    2. If you don’t get the log types you expect even, you can try searching for a string you know is in some of the raw logs (could grab an example from inside the BP view into the raw logs) and search it to see where it’s getting stored in SIEM, if at all. 

  6. Are we timetravelers? 

    1. ​​​​​​​A bit tongue-in-cheek, but timestamps are a common issue that can bite here. Depending on how the timestamp itself is stored, how the BP agent is picking up the log files (direct from host, over the network, etc), and how it’s shipping them, the timestamps could be getting replayed/changed or even they could be missing/wrong. In this case, SecOps will still store them, and correctly to boot assuming the timestamp exists/is formatted. However, SIEM search looks at event time, so if you’re searching for “the last hour” or “the last week” but the timestamps are putting it a month in the past or even worse a month in the future… then congrats, you’re a time traveler! 

Very small add-ons / checkboxes I assume you’ve already checked:

  • Is the endpoint in the destination in BP the right region that matches the region of your SecOps instance? 
  • Are you accounting for a minor ingestion delay (e.g. 5-15 minutes) in your search time windows? 

Let me know what you find with these / if you have any questions and happy to help chase this to ground.