
Hi everyone,

I'm working on creating dashboards in SecOps Preview Dashboards and encountering an issue with line and area charts.

When I create a query and run it, the line or area chart displays data correctly. However, after saving the panel to the dashboard, the chart no longer populates any data.

  • Screenshot in edit mode (data visible)
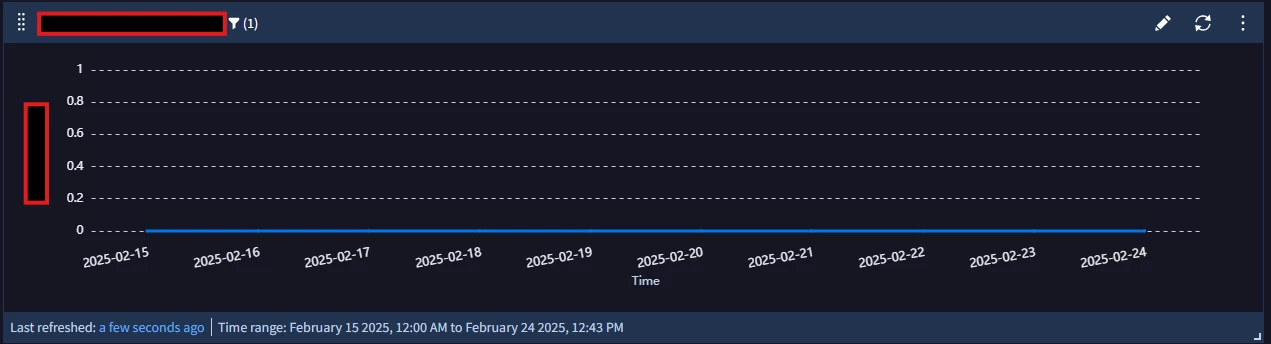
  • Screenshot after saving to the dashboard (no data displayed)


Has anyone experienced this issue before? Is there a known solution or any workaround for this?

Thanks in advance for your help!

Regards,
Prashant Nakum

Can you confirm there is not a dashboard level filter that may be filtering out the results once saved?


Can you confirm there is not a dashboard level filter that may be filtering out the results once saved?


Thank you for your quick response. I have verified that there are no dashboard-level filters applied to the panel, except for the global time range filter, which is applied at both the dashboard and panel levels.

When I click 'View as Table' on the line or area chart, the data is displayed correctly in table format. However, the data does not appear in the line or area chart visualization itself.

Could you please advise on what might be causing this issue?


Reply