
Hi everyone,

I am working on creating dashboards in Google SecOps Native Dashboards and encountered an issue while configuring a pie chart.

Here’s my query:


metadata.product_event_type="ABC"
match:
target.port
outcome:
$count=count_distinct(metadata.id)
order:
$count desc
limit:
15


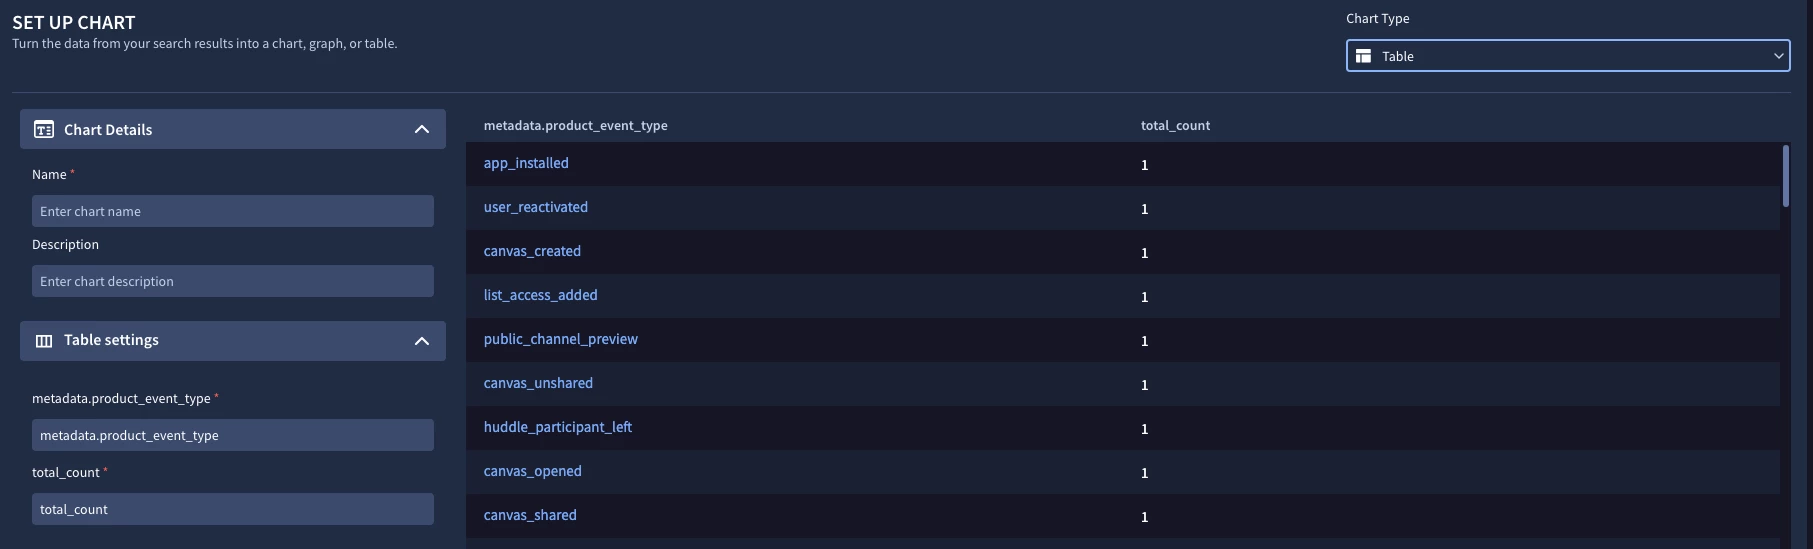
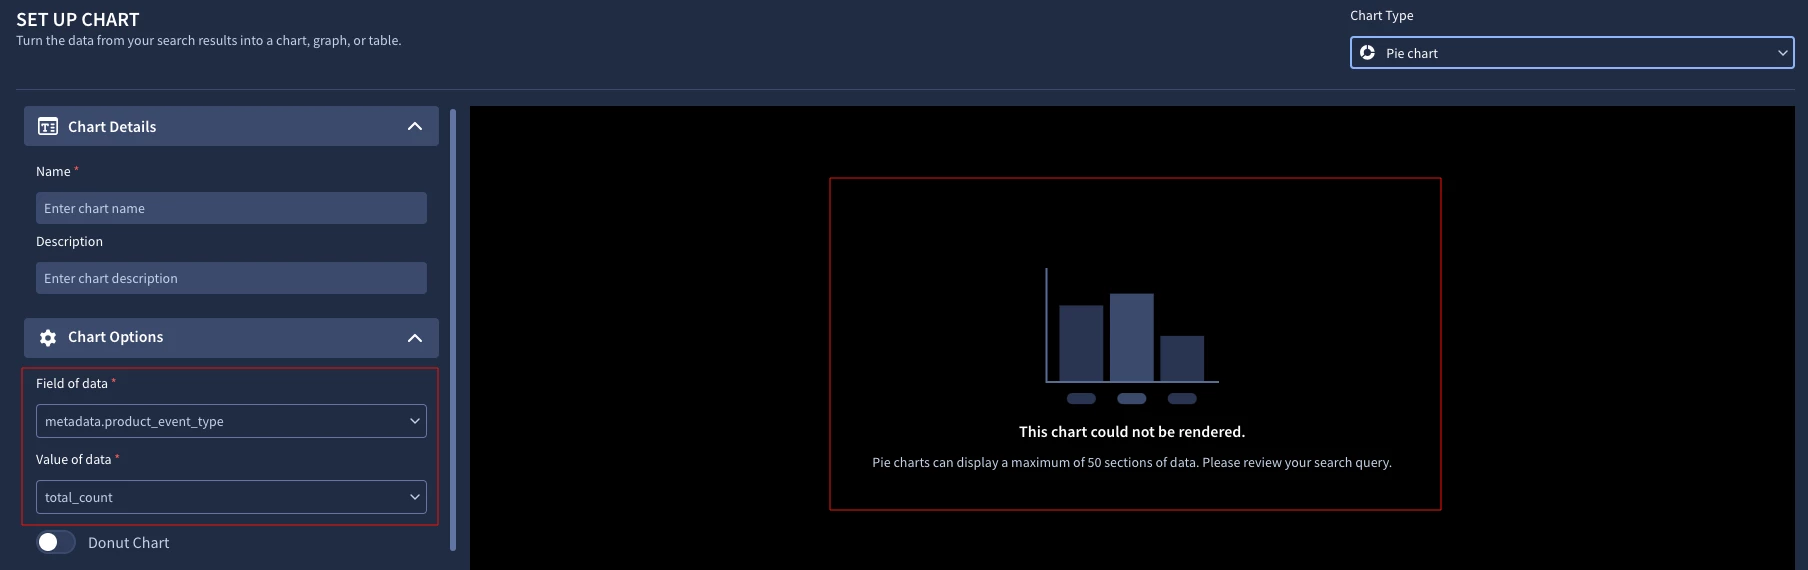
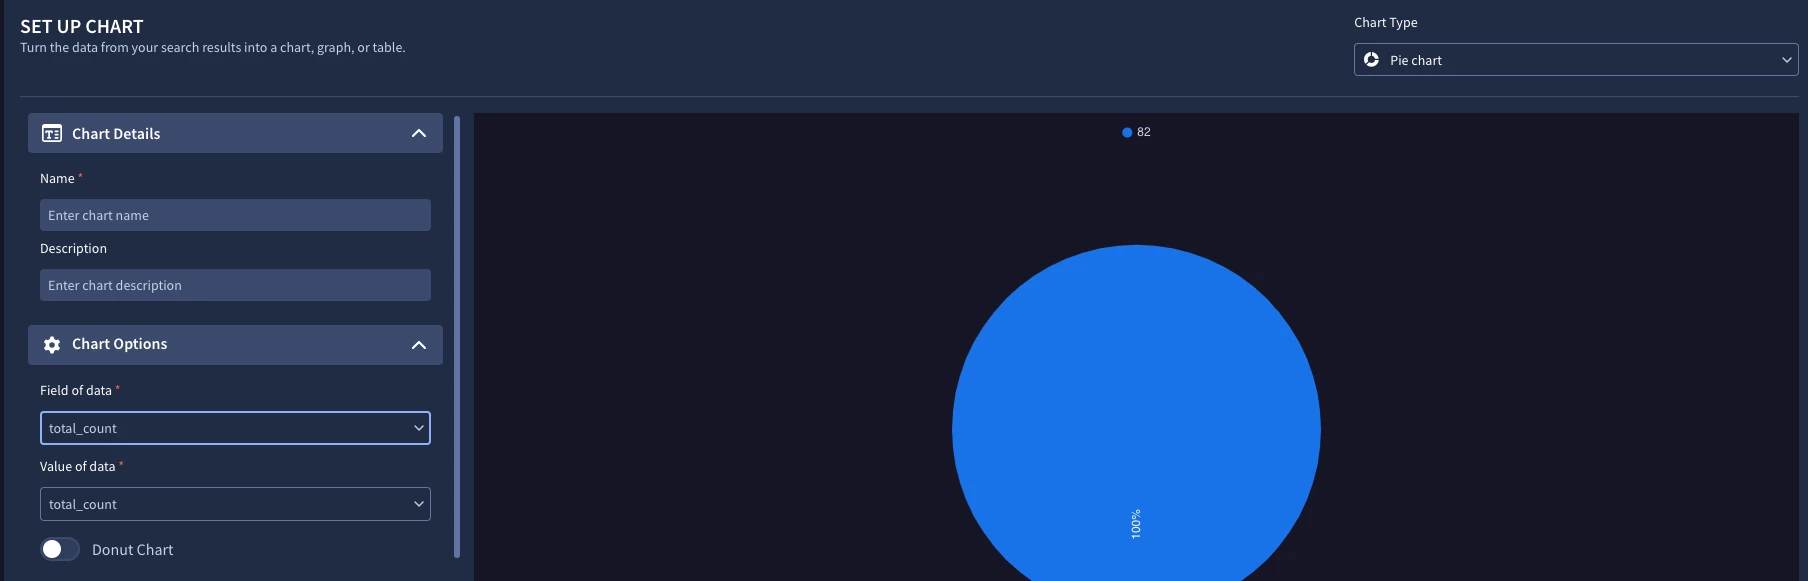
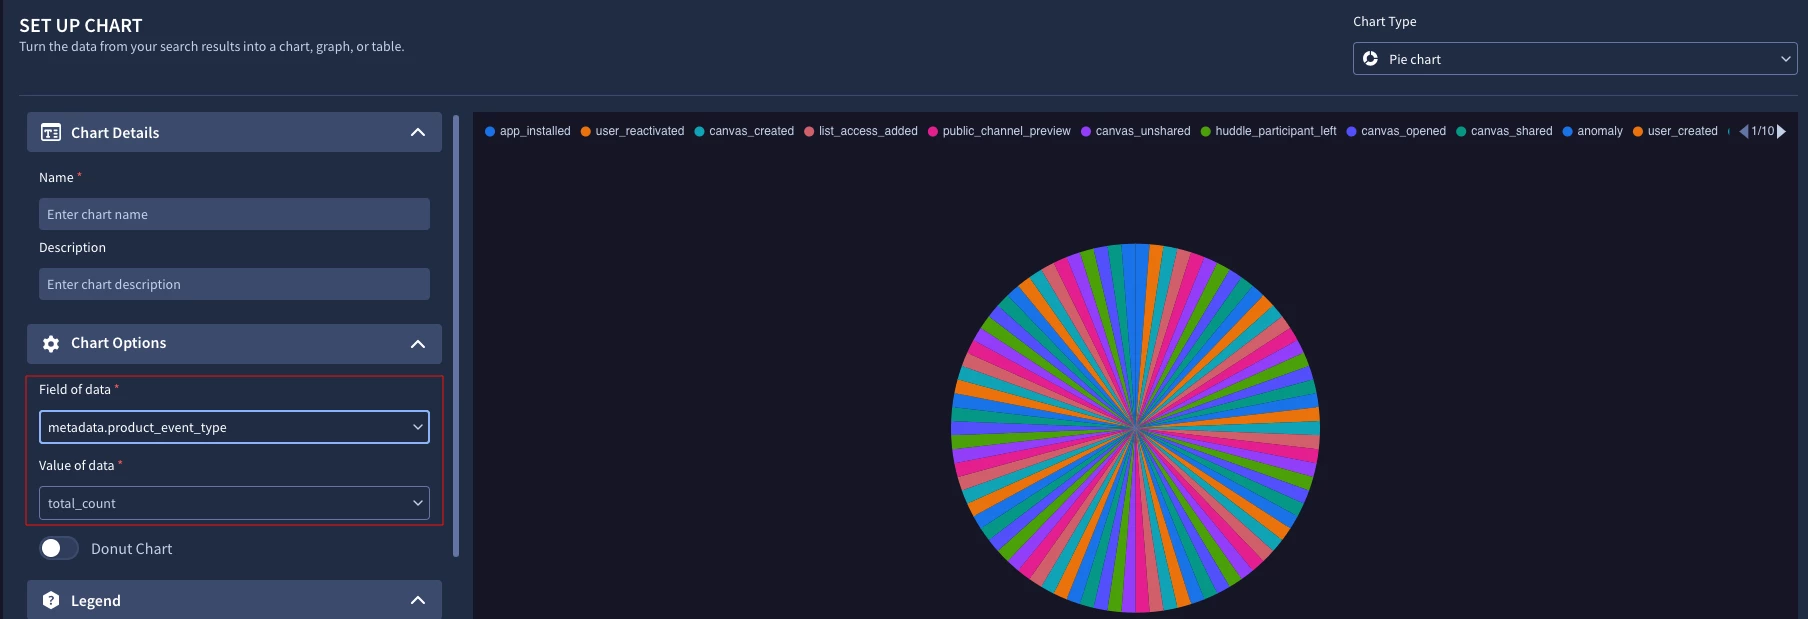
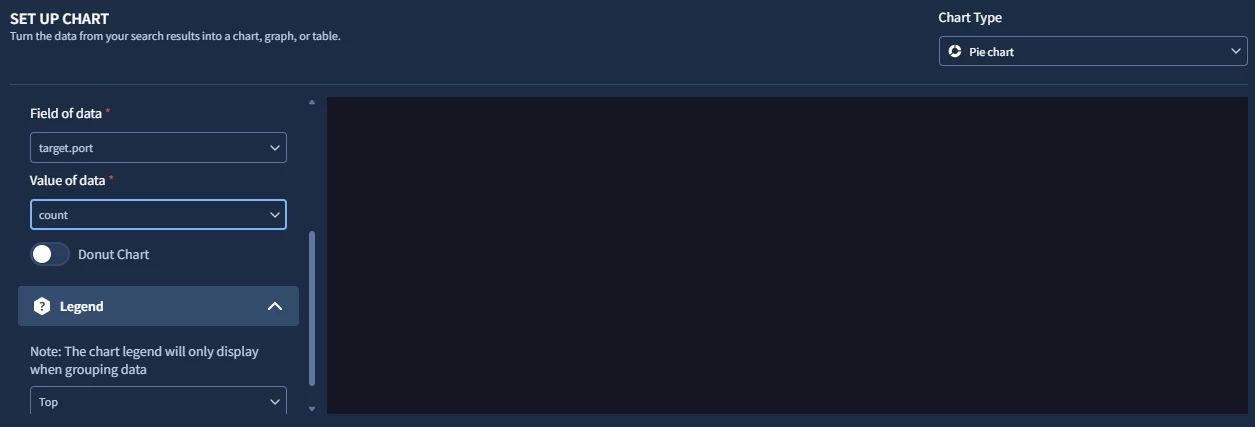
When I configure the pie chart, I set the Field of Data as target.port and Value of Data as count, but the visualization appears empty, as shown in the attached screenshot.

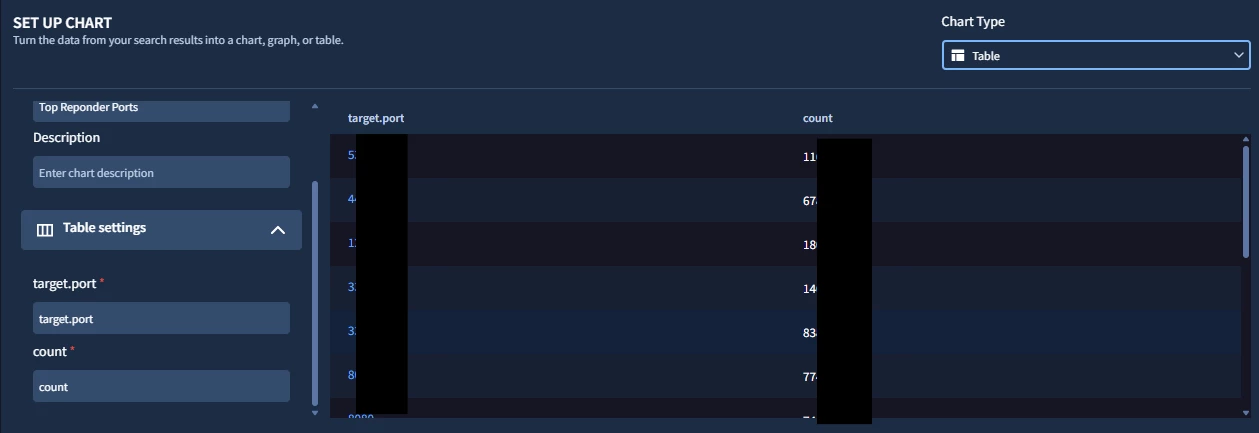
However, when I switch to a table chart with the same query, all the data is displayed correctly.

Why is this happening with the pie chart? Is there a solution or an alternative approach to achieve this?

Thanks,
Prashant Nakum

Hi @prashant_nakum,

I think it may be a bug with initiating the pie chart but you should be able to work around it by changing the Field of Data to the total_count and then back again. 

As an example, I created a similar query to yours:

metadata.vendor_name = "Slack"
match:
metadata.product_event_type
outcome:
$total_count = count_distinct(metadata.product_event_type)
order:
$total_count desc

Table View:

Initial Pie chart view:

To work around this, first change the "Field of Data" to the total_count:

From there, change it back to your expected Field of data:

Hope this helps! I would recommend opening a support ticket with Google support for this issue. 


Thanks for your quick response.

I tried following your suggested approach, but the pie chart is still not populating in my case.

If there are any other solutions or alternative approaches, I would greatly appreciate your suggestions.

Regards,
Prashant Nakum


Thanks for your quick response.

I tried following your suggested approach, but the pie chart is still not populating in my case.

If there are any other solutions or alternative approaches, I would greatly appreciate your suggestions.

Regards,
Prashant Nakum


I recommend testing out whether the other chart styles work and opening a case with the support team. 


To @_K_O point, the guidance provided around creating a pie chart is right on, the usual gotcha is the limit 50 so if you followed the above and are still having issues, I would open a case. In fact as I did a quick test on it, the initial rendering of the pie chart seemed to work but if I made changes to those drop downs, the pie chart disappeared, so definitely open a case on it.


Reply