

We're facing some difficulties building a graph in Google Cloud Monitoring (Metrics Explorer) to visualize ingestion metrics from Google SecOps:
Specifically, we need to create time series graphs that show:
-
The total amount of ingested GB over time
-
The total ingested GB per log source over time
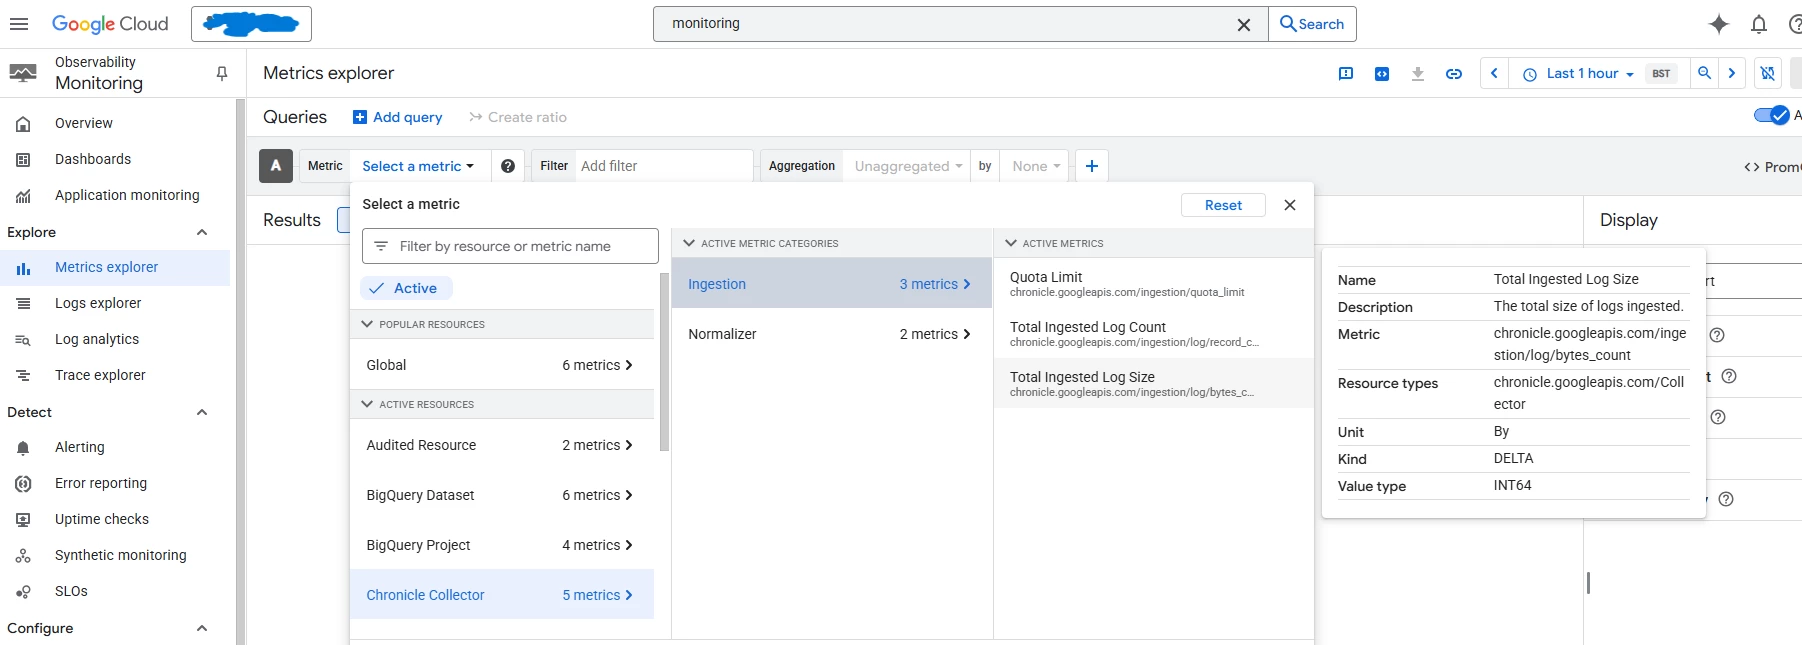
We’ve confirmed that the Google SecOps integration is already set up in Cloud Monitoring and appears to be providing useful data. However, what we’re seeing in the graphs doesn’t match the ingestion values shown in Google SecOps or Bindplane dashboards.
For example:
-
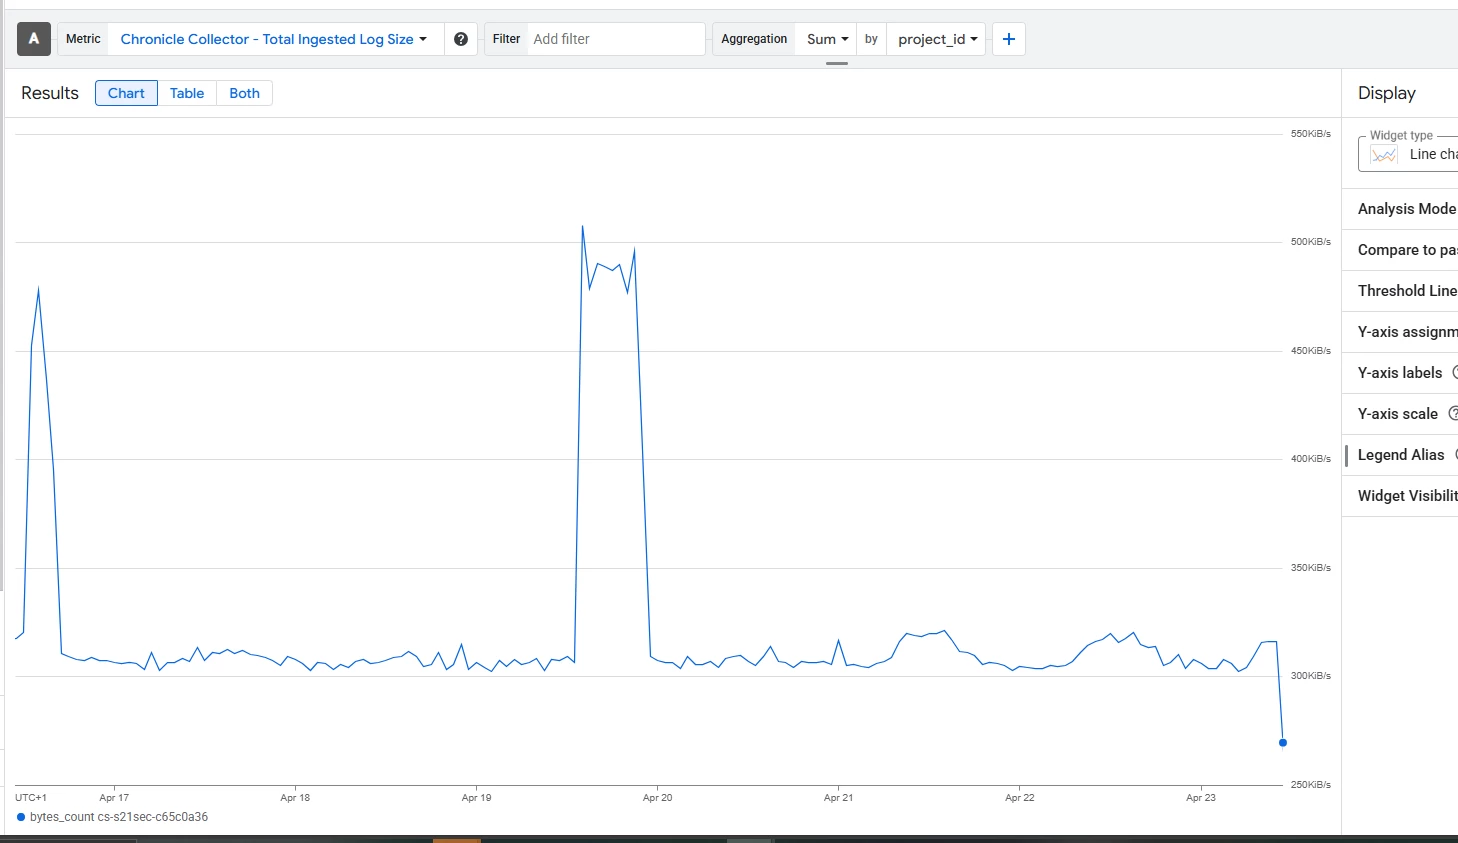
Google Cloud Monitoring shows only a few KBs
-
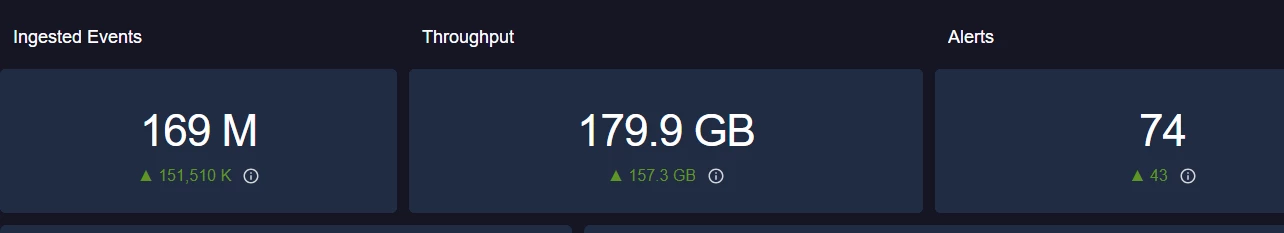
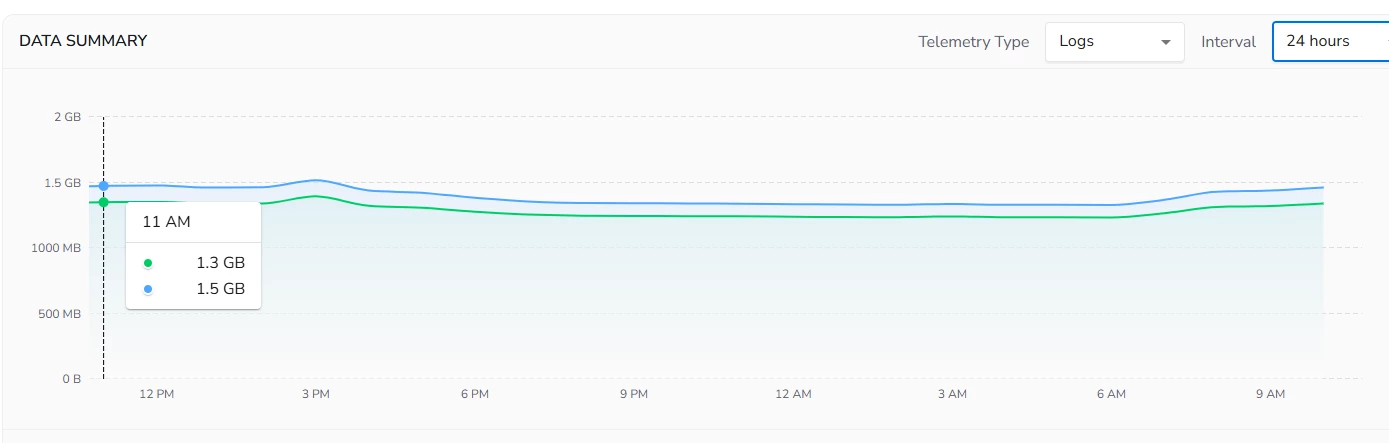
While Google SecOps and Bindplane reflect ingestion in the GB range
Google Cloud Monitoring
Google Secops
Bindplane
We're trying to understand this discrepancy.
We noticed that the Total Ingested Log Size metric is of the "Delta" kind. From our understanding, delta metrics reflect only the change in value over time, rather than a cumulative total.
Is there a way to convert this into a raw value or cumulative total to better reflect actual ingestion volumes?
Is there a way to convert this into a raw value or cumulative total to better reflect actual ingestion volumes?
Additionally, we’d like to know if it's possible to customize the graphs based on specific time intervals. For instance:
-
At 23/04/2024 10:41 UTC we had 12GB being ingested
-
At 23/04/2024 10:42 UTC we had 13GB being ingested
-
At 23/04/2024 10:43 UTC we had 15GB being ingested
-
At 23/04/2024 10:44 UTC we had 9GB being ingested
-
At 23/04/2024 10:45 UTC we had 8GB being ingested
If we select a 5-minute interval, we’d expect the graph to display a data point reflecting the mean over that interval (in this case, 11.4GB). Is that achievable?
Could you help us understand the correct approach to build this type of graph?
Are we possibly missing a configuration step, or could this be related to permissions?
Are we possibly missing a configuration step, or could this be related to permissions?
Thanks in advance.

