We are experiencing a significant delay between alert ingestion into Google SecOps (Chronicle SOAR) and the subsequent creation of a case. Our goal is to have a case created almost immediately when the first alert for a potential incident is ingested, provided a relevant case doesn't already exist. 

Additionally, we are facing an issue with our playbook automation. Our current setup executes a playbook after a case is created in Google SecOps. This playbook is designed to create a ticket in our external SOC ticketing system. However, when subsequent related alerts are ingested into the same Google SecOps case, the playbook seems to re-trigger (or a similar process does), resulting in multiple tickets being created in our SOC ticketing system for what is essentially the same underlying incident. This creates unnecessary noise and administrative overhead for our SOC team.

We have attempted to use alert grouping with a 1-hour window and a maximum of 3 alerts, but this configuration has not resolved either the initial case creation delay or the duplicate SOC ticket issue.

Could you please provide guidance on the following:

  1. Minimizing Case Creation Delay: What configurations or best practices can we implement to ensure that a case is created in Google SecOps as soon as the first relevant alert is ingested?
  2. Preventing Duplicate SOC Tickets: How can we configure our Google SecOps cases and/or playbooks to ensure that only one ticket is created in our external SOC ticketing system when the first alert triggers case creation, and that subsequent alerts ingested into that same Google SecOps case do not generate new tickets in the external system? We need the playbook to recognize that a ticket for that SecOps case already exists.

 

Hey @kaushalpatel ,


1. What is the general volume of alerts you are getting per day? The ETL is responsible for the creation of the Alert + Case and generally speaking, there shouldn't be any noticeable delays there. Can you share what connectors you are working with?


2. I would suggest to create playbooks in a way that the ticket is created per case. You can achieve by forcing the platform to process playbooks in the sequential order via Tools action "Lock Playbook". This action will not allow other playbooks to move forward until the current one will finish execution. Then you can add a tag to a case like "Ticket Created", so you can make a condition that will check, if there is this tag before trying to create another ticket.


Hello @ylandovskyy 

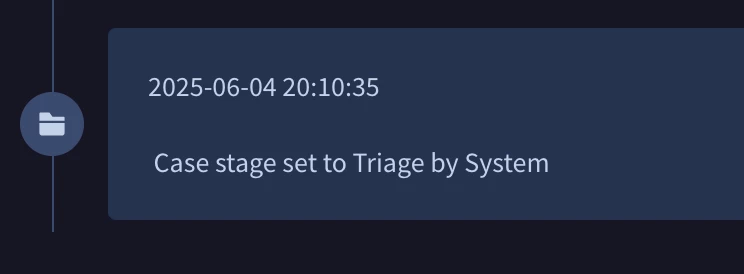
1. its very new tenant and only getting around 50 alerts per day from chronicle connector. As an example ,  Alert time is 18.30 UTC vs Case stage time is 20.10  Which is almost 1 hr 40 min delay. and its happening for all alerts.

2. tagging is good idea for tickets, i can skip with condition


@kaushalpatel can you share the configuration of connector? Also, you are on the latest version of the integration, right?


@kaushalpatel can you share the configuration of connector? Also, you are on the latest version of the integration, right?


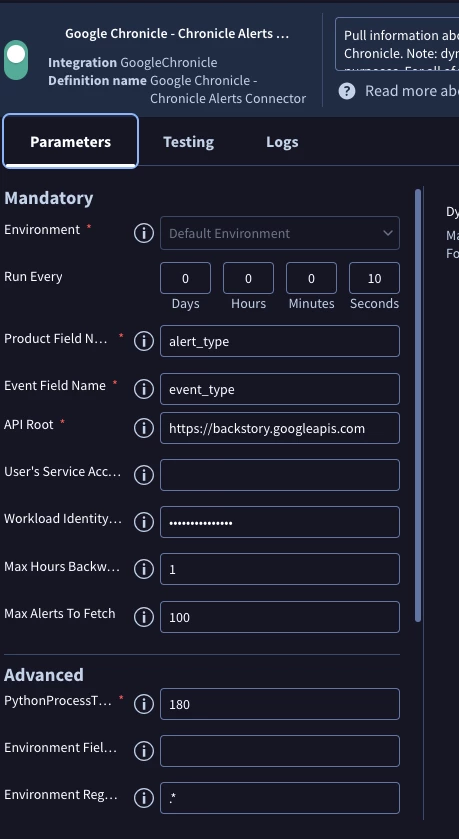
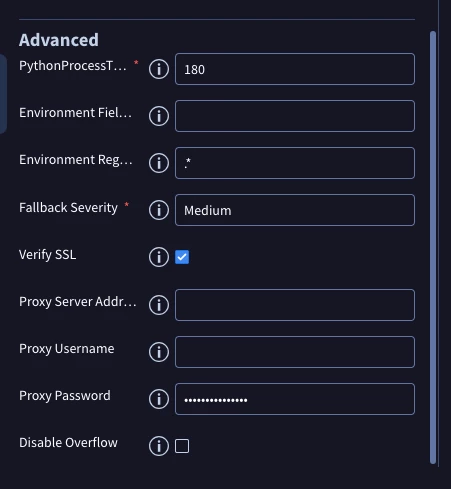
@ylandovskyy Attached screenshots for connector , its just regular config


@ylandovskyy Attached screenshots for connector , its just regular config


@kaushalpatel in the events associated to the detection, can you check what is the detection time?

It will be available in the Events tab inside the Case Management of the Alert.


@kaushalpatel in the events associated to the detection, can you check what is the detection time?

It will be available in the Events tab inside the Case Management of the Alert.


@ylandovskyy Event Detection time is the same
screenshot for previous attached alert 


Reply