

Risk Analytics is a crucial feature within Google SecOps SIEM designed to help security teams identify unusual behavior and quantify the potential risk that various entities pose to the enterprise. It empowers analysts to move beyond basic alert triage and focus on the entities that represent the most significant threat.
Key Components of the Risk Analytics Dashboard
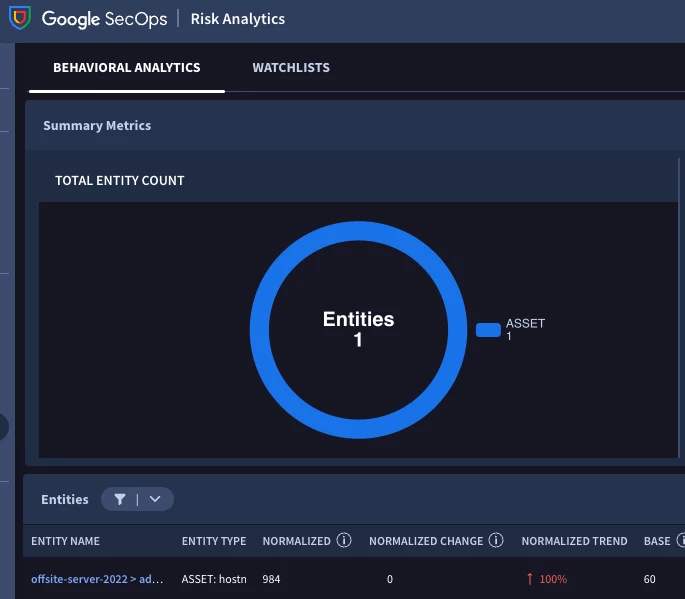
The central hub for this feature is the Risk Analytics dashboard, which provides a holistic view of entity risks, accessible to users with global scope in RBAC systems.
-
Behavioral Analytics: This section lists entities (such as user accounts, servers, or laptops) based on their calculated Google Security Operations Entities risk scores. This allows tracking an entity's risk over time and serves as a metric for detection use cases.
-
Watchlist: This section highlights entities based on internal enterprise risk calculations, complementing the behavioral analysis with organization-specific context.
-
Risk Calculation Window: A critical setting that defines the timeframe for risk score calculation. Adjusting this window (e.g., 24 Hours for quick attacks like brute force, or 7 days for long-term activity) helps uncover different attack types. Historical risk scores can also be viewed by selecting a specific date.
Understanding Entities and Risk Scores
The core of Risk Analytics revolves around entities and their associated risk scores.
-
Entities: These are contextual representations of assets or users in your environment (e.g., user accounts, servers, phones). All related events provide context about the entity's risk level. Drilling down on an entity leads to the Entity Analytics page.
-
Risk Scores: Entity risk scores are calculated based on the risk scores of findings (alerts and detections). Key score concepts include:
-
Base Score: Calculated by summing the risk scores of all findings for an entity within the risk window, with a configurable weighting applied.
-
Normalized Score: The base scores are normalized to a range of 1–1000 to allow for easy comparison across all scored entities.
-
The following are the formulas used for calculating the risk score and normalized risk score:
-
Risk score calculation: (Base entity risk score) = (Maximum risk score for the finding) + (Weighting * (Sum of the remaining risk scores for the findings))
-
Normalized risk score: Base entity risk scores are normalized across all entities. The base entity risk score uses min-max normalization and ranges from 1-1000. Entities with zero risk are not included.
Deeper Investigation: Entity Analytics
The Entity Analytics page provides a deep dive into an individual entity's risk history.
-
Event Range: Allows selecting a time range (up to 90 days) to analyze the entity's risk.
-
Findings Timeline & Table: Displays all related detections and alerts for the selected time range.
-
Composite Detections: The table clearly identifies alerts triggered by a chain of other detections, rather than just raw events, which indicates a more complex and potentially significant threat.
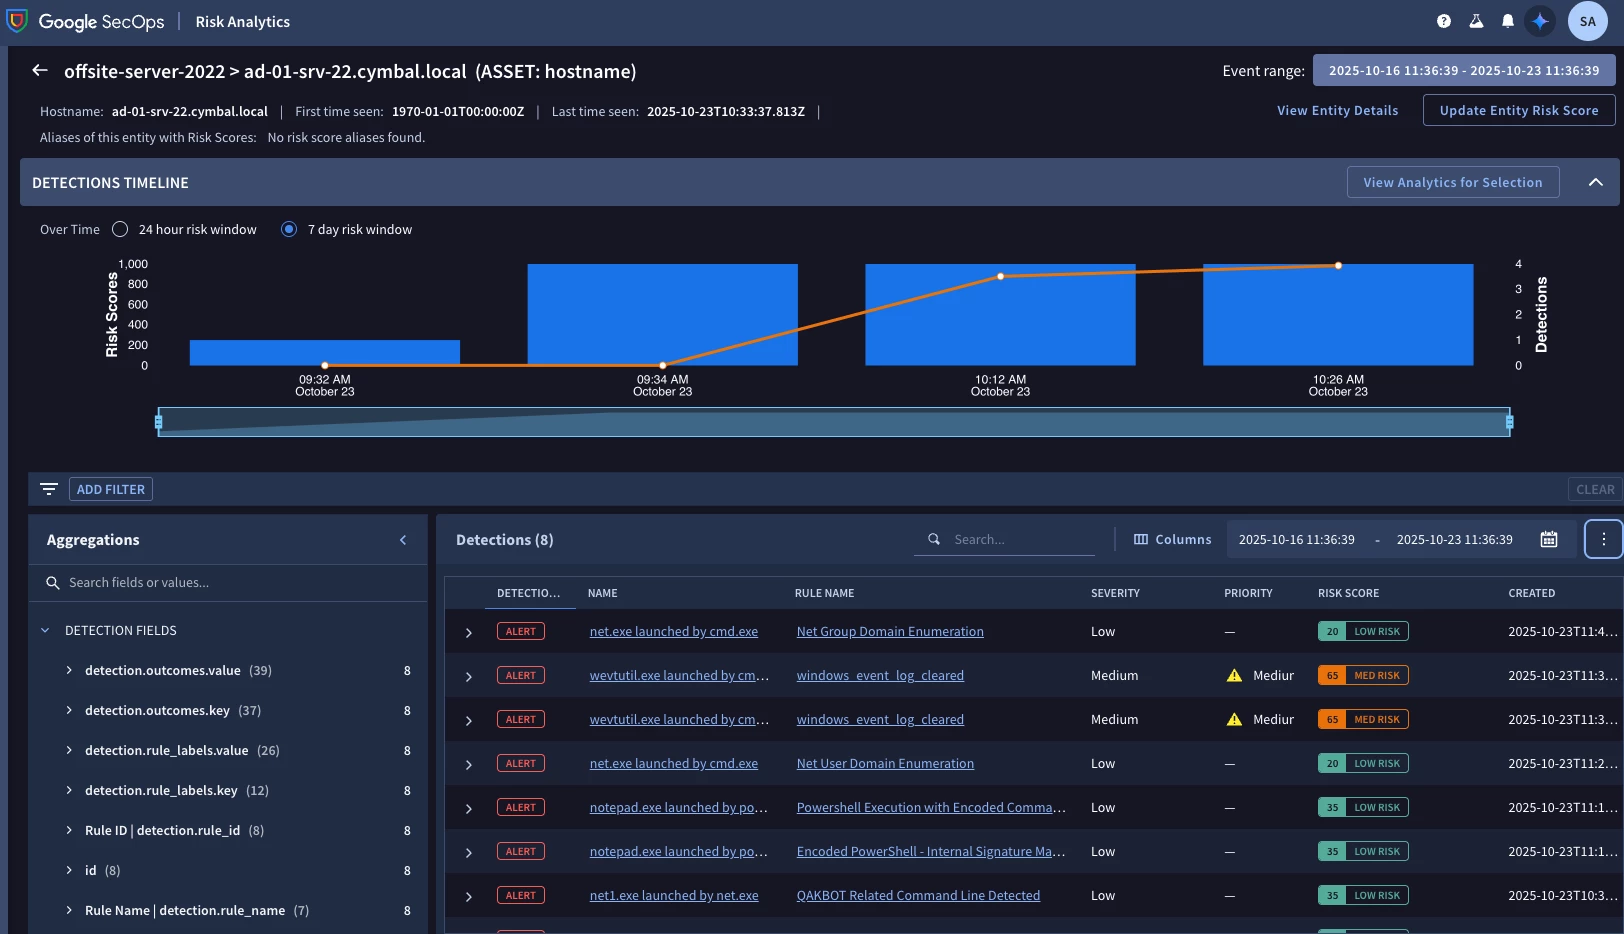
Note: Tests were conducted on a 2022 AD server using our proprietary security validation tool.
Concluding the Validation: Test Case Summary and Risk Score Analysis
To confirm the functional integrity and scoring accuracy of the Google SecOps Risk Analytics feature, a few test cases were executed. These tests were designed to trigger specific detection logic within the Behavioral Analytics engine and assign quantifiable entity risk scores.
The resulting alerts and associated risk scores demonstrate the system's ability to differentiate between activity that poses a clear, high-priority threat and activity that is merely unusual or informational.
For comprehensive product documentation, please refer to the link provided below.
https://cloud.google.com/chronicle/docs/detection/risk-analytics-overview
https://cloud.google.com/chronicle/docs/detection/ueba-getting-started