

Hello,
I’ve noticed a new ingestion metric popup from SecOps in GCP Cloud Monitoring. An “is_unhealthy” metric, which I’m seeking to understand a bit further to figure out what it can do. If it lets us do real time alerting based upon findings from Health Hub, that’ll be awesome. If it’s doing something else, some insight here would be rather useful.
So, I’ve set a basic threshold based alert, but the “is_unhealthy” metric appears to return a numeric value, which depending on the log type can be anywhere between 40 and 110 in this environment. Is there any view as to what this number represents?
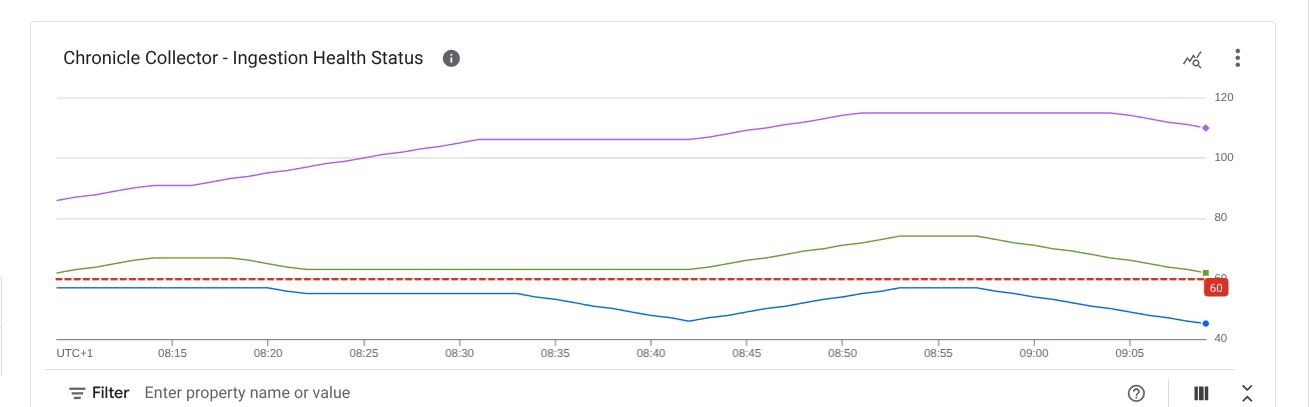
Here’s a view of what I’ve initially setup, which has blasted me with 10-15 alerts on a nightly basis:
"conditions": [
{
"name": "projects/redacted",
"displayName": "Chronicle Collector - Ingestion Health Status",
"conditionThreshold": {
"aggregations": [
{
"alignmentPeriod": "7200s",
"groupByFields": [],
"perSeriesAligner": "ALIGN_COUNT"
}
],
"comparison": "COMPARISON_LT",
"duration": "0s",
"filter": "resource.type = \"chronicle.googleapis.com/Collector\" AND metric.type = \"chronicle.googleapis.com/ingestion/is_unhealthy\" AND metric.labels.state = \"FAILED\"",
"thresholdValue": 100,
"trigger": {
"percent": 90
}
}
}
]
What does the number mean? I’ve tried to correlate it with what’s in Health Hub, but am scratching my head a little bit here.