Question

secops native dashboard for silent host monitoring

  • August 11, 2025
  • 7 replies
  • 147 views

NASEEF
Forum|alt.badge.img+8

Hello team,


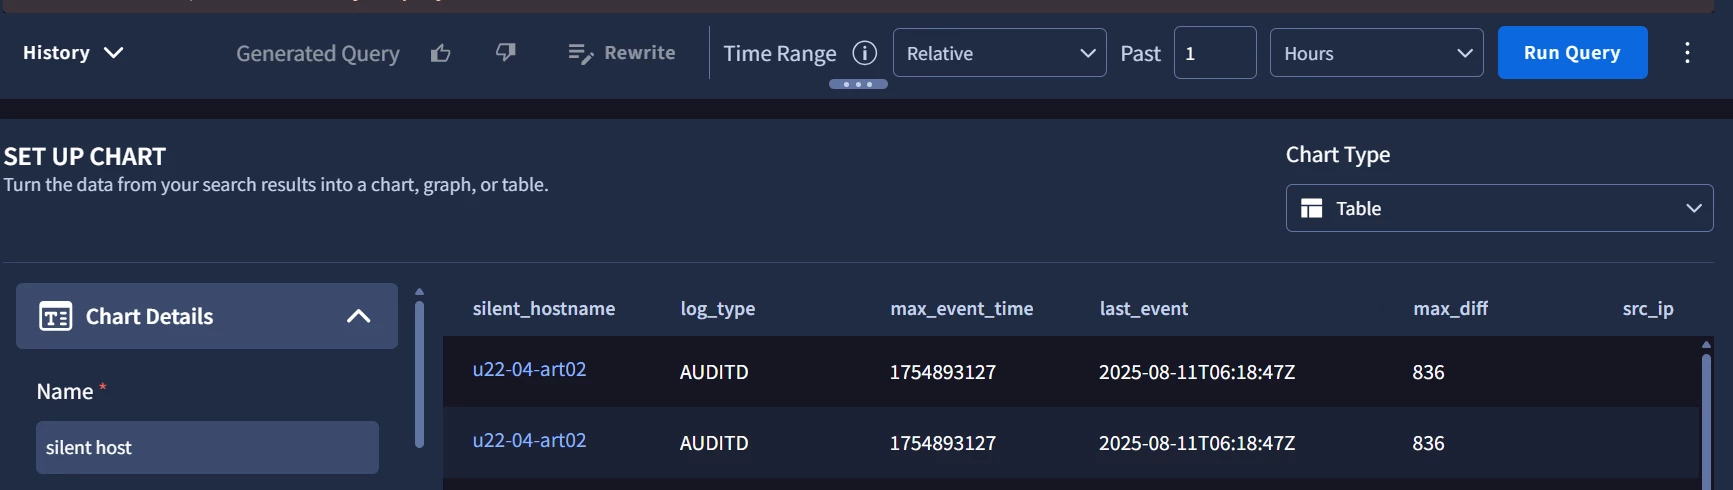
I'm encountering an issue with the native dashboard I created for silent host monitoring. The same host keeps repeating with the same timestamp.


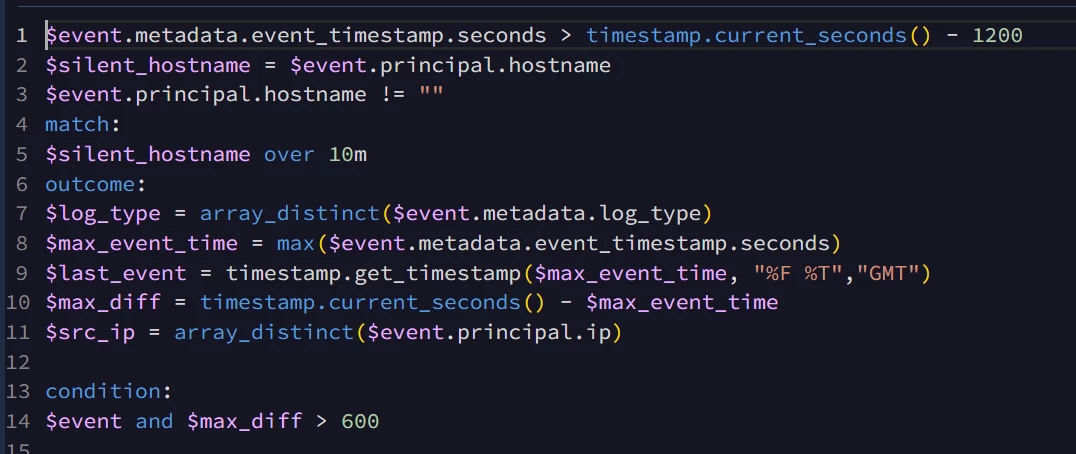
My goal is to visualize hosts that have recently stopped sending logs — for example, a host that was active around 20 minutes ago. However, it seems that the time-based aggregation in my query isn't working as expected. The same host keeps appearing repeatedly with the same timestamp.


thanks in advance


7 replies

SoarAndy
Staff
Forum|alt.badge.img+12
  • Staff
  • August 11, 2025

Can you paste the code here please


NASEEF
Forum|alt.badge.img+8
  • Author
  • Bronze 5
  • August 11, 2025

sure 


$event.metadata.event_timestamp.seconds > timestamp.current_seconds() - 1200

$silent_hostname = $event.principal.hostname

$event.principal.hostname != ""

match:

$silent_hostname over 10m

outcome:

$log_type = array_distinct($event.metadata.log_type)

$max_event_time = max($event.metadata.event_timestamp.seconds)

$last_event = timestamp.get_timestamp($max_event_time, "%F %T","GMT")

$max_diff = timestamp.current_seconds() - $max_event_time

$src_ip = array_distinct($event.principal.ip)


condition:

$event and $max_diff > 600


NASEEF
Forum|alt.badge.img+8
  • Author
  • Bronze 5
  • August 11, 2025

$event.metadata.event_timestamp.seconds > timestamp.current_seconds() - 1200

$silent_hostname = $event.principal.hostname

$event.principal.hostname != ""

match:

$silent_hostname over 10m

outcome:

$log_type = array_distinct($event.metadata.log_type)

$max_event_time = max($event.metadata.event_timestamp.seconds)

$last_event = timestamp.get_timestamp($max_event_time, "%F %T","GMT")

$max_diff = timestamp.current_seconds() - $max_event_time

$src_ip = array_distinct($event.principal.ip)


condition:

$event and $max_diff > 600


SoarAndy
Staff
Forum|alt.badge.img+12
  • Staff
  • August 11, 2025

Have you seen the OOTB dashboard “Silent Host Monitoring” ?  It has a few differences, most specifically looking at graph.domain rather than principal.host.  Would it be worth a try starting with that and adapting it to your layout requirement?


NASEEF
Forum|alt.badge.img+8
  • Author
  • Bronze 5
  • August 12, 2025

hi @SoarAndy

we couldn’t find the OOTB Dashboard for silent host monitoring could you please share the raw dashboard query so that we can replicate it in our infra


and we are looking for host machines that just stopped sending logs so isn’t it better to use principal.hostname rather than graph.domain as it contains other host machines as well


SoarAndy
Staff
Forum|alt.badge.img+12
  • Staff
  • August 12, 2025

My apologies, some of the final content is still trickling through to full GA

I’ll paste two here:

$host = principal.hostname
$event_time = metadata.event_timestamp.seconds
match:
$host
outcome:
$last_seen_timestamp = timestamp.get_timestamp(max($event_time))
$days_since_last_seen = math.round((timestamp.current_seconds() - max($event_time)) / 86400, 0)
order:
$days_since_last_seen desc
$asset = graph.entity.hostname
$asset != ""

//time period declarations
$last_seen_seconds = graph.entity.domain.last_seen_time.seconds

// hosts seen in the last week, but not in the last two days
$last_seen_seconds <= timestamp.current_seconds() - 172800 AND $last_seen_seconds >= timestamp.current_seconds() - 604800

//show the user the last_seen timestamp in a human readable format
$last_seen_timestamp = timestamp.get_timestamp(graph.entity.domain.last_seen_time.seconds)

match:
$asset, $last_seen_timestamp

order:
$last_seen_timestamp desc


SoarAndy
Staff
Forum|alt.badge.img+12
  • Staff
  • August 12, 2025

Ignore, user error :)


$host = principal.hostname

$event_time = metadata.event_timestamp.seconds

match:

$host

outcome:

$last_seen_timestamp = timestamp.get_timestamp(max($event_time))

$days_since_last_seen = math.round((timestamp.current_seconds() - max($event_time)) / 86400, 0)

order:

$days_since_last_seen desc