


By default Google Secops compress the x-axis on its visualizations.
For instance in any timechart if there is no value on any given timeslot, it’d just compress the x-axis making it non-linear.
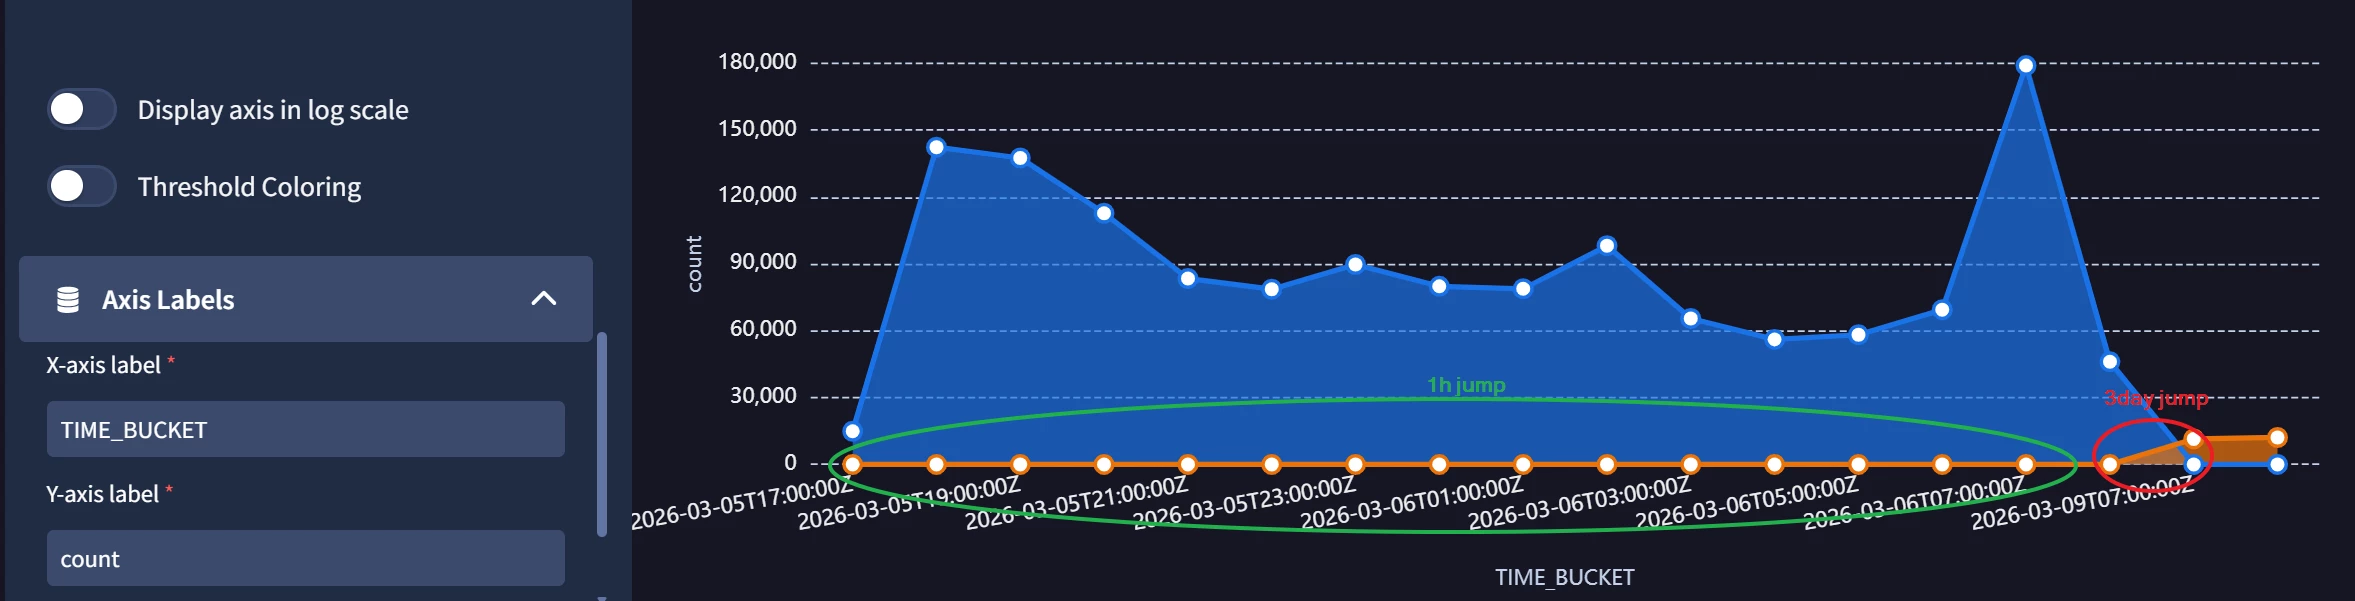
Sometimes this might be helpful but other times it could be misleading.
We need a way to switch between compressed and linear x-axis.

