
Hello,

I’m looking for advice regarding the operation of Chronicle SecOps.

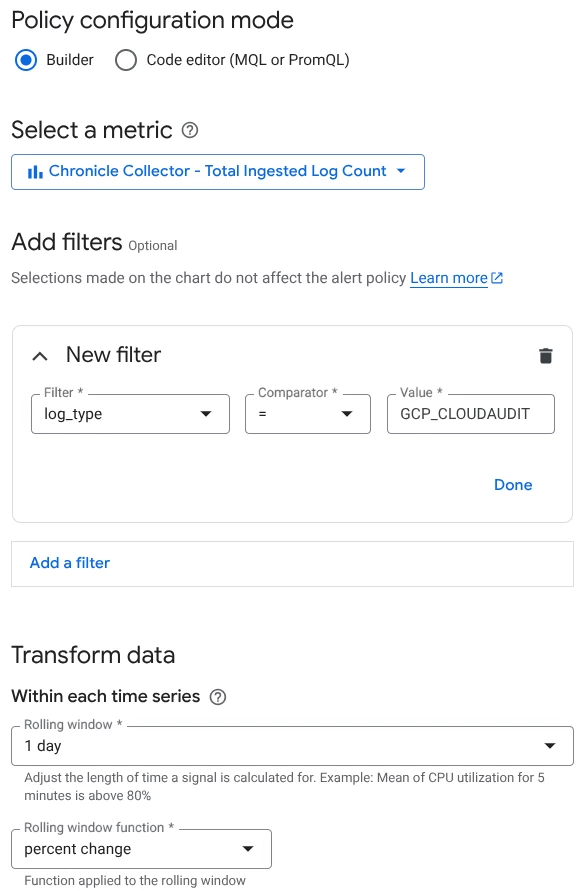
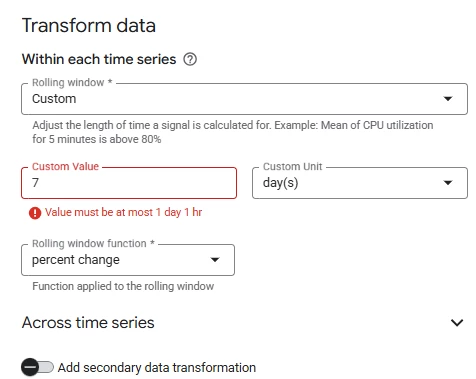
Currently, we’re managing multiple Feeds (log ingestion sources) in SecOps, and our goal is to detect issues such as ingestion failures or delays on a per-Feed basis as early as possible and trigger alerts accordingly.

At the moment, we haven’t decided on any specific implementation method. We’re considering various approaches, including built-in SecOps or Cloud Monitoring features, API integrations, or other cloud services, but we’re not sure which would be the most effective or practical.

If anyone has experience implementing Feed-level ingestion monitoring and alerting in Chronicle SecOps, I’d appreciate your recommendations, tips, or any lessons learned.

Thank you!

We’re using Cloud Monitoring alert policies that send alerts to a SOAR webhook which then creates a case for the log source/log type that stopped being ingested in SIEM.


You may want to take a look here: https://cloud.google.com/chronicle/docs/ingestion/silent-host-monitoring


Thank you very much to everyone who has replied and shared insights—it’s truly helpful and appreciated.


If it’s alright, I’d like to ask the broader community as well:
Has anyone set up a monitoring solution that compares the current log ingestion volume to the average from a week ago, and triggers an alert when there’s a deviation of more than 20%?

I am looking for any examples, best practices, or recommendations for configuring such threshold-based monitoring, whether through Cloud Monitoring, Chronicle, or other integrations.


Any further advice or resources would be greatly appreciated.
Thank you again for your kind support!


You can set a threshold, rather than just absence, with Cloud Monitoring - 


Thank you for your response!

Just to clarify, I’d like to set up an alert that compares the current log ingestion volume to the average over the previous week, and triggers when the deviation exceeds 20%.

Is this kind of dynamic threshold (based on moving averages or historical values) achievable through the standard Cloud Monitoring UI, or does it require a custom MQL query or other solution?

If anyone has experience with configuring this sort of ratio-based alert, I’d be grateful for any pointers or examples.

Thank you again for your support!


Reply