
Hi
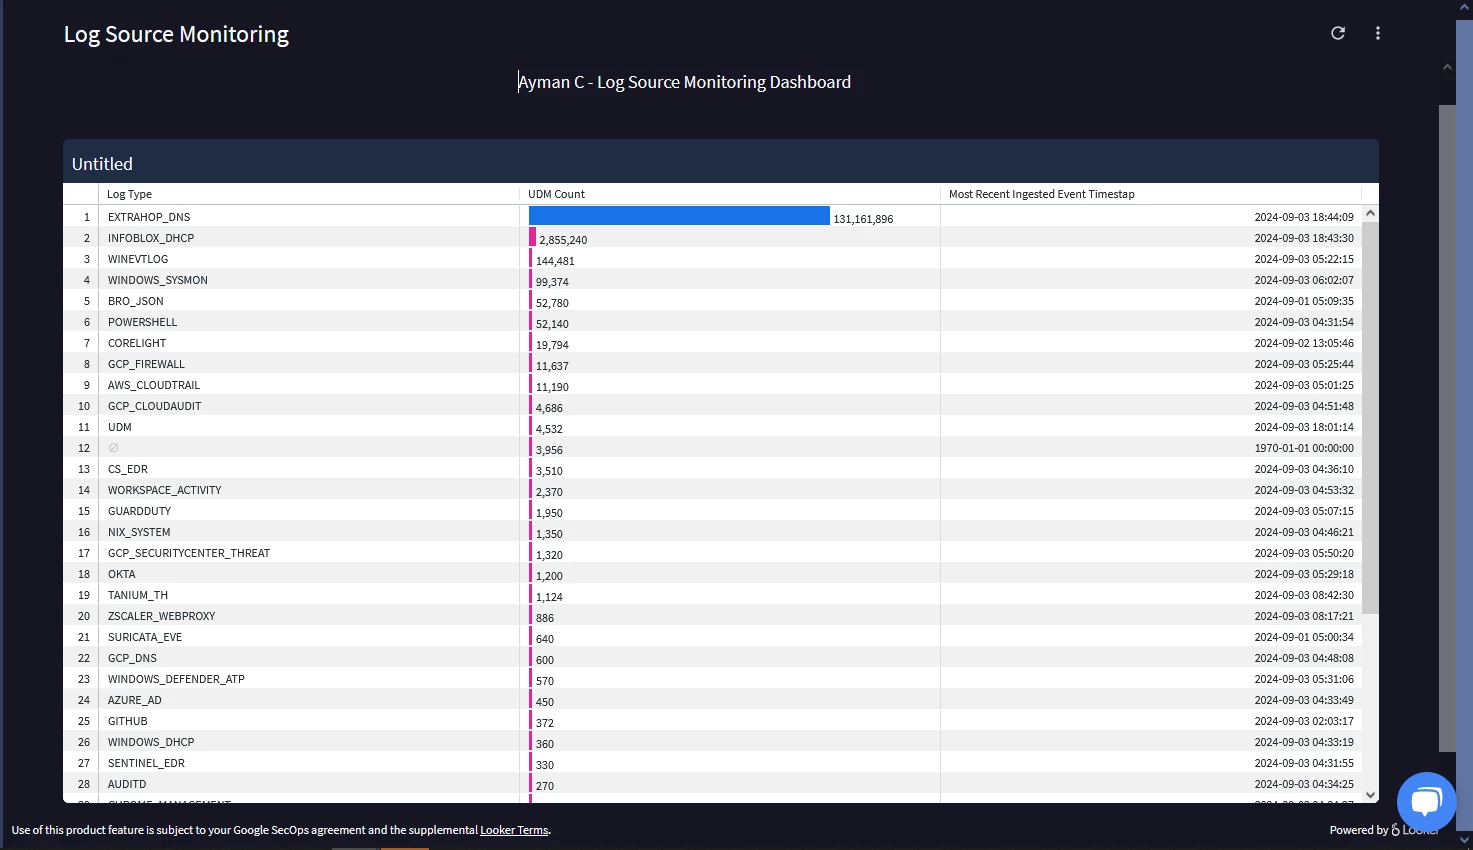
I like to have a panel that shows all my ingested log sources and its last ingested time . i do see a panel "Recently Ingested Events" under Data Ingestion and Health but it shows only some log sources and not all the ones .I want panel showing all the log sources and its time , can some one help me understand how i can build it . @jstoner any suggestion .

Solved
SIEM Dashboard in Google Secops
 +10
+10- Bronze 2
Best answer by AymanC
Hi @rahul7514
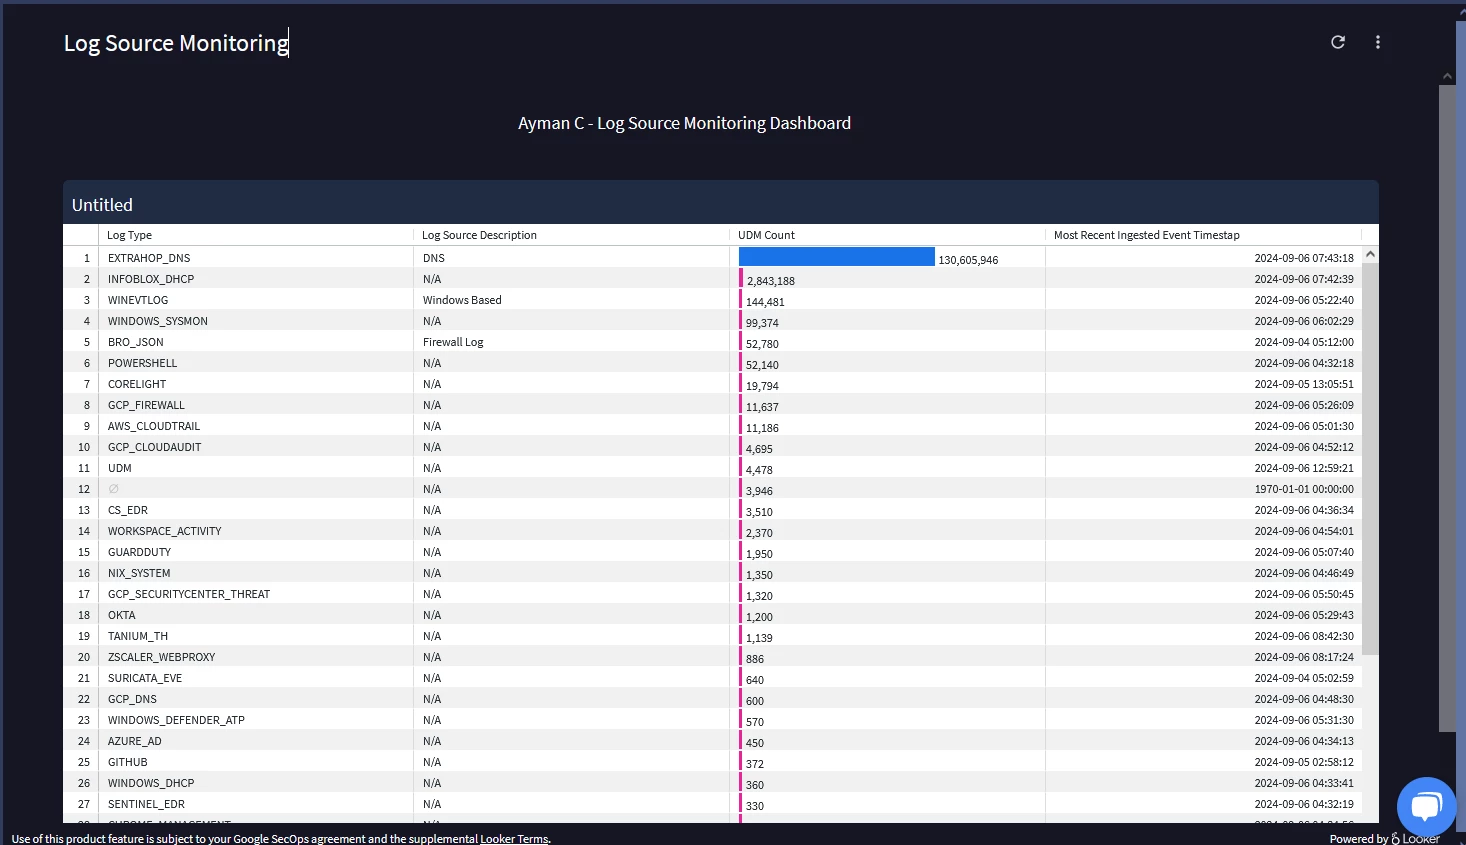
This should be what you want.
lookml:
- dashboard: log_source_monitoring
description: ""
elements:
- col: 0
column_limit: 50
conditional_formatting_include_nulls: false
conditional_formatting_include_totals: false
defaults_version: 1
enable_conditional_formatting: false
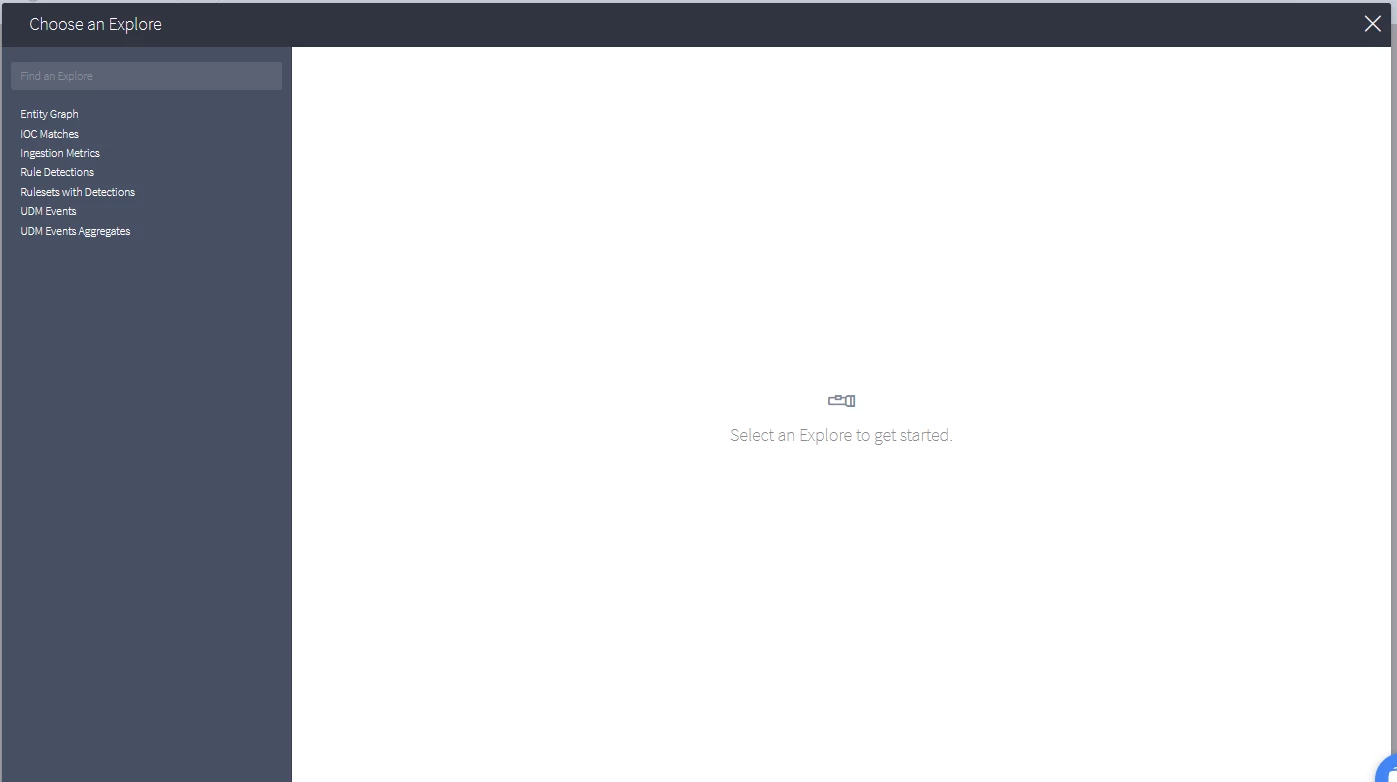
explore: events_connector
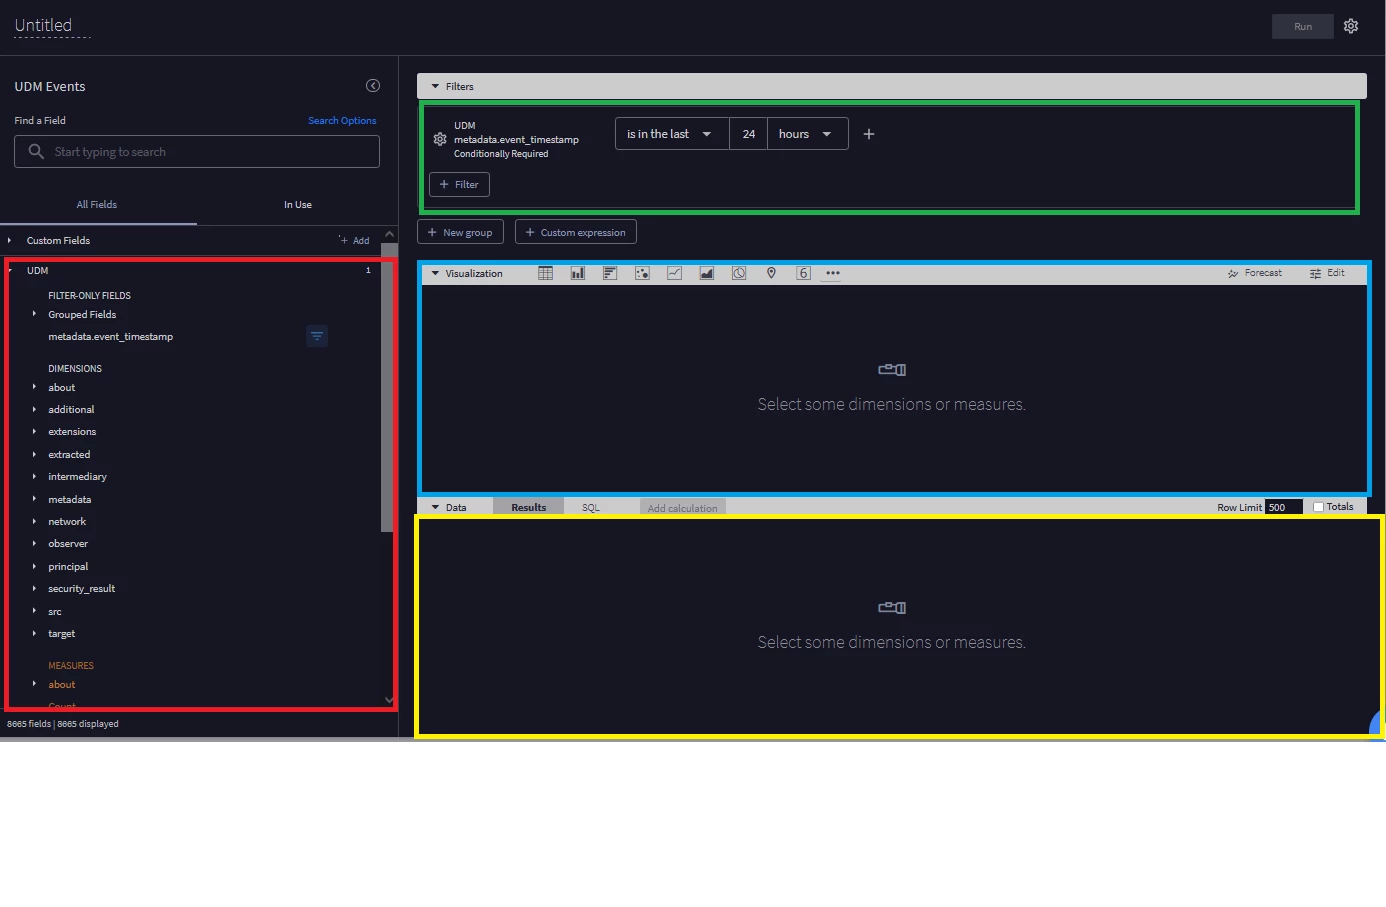
fields:
- events.count
- events.metadata__log_type
- events.metadata__event_timestamp_max_second
filters:
events.time_filter: ""
header_font_size: "12"
header_text_alignment: left
height: 13
hidden_pivots: {}
hide_row_totals: false
hide_totals: false
limit: 500
limit_displayed_rows: false
minimum_column_width: 75
model: scn
name: Untitled
row: 2
rows_font_size: "12"
series_cell_visualizations:
events.count:
is_active: true
series_labels:
events.count: UDM Count
events.metadata__event_timestamp_max_second: Most Recent Ingested Event Timestap
events.metadata__log_type: Log Type
show_row_numbers: true
show_row_totals: true
show_sql_query_menu_options: false
show_totals: true
show_view_names: false
size_to_fit: true
sorts:
- events.count desc 0
table_theme: white
title: Untitled
transpose: false
truncate_header: false
truncate_text: true
type: looker_grid
width: 24
- body_text: ""
col: 8
height: 2
name: Ayman C - Log Source Monitoring Dashboard
row: 0
subtitle_text: ""
title_text: Ayman C - Log Source Monitoring Dashboard
type: text
width: 7
layout: newspaper
title: Log Source Monitoring
metadata:
exported_at: "2024-09-03T12:28:25-07:00"
file_fingerprint: "127765673354839399756613081162743290298"
looker_version: 24.0.66
version: "1"


Enter your E-mail address. We'll send you an e-mail with instructions to reset your password.