To investigate the log ingestion volume by feed ID, I created the following dashboard query:
----------
ingestion.log_type = "CISCO_MERAKI"
$Feed_id = ingestion.feed_id
$Date = timestamp.get_date(ingestion.end_time)
match:
$Feed_id
outcome:
$Volume = math.round(sum(ingestion.log_volume) / (1000), 2)
order:
$Volume desc
----------
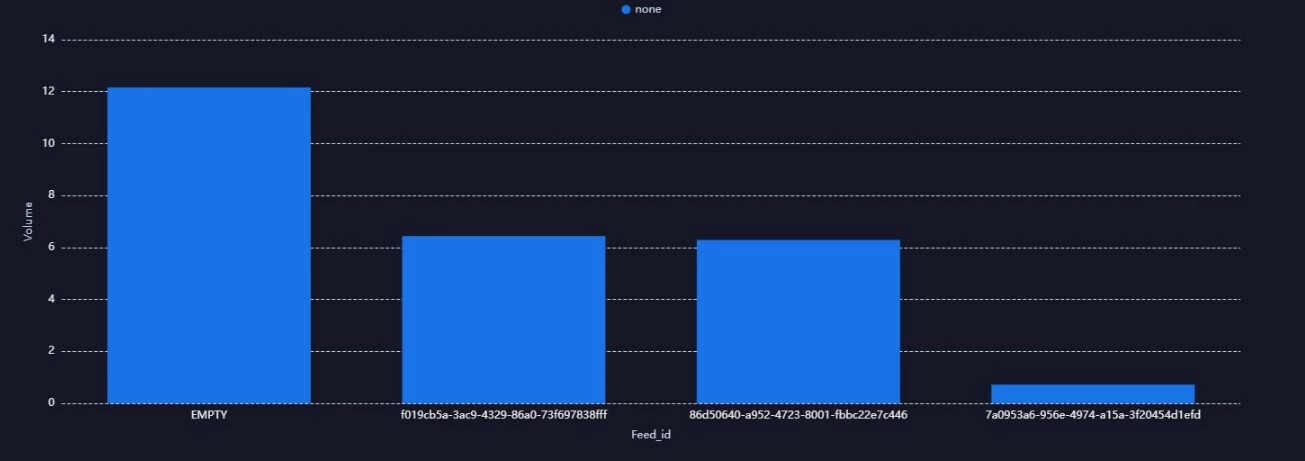
However, in addition to the feed IDs, there is a graph entry labeled as "empty."
I would like to understand the reason why this "empty" entry is appearing.
I will attach a screenshot of the graph.