



As more organizations modernize their workloads, Kubernetes has become the de facto standard for deploying applications. However, this architectural shift introduces a unique challenge for Security Operations: log wrapping. When application logs—such as those from Jenkins—are ingested directly from a container's stdout, they are natively assigned to the KUBERNETES_NODE parser in Google SecOps. Because the actual application data is wrapped inside Kubernetes metadata, out-of-the-box application parsers can't process the payload, leaving security teams with a parsing roadblock. Recently, a customer reached out looking for a way to dynamically route these nested logs to the correct application parsers. In this post, I'll walk you through a complete, hands-on solution to this exact problem. We will build a tailored ingestion pipeline by setting up a Jenkins container lab on GCP, utilizing Pub/Sub and Cloud Functions to intelligently unwrap the data (and writing a custom parser if your JENKINS version requires) to ensure your logs are perfectly normalized into UDM. The cloud function code, custom parser code, and summary of required IAM roles will be provided as attachment.
Let’s begin with the lab setup.
1 - Set up the GCP project and APIs
- Pick or create a test project, then enable the required APIs (On GCP Cloud Console)
# gcloud config set project YOUR_PROJECT_ID
# gcloud services enable container.googleapis.com logging.googleapis.com

Use a disposable/sandbox project if you have one — this avoids any interference with production log routing or SecOps feeds.
2 - Create a small GKE cluster
- A single-node Standard cluster is enough and keeps cost low
# gcloud container clusters create jenkins-test-cluster --zone=us-west2-c --num-nodes=1 --machine-type=e2-standard-4

# gcloud container clusters get-credentials jenkins-test-cluster --zone=us-west2-c

GKE's built-in Cloud Logging integration is on by default for new clusters — no extra config needed for logs to start flowing as k8s_container entries.
3 - Install Helm and add the Jenkins chart repo
- If you don't already have Helm:
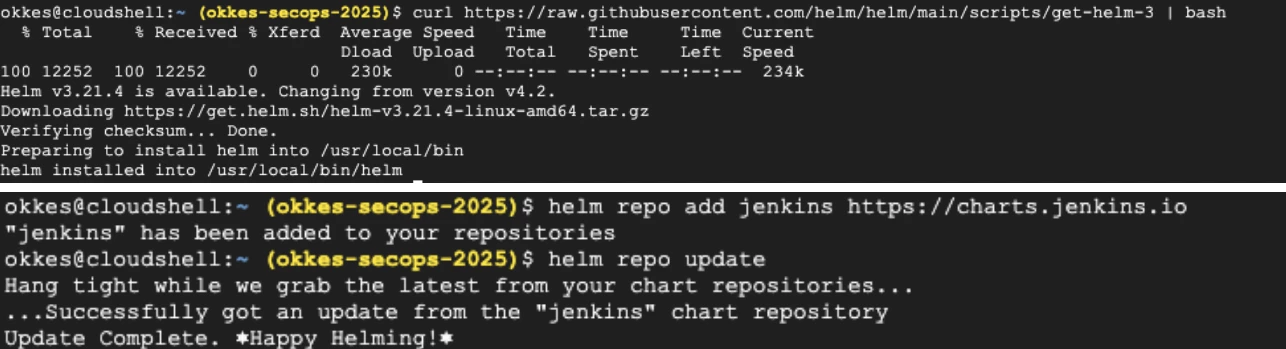
# curl https://raw.githubusercontent.com/helm/helm/main/scripts/get-helm-3 | bash
- Then add the official Jenkins chart repo (this is the chart your sample log's helm_sh/chart label came from):
# helm repo add jenkins https://charts.jenkins.io helm repo update
4 - Deploy Jenkins into a namespace
- Create a namespace and install the chart. Use whatever namespace name you like — it becomes resource.labels.namespace_name in the log:
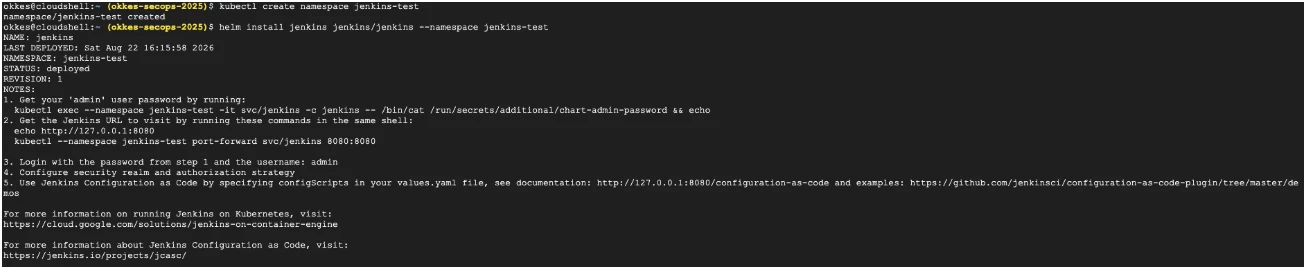
# kubectl create namespace jenkins-test
# helm install jenkins jenkins/jenkins --namespace jenkins-test
This deploys a StatefulSet named 'jenkins' with a pod called jenkins-0 and a container called jenkins — matching resource.labels.pod_name / container_name in your sample.
- Wait a minute or two for the pod to reach Running
# kubectl get pods -n jenkins-test -w

5 - Get the admin password and login
- Retrieve the auto-generated admin password:
# kubectl exec -n jenkins-test svc/jenkins -c jenkins -- /bin/cat /run/secrets/additional/chart-admin-password

- Then port-forward to reach the UI locally:
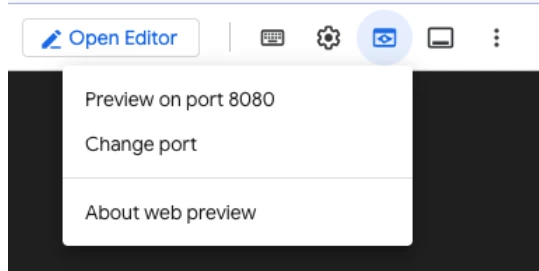
# kubectl port-forward -n jenkins-test svc/jenkins 8080:8080

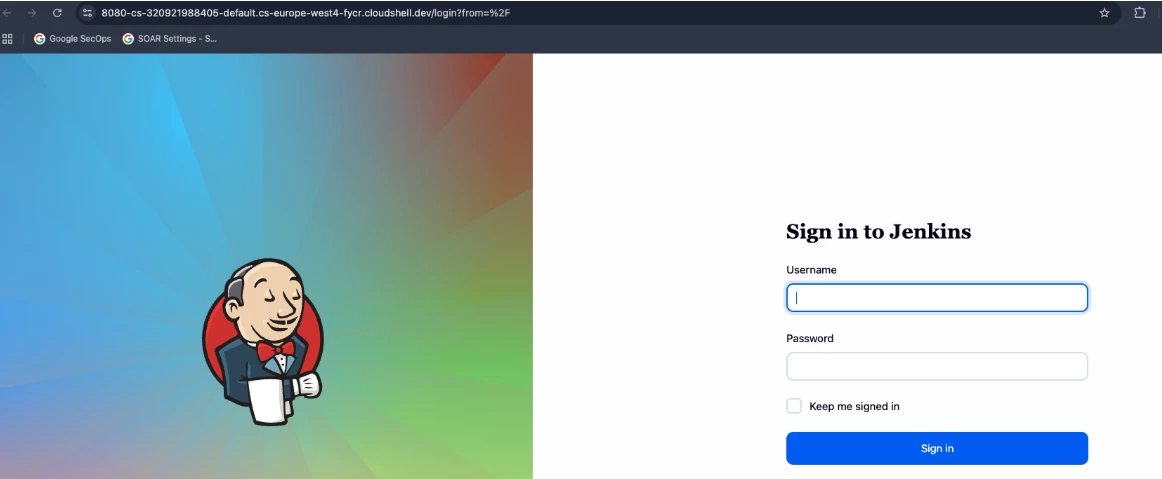
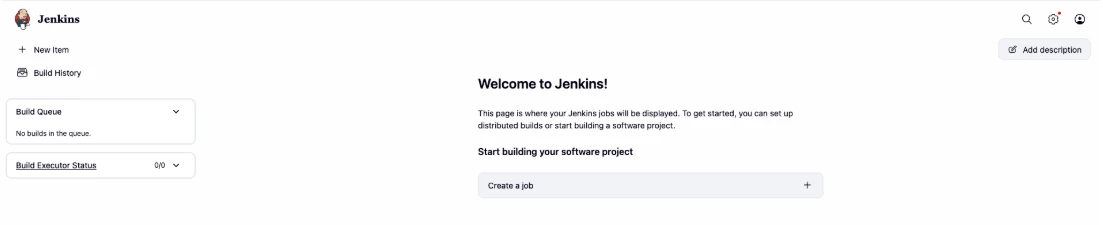
- Open http://localhost:8080 and log in as 'admin' with the password above.
6 - Install and configure the Audit Trail plugin
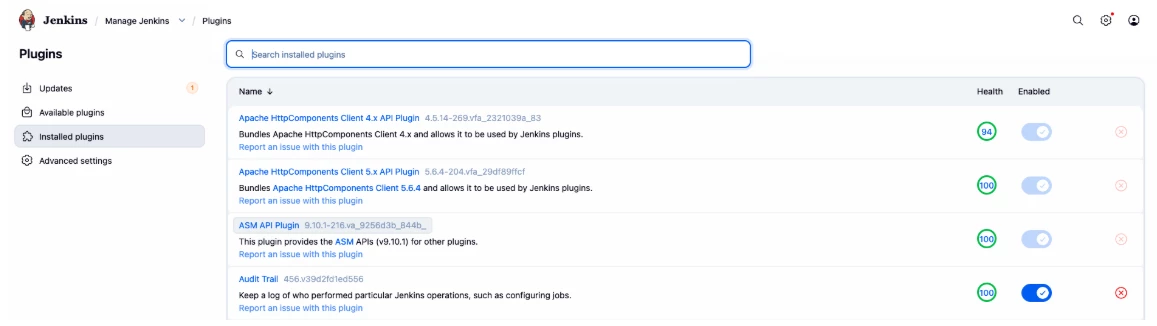
- In the Jenkins UI: Manage Jenkins > Plugins > Available plugins, search 'Audit Trail', install it, and restart if prompted. Then go to Manage Jenkins > System, find the Audit Trail section, and confirm a logger is enabled (the default java.util.logging console logger is usually sufficient — Jenkins' base Docker image already routes java.util.logging output to stdout, which is exactly why the plugin's lines show up in textPayload without any extra config).
7 - Check for the login events on cloud logging
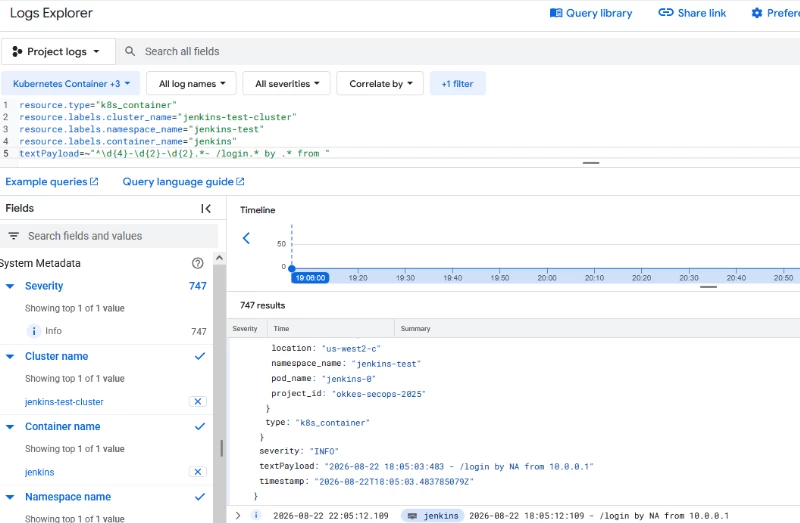
Now the lab setup is complete, it is time to import these without Kubernetes header to Google Secops so that JENKINS parser can be used.
8- Create a dedicated Pub/Sub topic
# gcloud pubsub topics create jenkins-raw-logs
This isolates the Jenkins stream from your general Kubernetes log flow so you can process it independently without touching your existing pipeline.

9 - Create a filtered Cloud Logging sink
- Create a sink that only matches your Jenkins pod, pointed at the new topic:
# gcloud logging sinks create jenkins-to-pubsub pubsub.googleapis.com/projects/YOUR_PROJECT_ID/topics/jenkins-raw-logs --log-filter='resource.type="k8s_container" AND resource.labels.cluster_name="jenkins-test-cluster" AND resource.labels.namespace_name="jenkins-test" AND resource.labels.container_name="jenkins"'

- Grant the sink's service account publish rights (the command above prints a writer identity — grab it and run):
# gcloud pubsub topics add-iam-policy-binding jenkins-raw-logs --member=serviceAccount:SINK_WRITER_IDENTITY --role=roles/pubsub.publisher

10 - Set up a service account for Chronicle API access
- Create a service account for the function to call the Chronicle API:
# gcloud iam service-accounts create secops-jenkins-ingest

- Grant it the Chronicle/SecOps ingestion role
# gcloud projects add-iam-policy-binding YOUR_PROJECT_ID --member="serviceAccount:secops-jenkins-ingest@YOUR_PROJECT_ID.iam.gserviceaccount.com" --role="roles/chronicle.editor"

- Also note your Customer ID and the correct regional API endpoint from SecOps Settings > Profile > Organization Details
11 - Navigate to Cloud Run functions
- Go to console.cloud.google.com, make sure your test project is selected in the project switcher at the top, then use the search bar and type 'Cloud Run functions' (Google has merged Cloud Functions into the Cloud Run product in the console). Click into it from the search results.
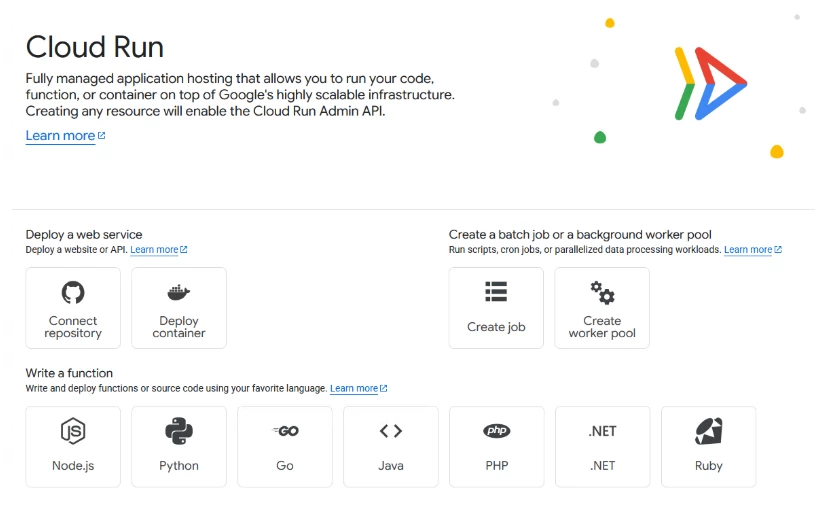
12 - Start creating a new function
- Click the Python button under Write a function.
13 - Set the function name and environment
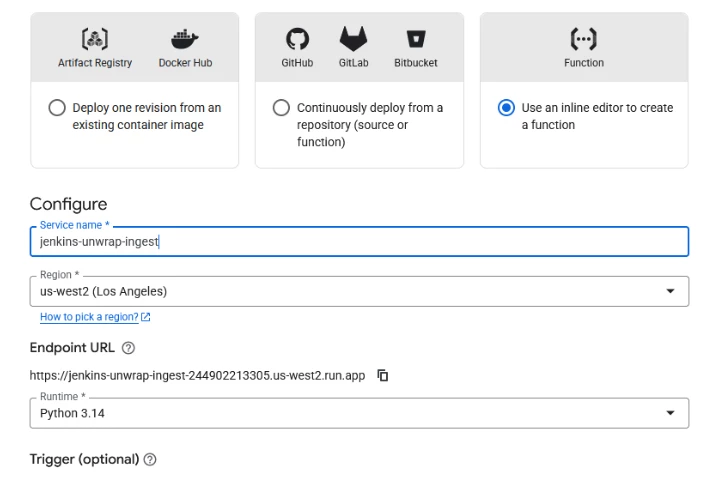
- Under Basics: Environment should be set to 2nd gen (default). Enter a Function name, e.g. jenkins-unwrap-ingest. Choose the Region — pick the same region your Pub/Sub topic and GKE cluster are in, to avoid cross-region latency/cost.
14 - Configure the Pub/Sub trigger
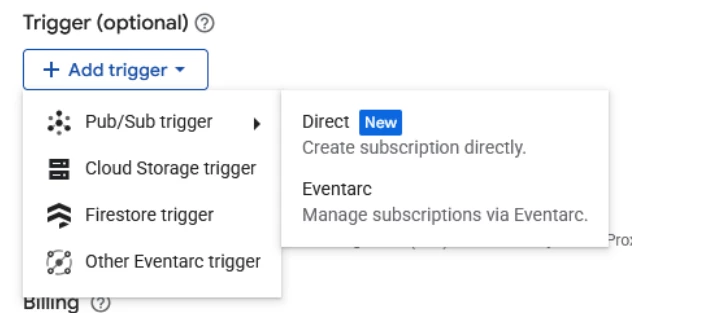
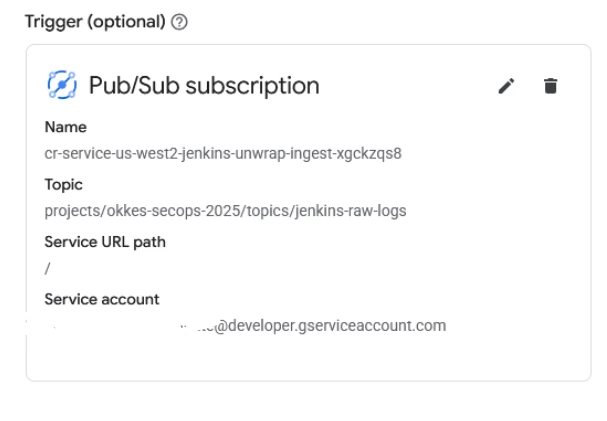
- Under Trigger, click Add Trigger and select Cloud Pub/Sub from the trigger type list. In the Select a Cloud Pub/Sub topic dropdown, choose the jenkins-raw-logs topic you created earlier.
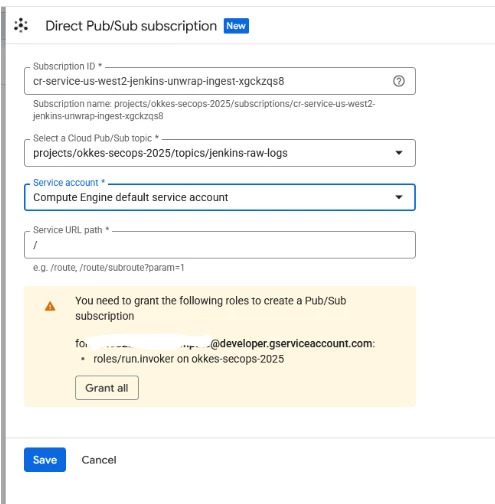
- Click "grant all" and "save"
15 - Set the service account and environment variables
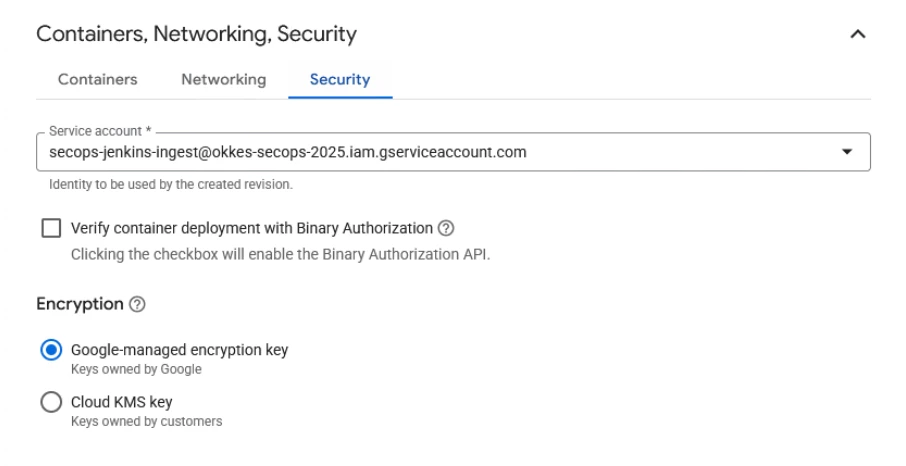
Expand Containers, Networking and Security. Under the Security tab:
- Set Runtime service account to the secops-jenkins-ingest service account you created
- Under Runtime environment variables, click Add variable and add each of: CHRONICLE_CUSTOMER_ID, CHRONICLE_PROJECT_NUMBER, CHRONICLE_REGION, CHRONICLE_LOG_TYPE, enter your actual values for each.
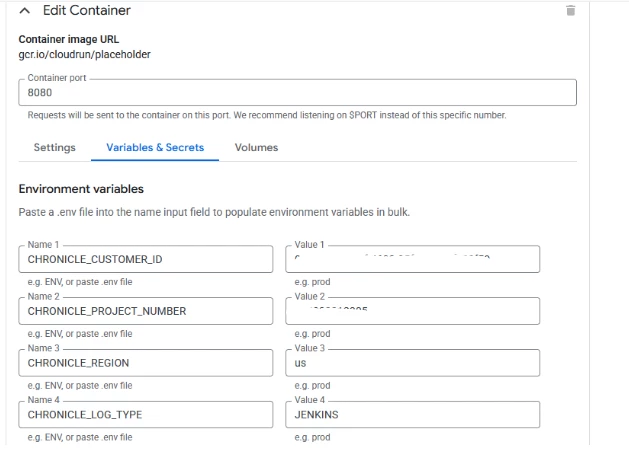
- Click create service with all other options left default.
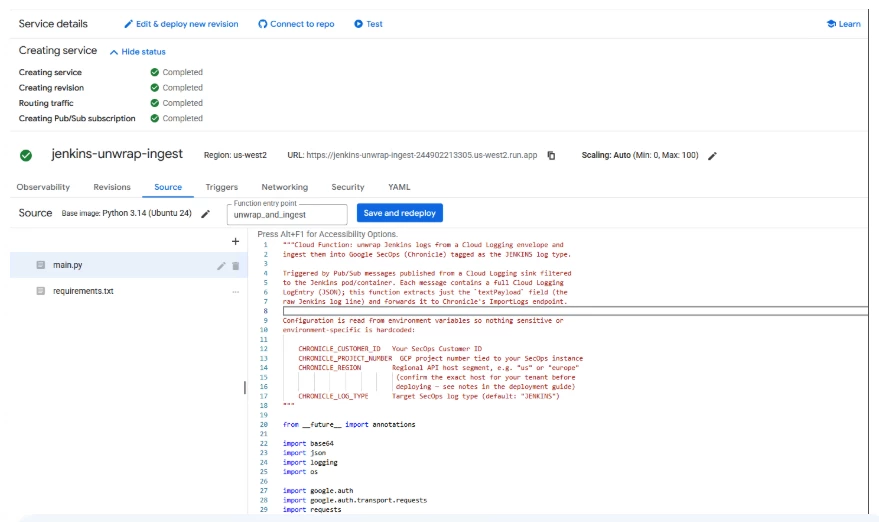
- Now, edit requirements.txt and main.py with the attached codes, set function entry point to unwrap_and_ingest and click "Save and redploy". Click "grant all" in the opening pop-up.
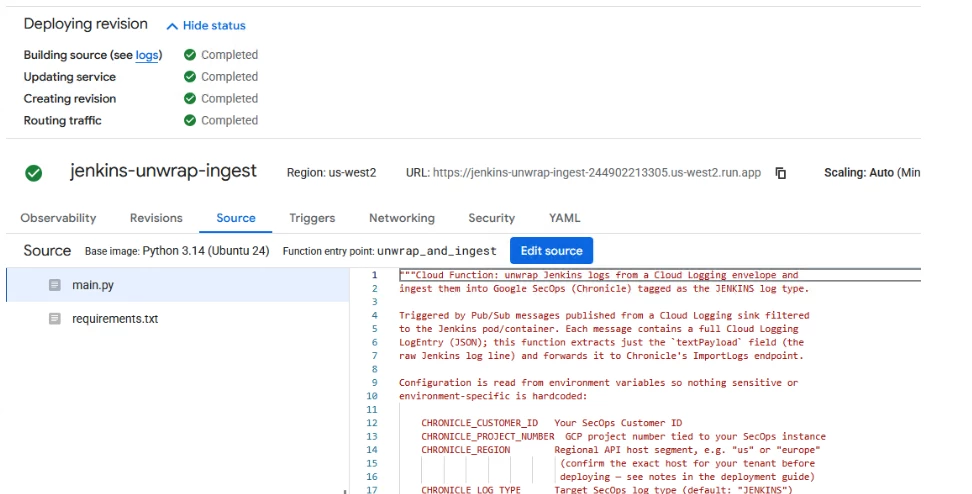
- Wait for the deployment completion:
- The next step is testing our code
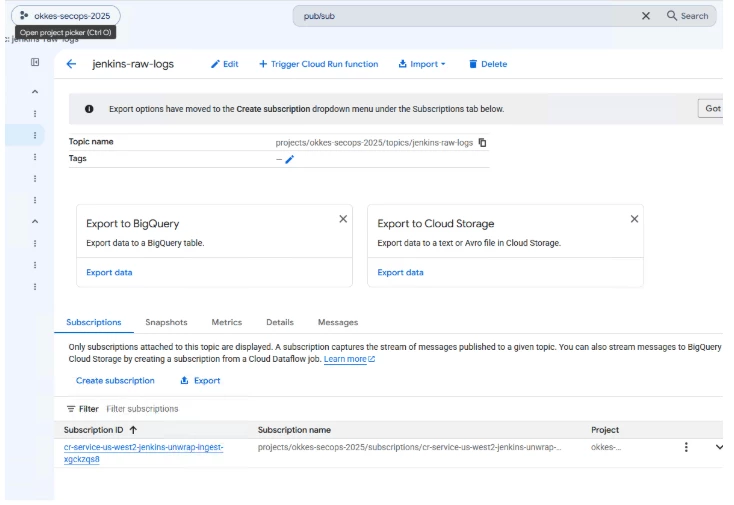
16 - Publish a test message directly to the Pub/Sub topic
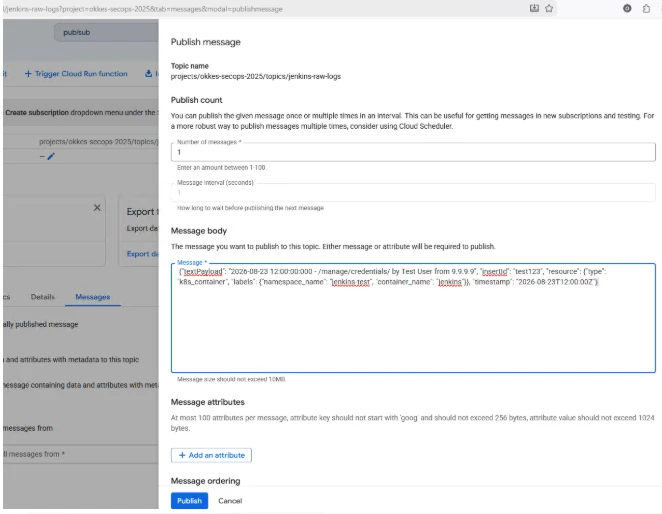
- In the Cloud Console, go to Pub/Sub > Topics, click into jenkins-raw-logs, and click Messages tab > Publish Message. Paste in a fake Cloud Logging envelope as the message body, e.g.:
{"textPayload": "2026-08-23 12:00:00:000 - /manage/credentials/ by Test User from 9.9.9.9", "insertId": "test123", "resource": {"type": "k8s_container", "labels": {"namespace_name": "jenkins-test", "container_name": "jenkins"}}, "timestamp": "2026-08-23T12:00:00Z"}
This lets you test the function's logic directly, without waiting on a real Jenkins event to flow through Cloud Logging first — it isolates 'is my function correct' from 'is my sink/log pipeline correct'
17 - Check the function's execution logs
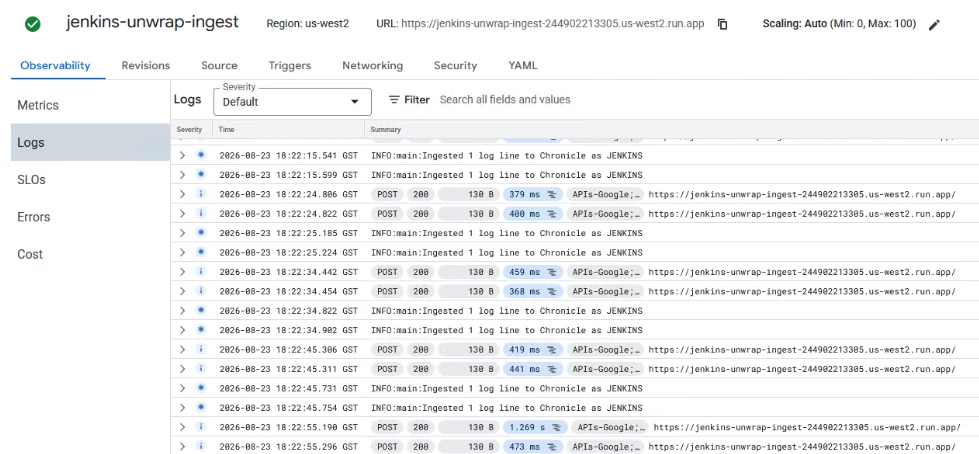
- Go back to Cloud Run functions, click into jenkins-unwrap-ingest, and open the Logs tab. Within a few seconds of publishing, you should see a new invocation. Look for the line 'Ingested 1 log line to Chronicle as JENKINS' — that confirms the function ran, parsed the JSON, extracted textPayload, and got a successful (2xx) response back from Chronicle.
18 - Check the ingestion on Secops
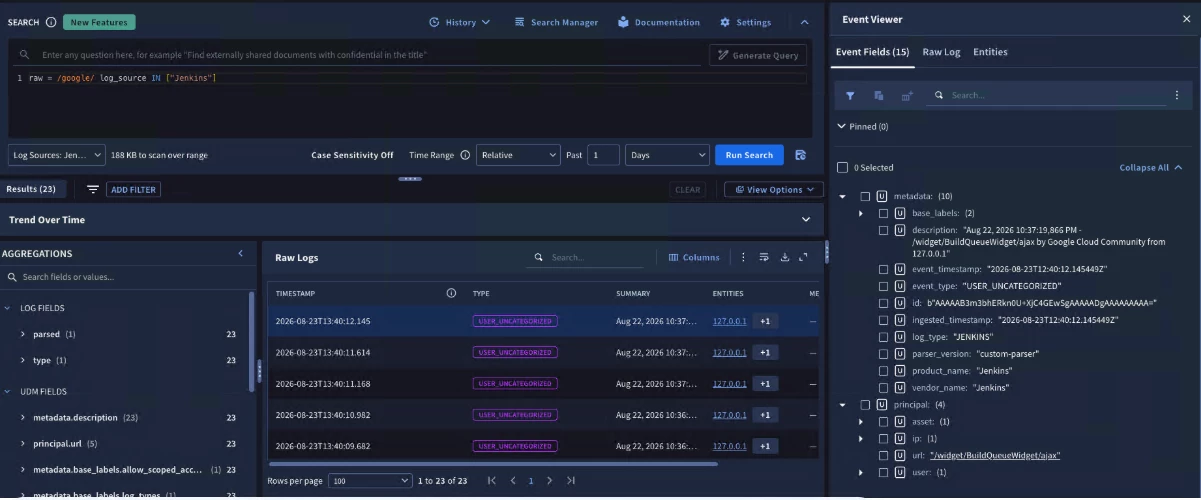
* I created a user - google - on Jenkins, tested to see for its audit logs
* * In case the prebuilt parser has issues with ingested data, a working custom parser is also attached.
Summary
The challenge of Kubernetes "log wrapping" is a hurdle almost every modern security team faces as they migrate to containerized workloads. While native dynamic parser chaining is a highly requested feature, you don't have to wait to get clean, actionable data into your SIEM. By leaning on Google Cloud’s native serverless components—specifically Pub/Sub and Cloud Functions—we successfully built a highly scalable preprocessing layer. We intercepted the stdout stream, stripped away the overarching node metadata, and routed the raw Jenkins payload directly to our custom SecOps parser. The best part? This architecture isn't unique to Jenkins. You can easily adapt this exact Cloud Function and Pub/Sub pipeline to unwrap logs for any containerized application in your fleet, ensuring your SOC always has the precise UDM fields they need for robust detections and rapid investigations.
