
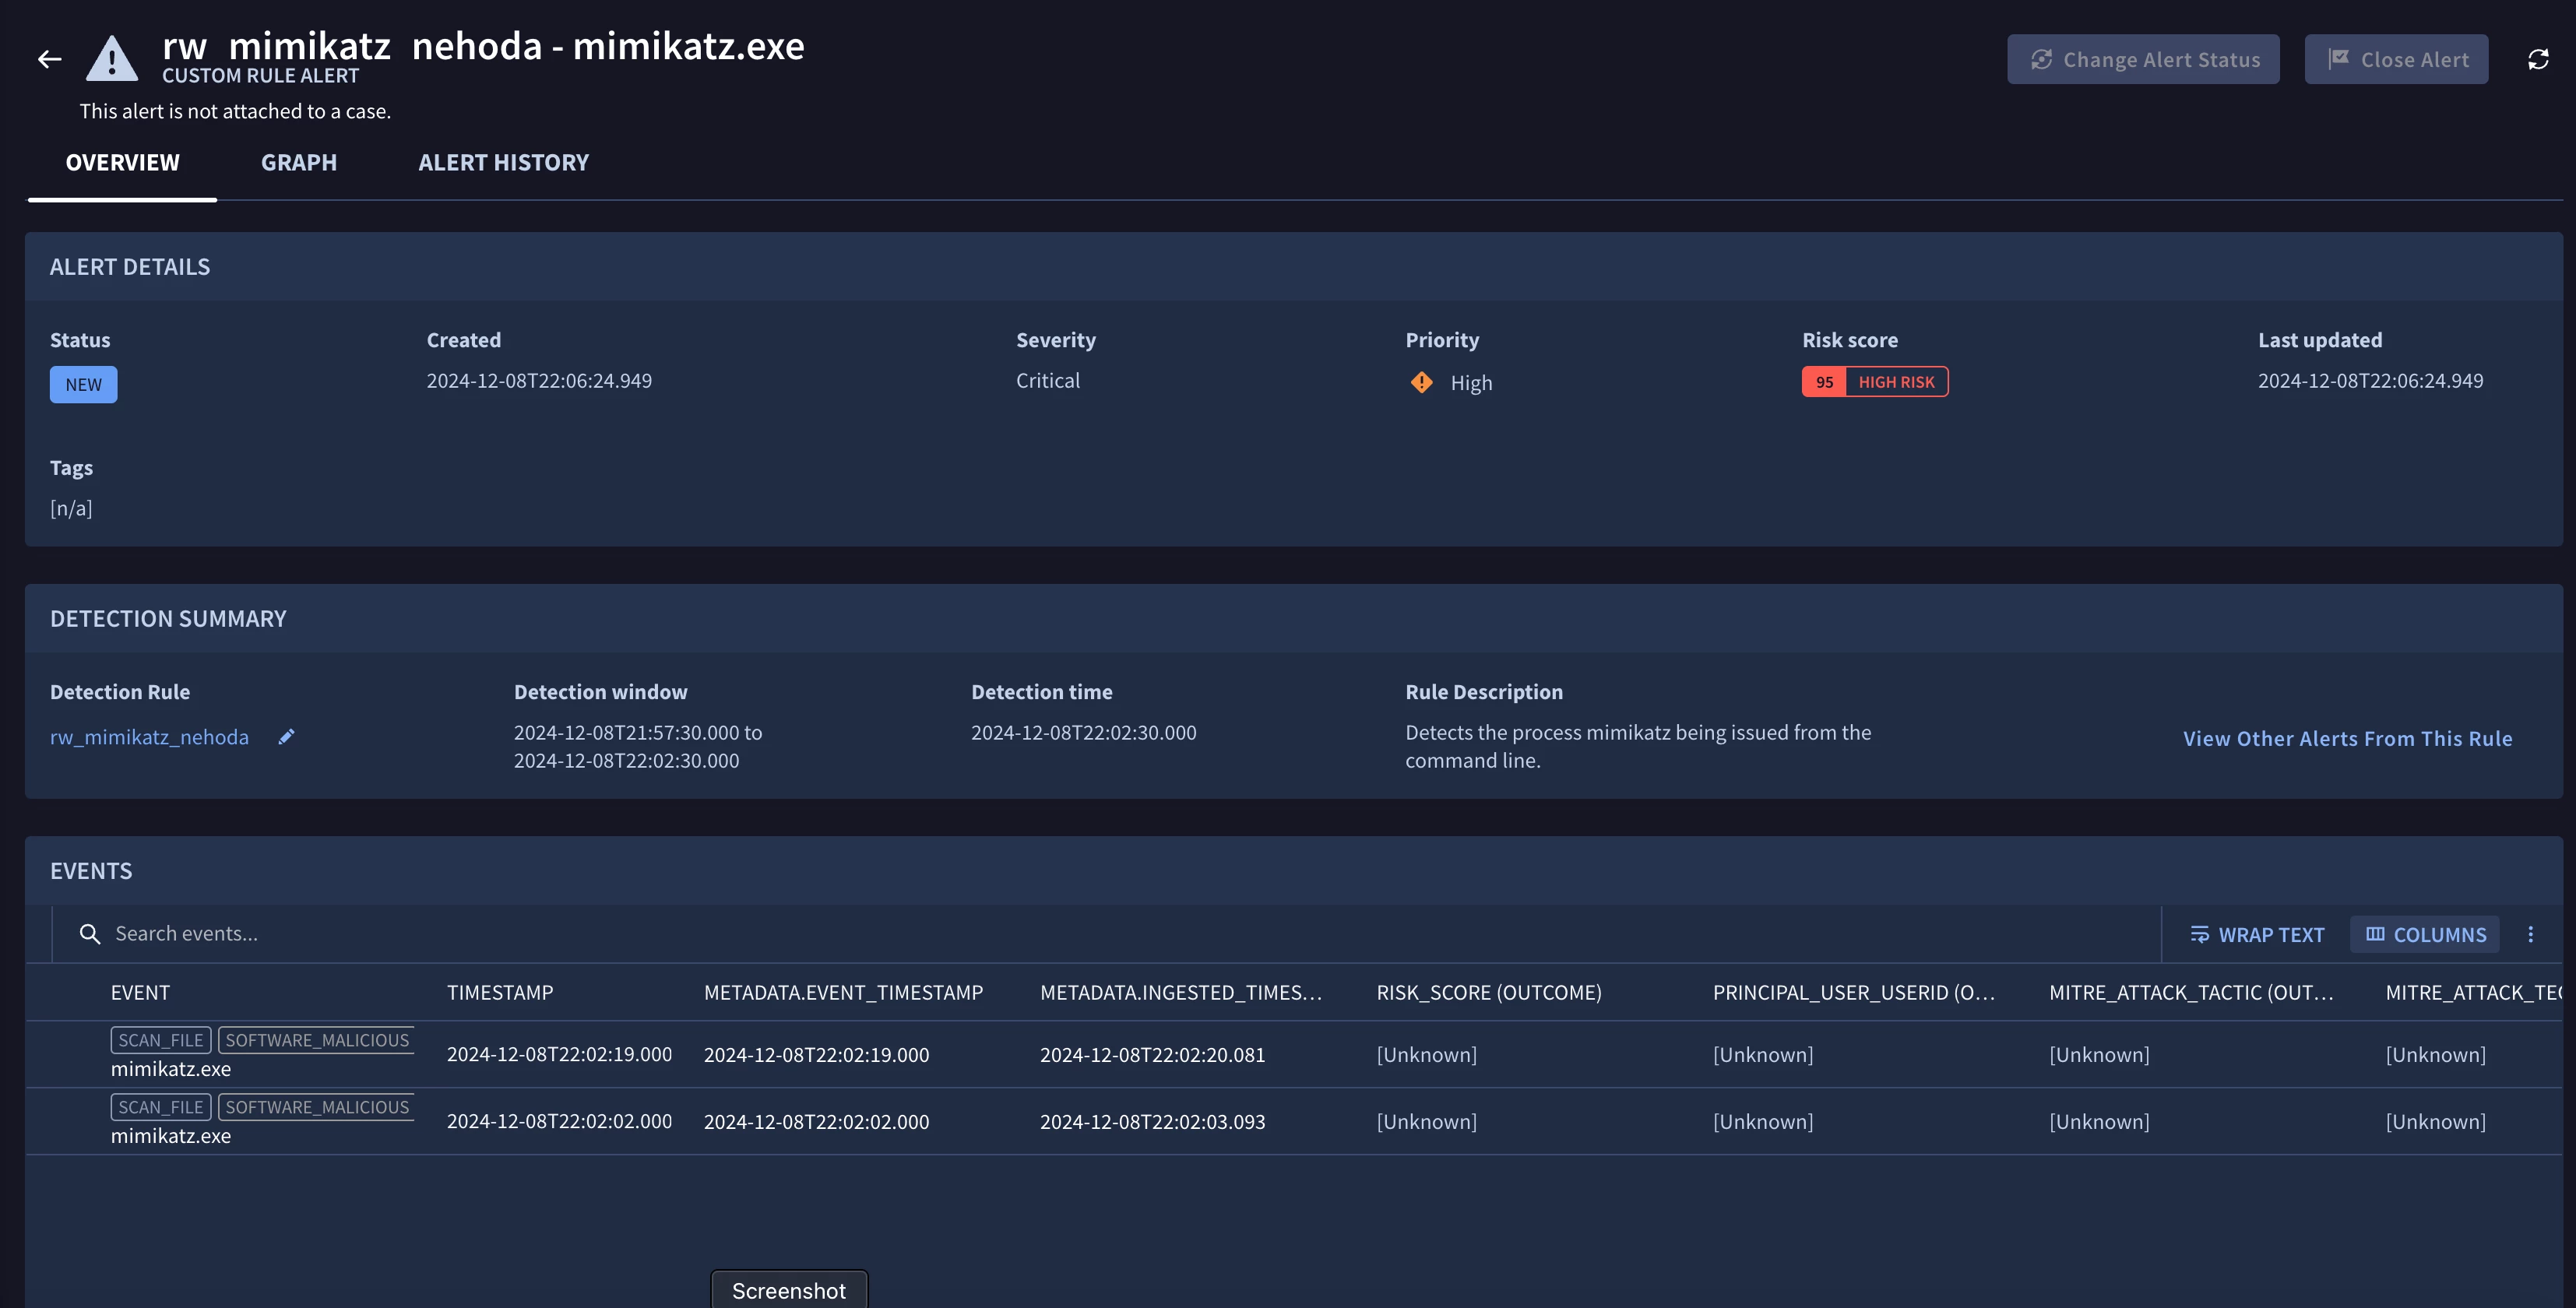
When looking at SIEM > Rules & Detections > Rules Editor, I can see when I created a rule or updated it.  

When looking to see when it last ran or when it will run next all I can find is this somewhat disappointing chart (image) which purports to show  "Matches," "Rule Runs" and "Run Errors."

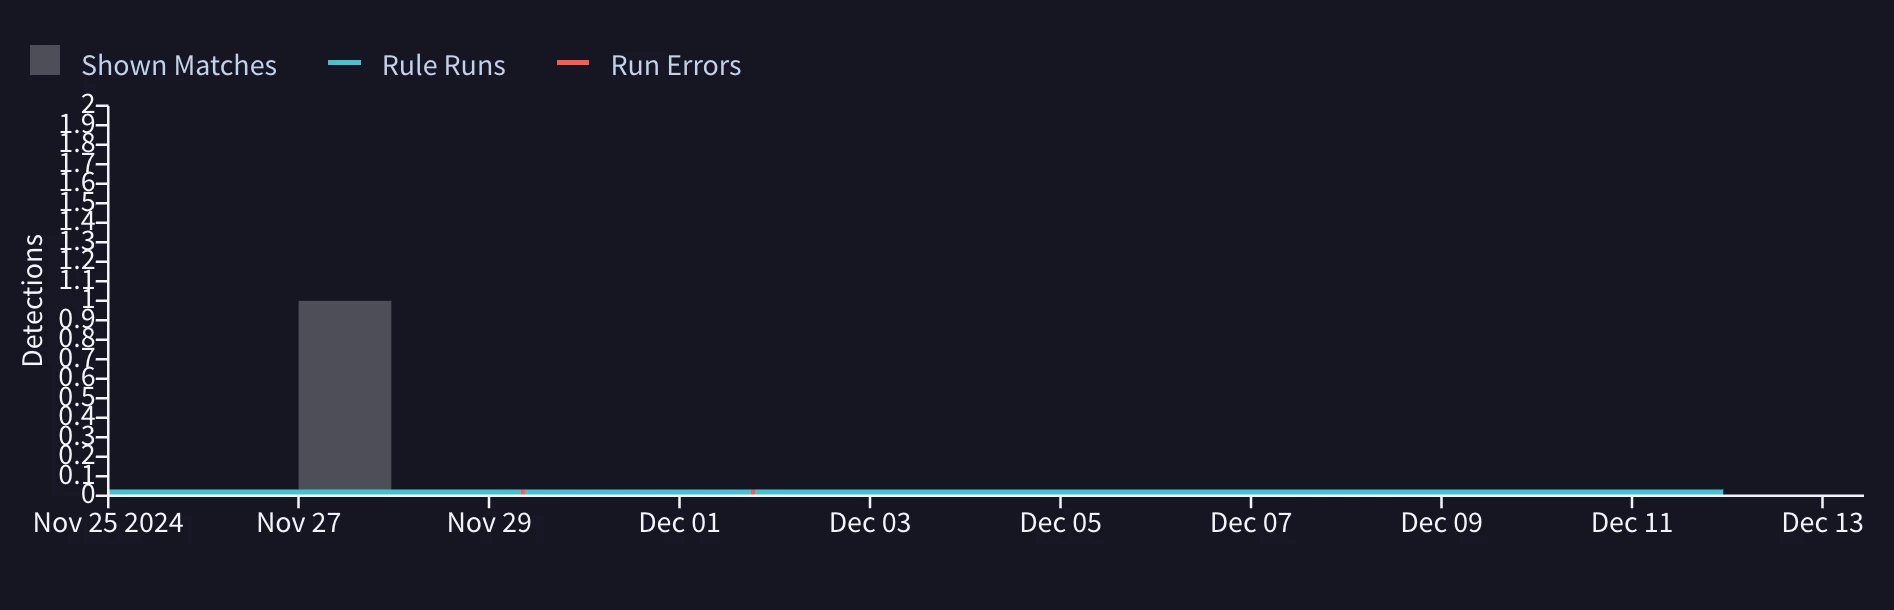
In the image above there's no hover - tool-tip or other info I can see to show me a timestamp of the rule run. 

What is a definitive way to find the history of my runs per rule and when the rule is next scheduled to run?


thanks


Hi Chris, 


The run time of your rules is something that is set by each customer.   They either run in almost real time(~10mins) , every hour or every 24 hours.  


I think the best place to see the historical data would be within the dashboard for rules and detections.   


Hi Chris, 


The run time of your rules is something that is set by each customer.   They either run in almost real time(~10mins) , every hour or every 24 hours.  


I think the best place to see the historical data would be within the dashboard for rules and detections.   


Dave - c'mon man 🙂

I know we set the frequency in the macth: on statements

I need to know when they actually ran and the chart info above is not helpful. - I need date/timestamps.

Between not knowing when my rules are running and the lags before ingested logs are available for detections I have very little confidence that my detection portfolio is functioning as intended.


The frequency in the match statement is different.  


I was talking about this dashboard and if you are part of the preview for native dashboards we could get even more granular.   


As for the run time selection, I was referring to this.  


The frequency in the match statement is different.  


I was talking about this dashboard and if you are part of the preview for native dashboards we could get even more granular.   


As for the run time selection, I was referring to this.  


Again - I need timestamps. Keep in mind my Splunk background and my expectation that my cron job actually makes my searches =run when I specify.

SIEM gives me no visibility (that I found yet) into when things actually happen. Depending on the log source, here is often notable lag between an event, when the log is ingested, when the log is available for detection search, when the detection search runs, when the alert window closes, when the SOAR makes a case.

I'm pretty anxious that my rules do what I want them to do when I want them to do it.

So - timestamps or I don't know when it happened.


We also have some potential within the API to list some data as well.  


I'm trying to get this dashboard to produce a little different of a result where it would give the exact time it ran over the past 48 hours and these looker dashboard have pretty large delay which change the results a little.  


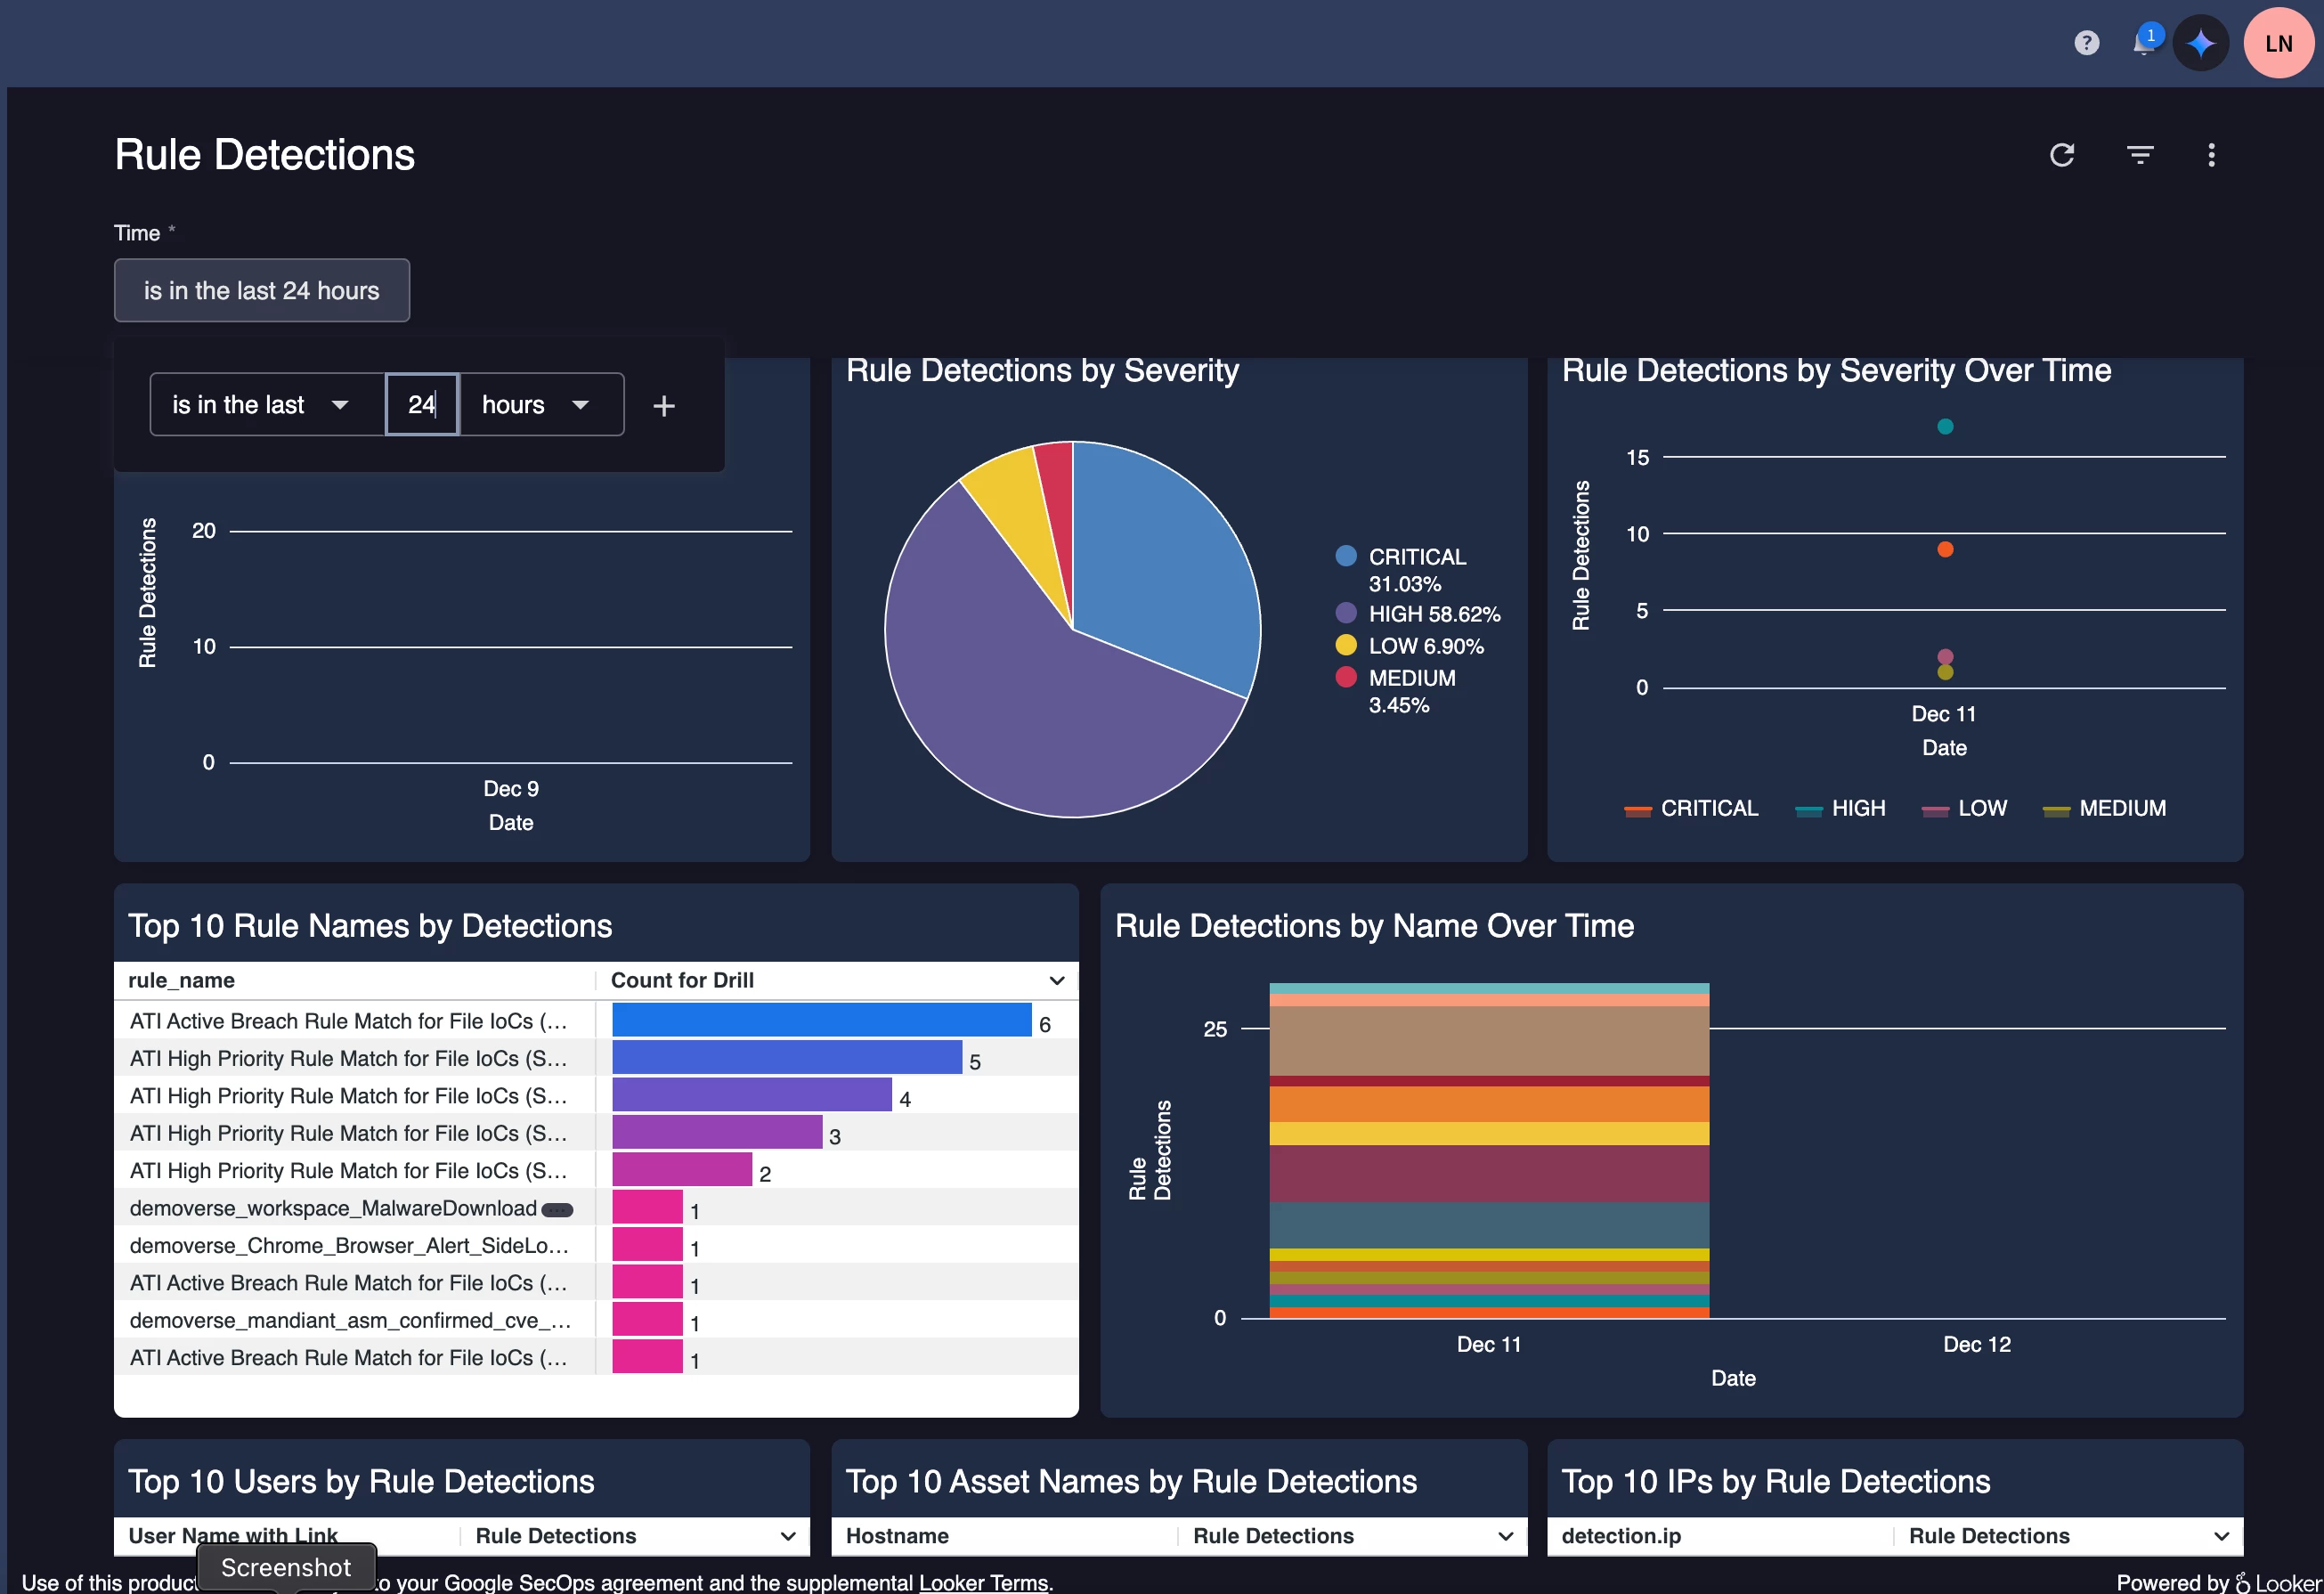
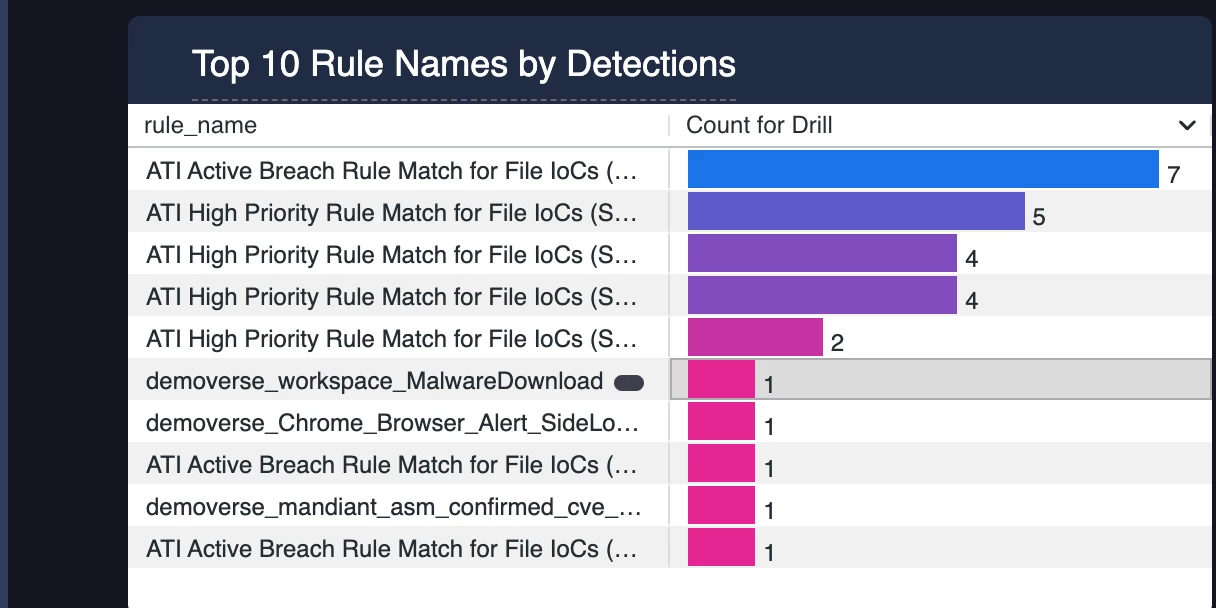
This is for the last 48hrs - so the top rule ran 7 times in 48 hours.  


From your image it ;looks like we don't know if the top rule "ran" 7x in 48h... it implies  there were 7 runs with detections.

I need timestamps when the rule started to run so I can compare to when rule is scheduled.

...and timestamps when the rule finished to compare to when the logs relevant to the detection search are actually available for detection search.

My next try  is to look in GCP admin logs for activity per a rule 


This is exactly what we provide - in these screenshots you will see the timestamp of the detection, the window of the detection time and the actual timestamp of the event.   We don't currently provide the actual run times or schedule of how that all fits together but there will be more coming to address this in 2025 H1.  However, I know that this rule runs real time or near real time which is every 10mins.   


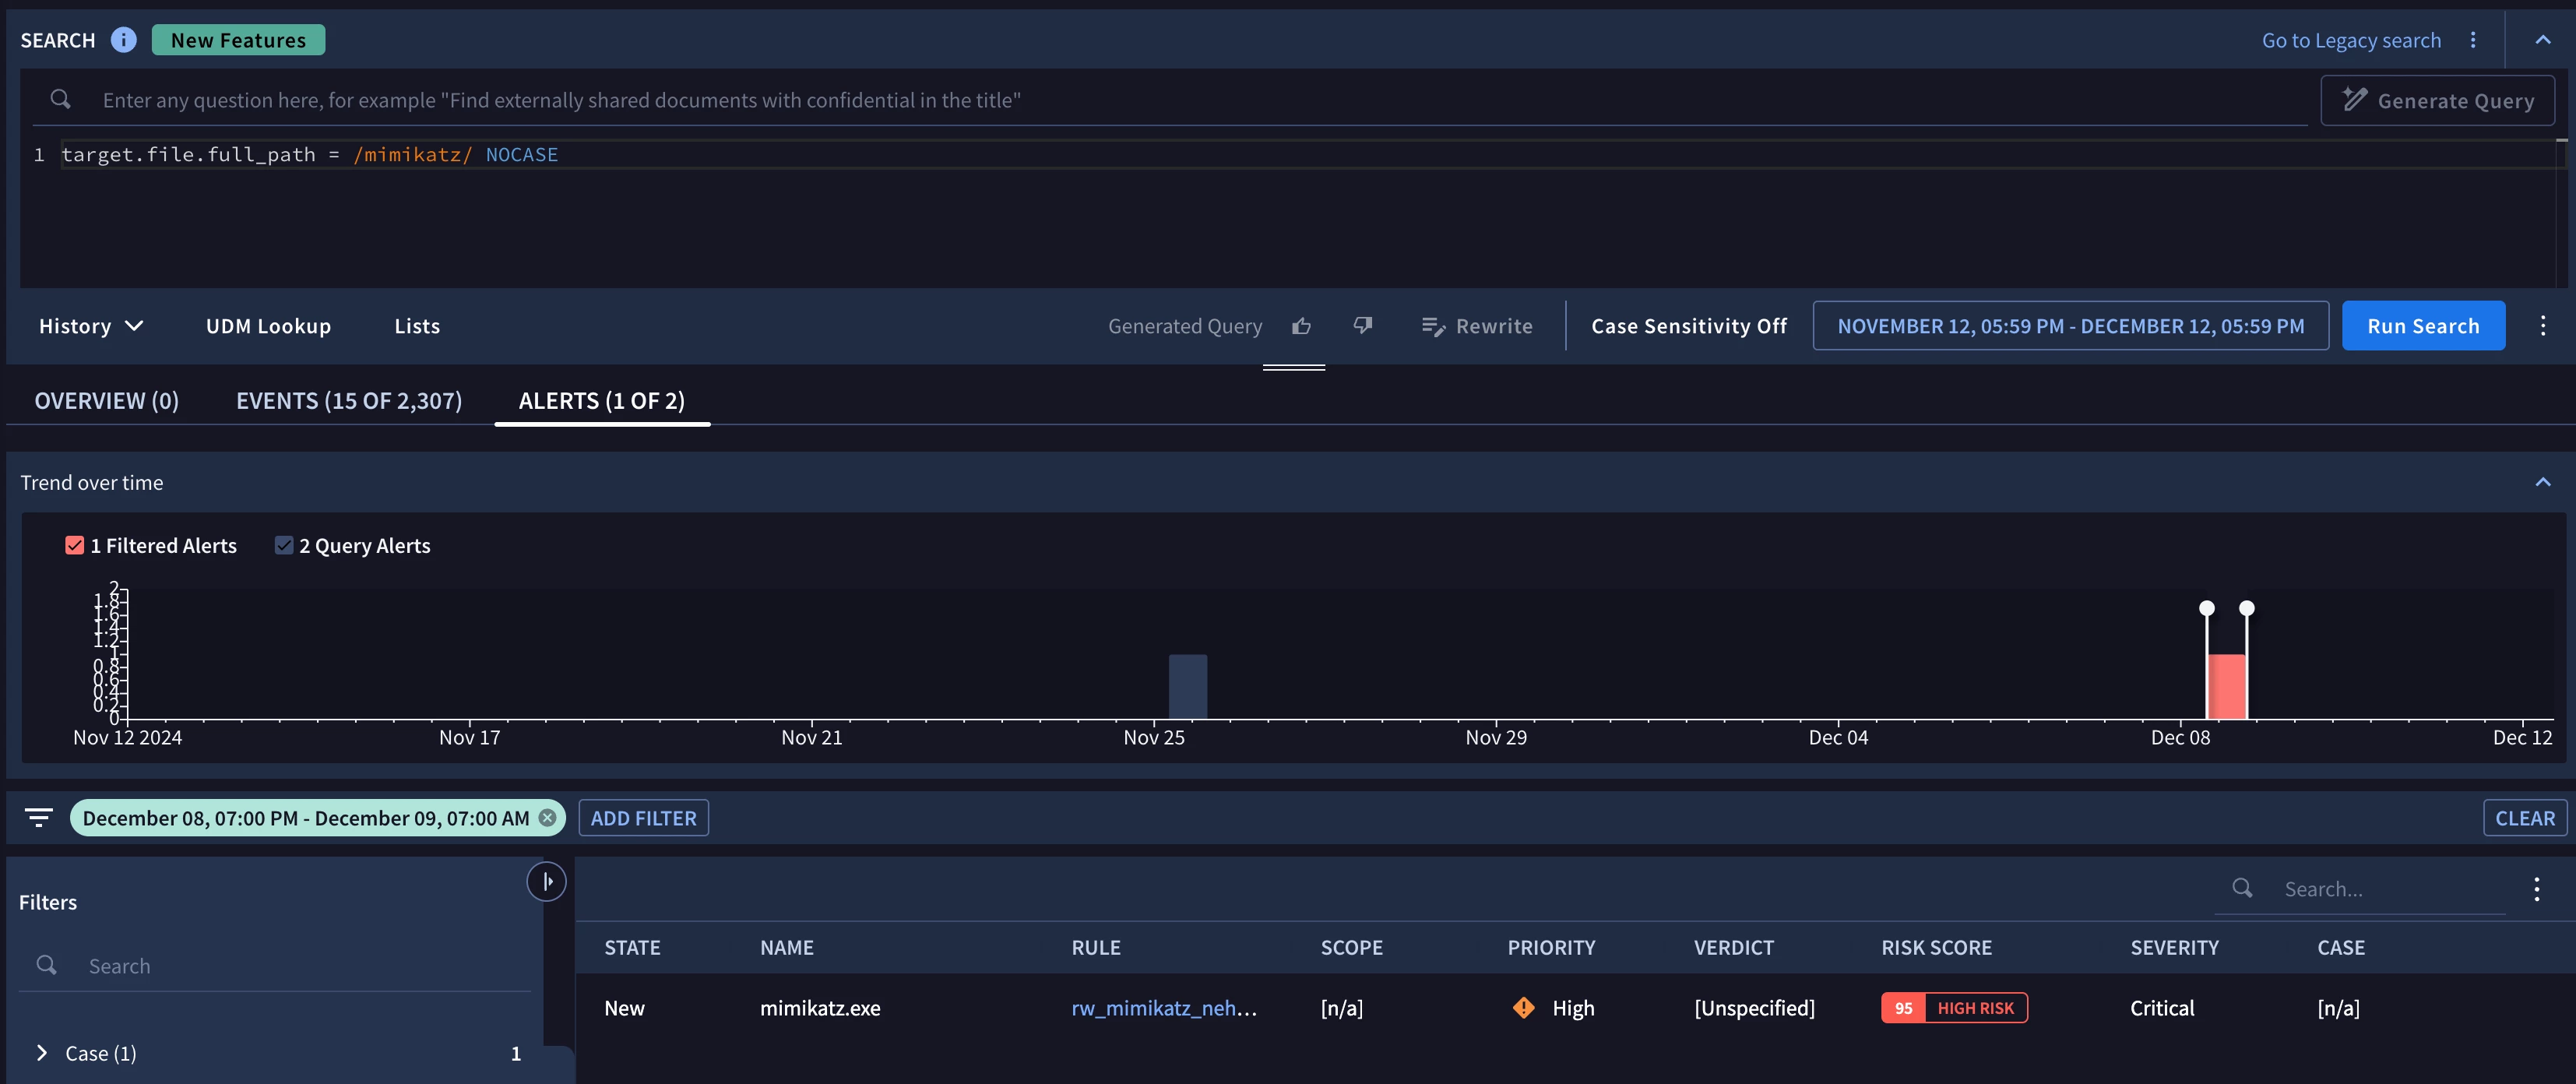
If you drill further into this you will see more information by doing a search for something specific in your rule in question ( whatever triggers your rule)  
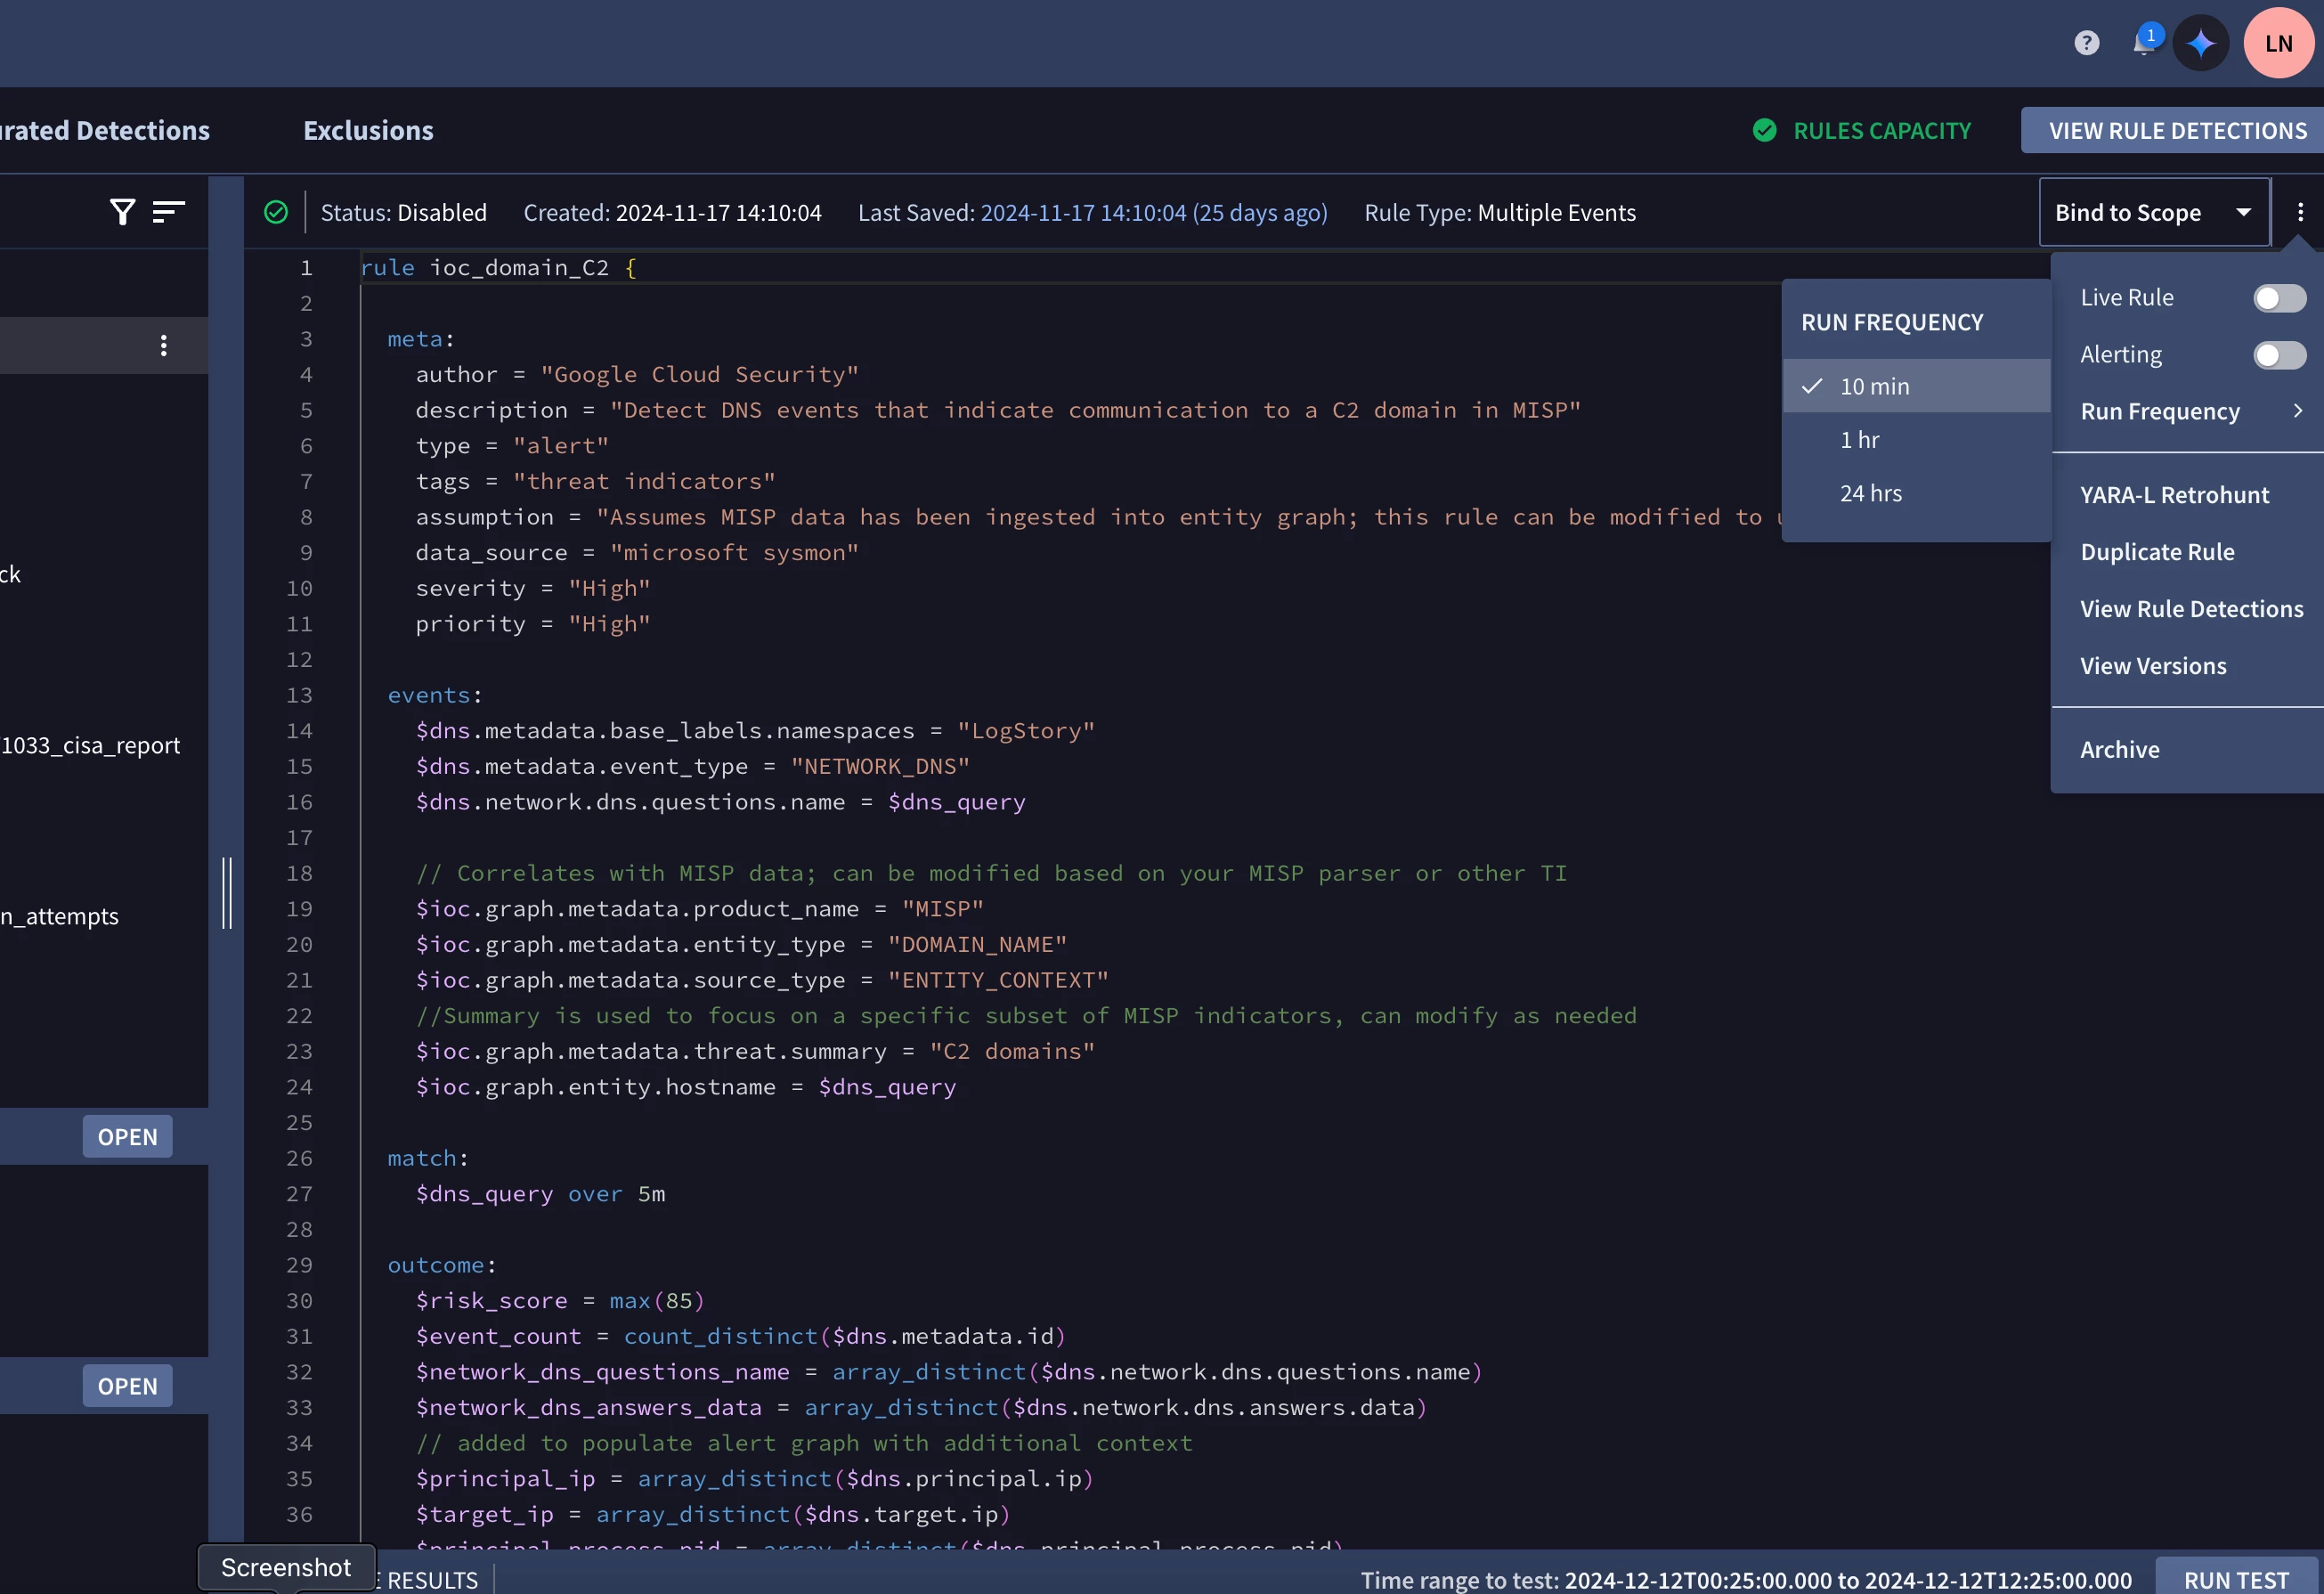
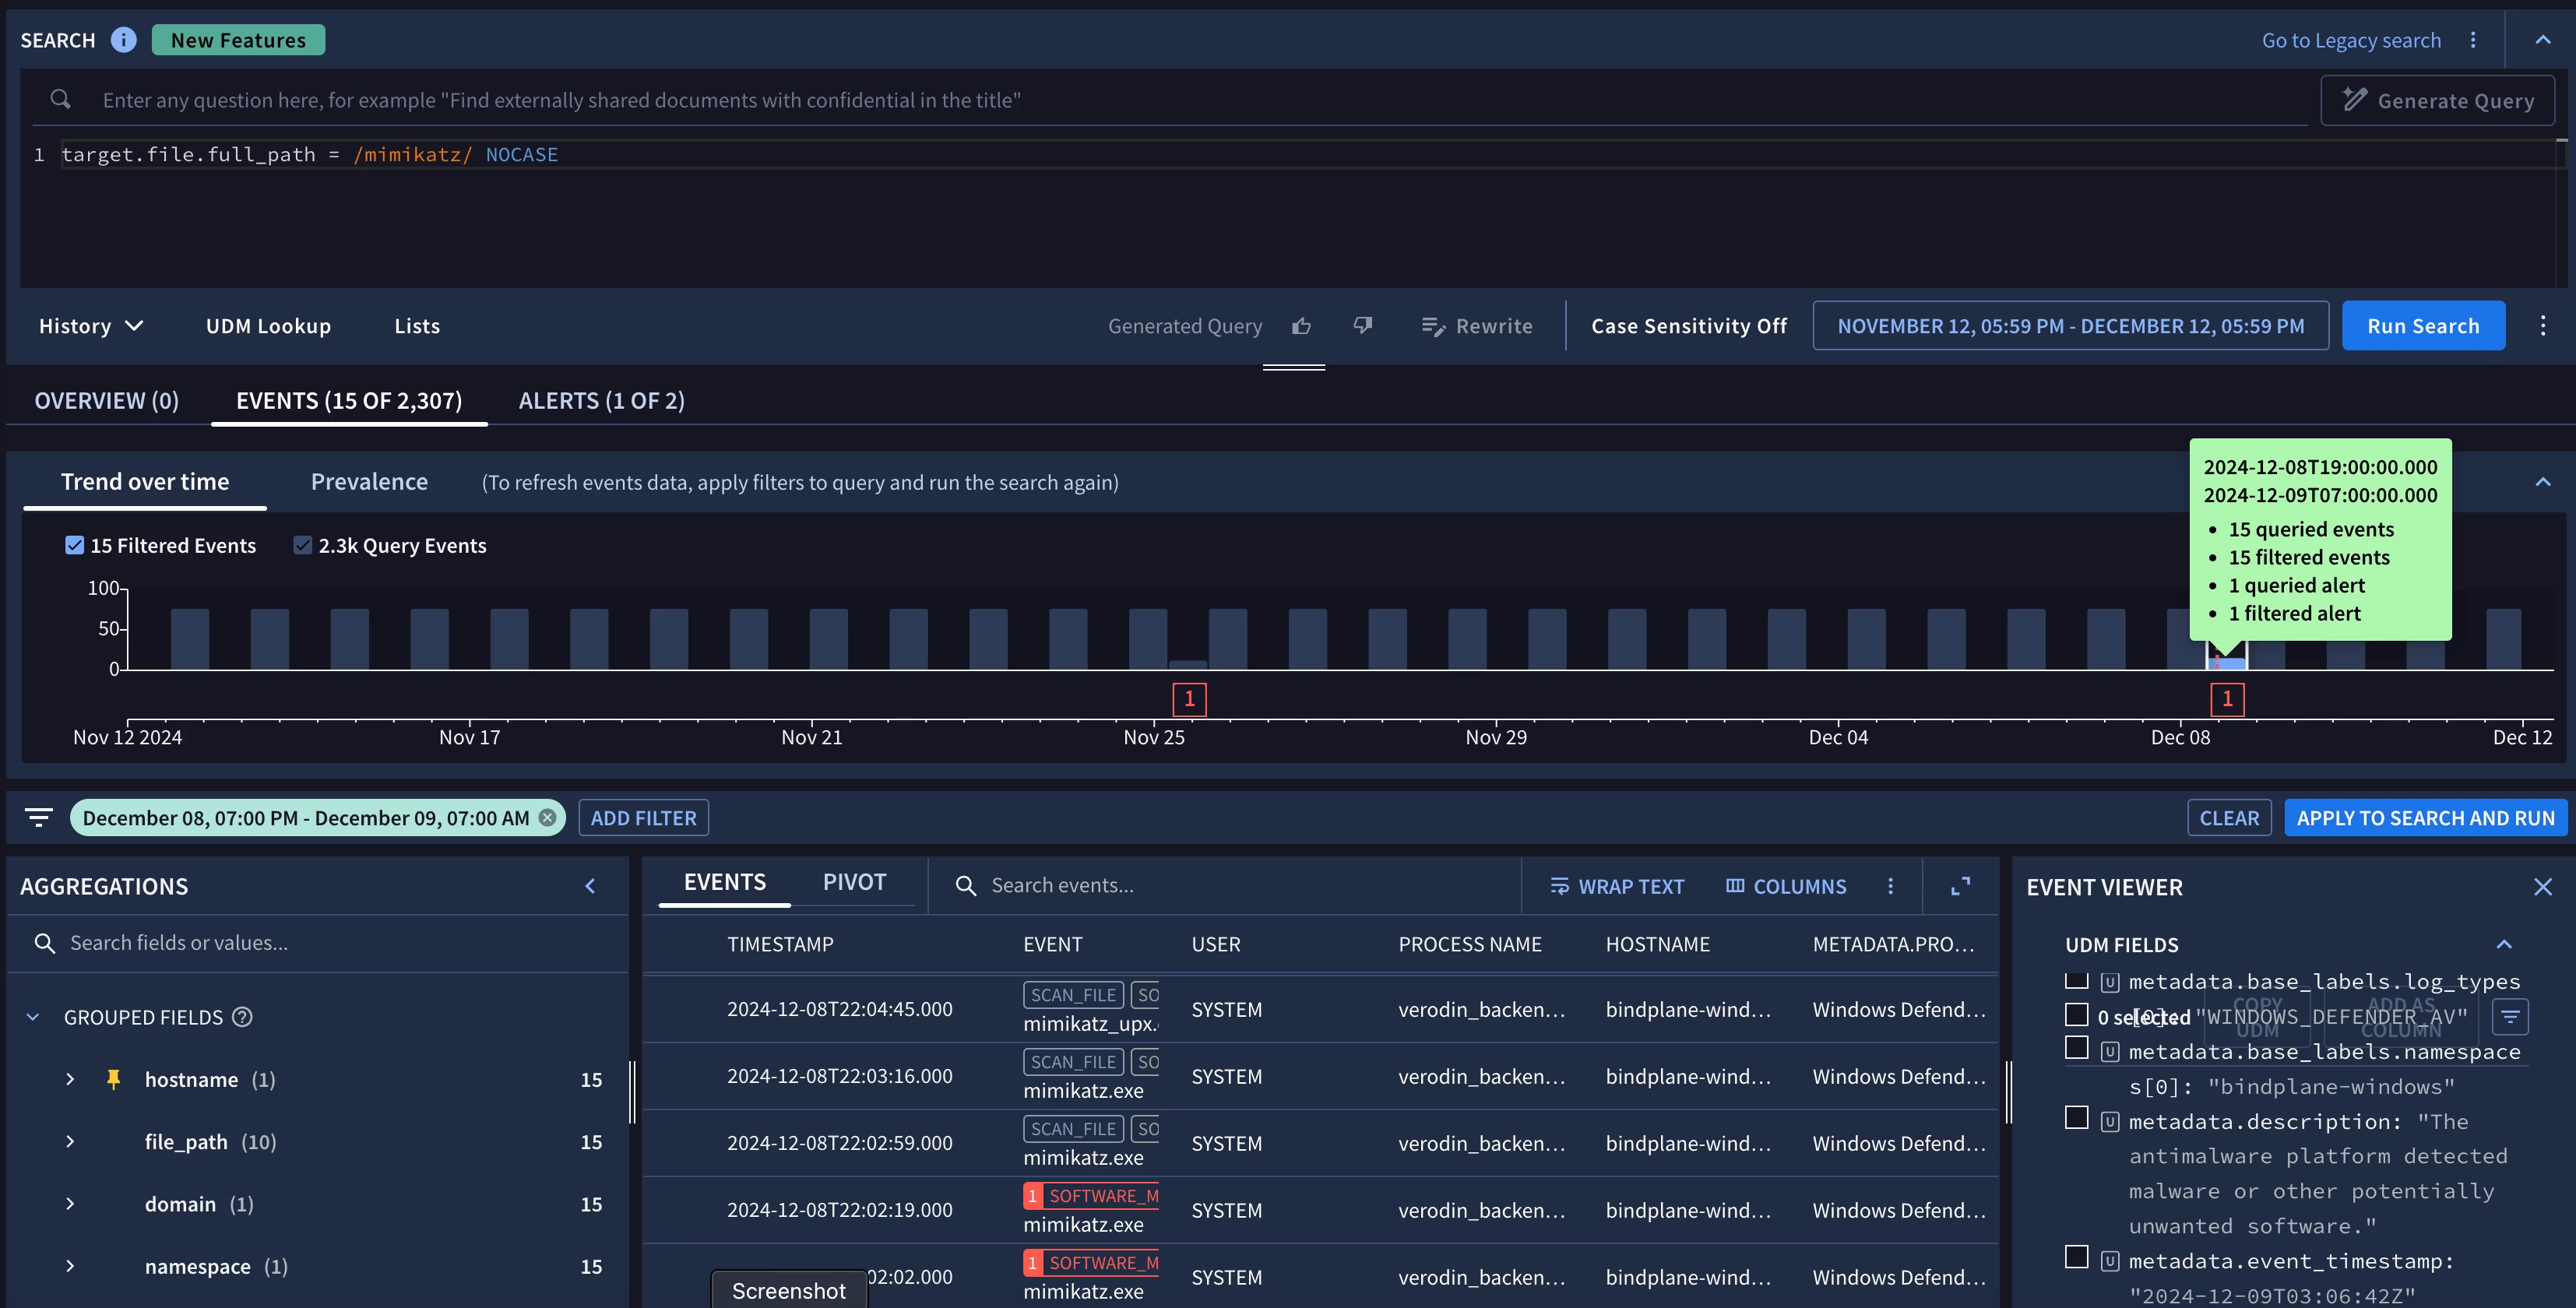
You see the timestamp of your event.  


Here, you further see the detection window and timestamp.  Detection time is 22:02:30


Actual event time is 22:02:02 


This is about as real time as it gets.  It took 18 seconds to create an alert.  In this time frame the rule ran.  You can also see the detection window here which is 5 minutes 


match:

$event_type over 5m


Action Times ( I know this because I ran the action that created the alert) 


  • Began At: 2024-12-08 22:01:59 EST

  • Ended At: 2024-12-08 22:02:40 EST


Chris, I recommend you check the Detection API for what you want. The GetDetection method returns this information for you:


Thanks for all the replies

For the time being, for what I needed, I found in the GCP audit logs - I think I'll check out the api to see if I can set  up a report for this

e.g. I took the timestamps from events based on rule-id searches:

metadata.product_event_type = "google.cloud.chronicle.v1alpha.RuleService.GetRuleDeployment"

target.resource.attribute.labels.key = "request_type"
target.resource.attribute.labels.value = "type.googleapis.com/google.cloud.chronicle.v1alpha.GetRuleDeploymentRequest"


target.resource.attribute.labels.key = "rc_method"
target.resource.attribute.labels.value = "google.cloud.chronicle.v1alpha.RuleService.GetRuleDeployment"


target.resource.name = "projects/568484606854/locations/us/instances/e4501020-c17d-49e1-b948-6bdc693c1ccb/rules/ru_12dbe541-947d-4cc8-878d-b7f4419a2dd8/deployment"


Hey Chris - so the larger community can see this - can you share any screenshots ore the query you are using in GCP to attain this data.  Good Job! 


Reply