

Author: Kyle Martinez, Senior Technical Solutions Engineer
Introduction:
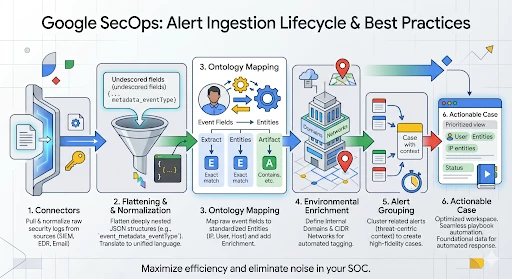
One of the primary challenges for any Security Operations Center (SOC) is managing the sheer volume and variety of alerts streaming in from disparate sources like SIEMs, EDRs, and mailboxes. The greater challenge, however, isn't just receiving these alerts—it’s normalizing them into a unified language and determining which ones are part of the same coordinated threat.
Google SecOps’ case management and ingestion engine are designed to solve this complexity by transforming raw data into structured, actionable intelligence. This guide provides a hands-on walkthrough of the Alert Ingestion Lifecycle. We will move from the initial configuration of a Connector to the nuances of Dynamic Environment Routing, Ontology Mapping, and Environmental Enrichment.
By the end of this guide, you will not only understand where SecOps cases come from but also how to utilize Blocklists and Grouping Mechanisms to eliminate noise and optimize your analysts' focus.
Case Management Data Model
Configuring a connector requires a foundational understanding of the Google SecOps data hierarchy. The system is designed to map the security event data from the source into a specific four-tier architecture: Cases, Alerts, Events, and Entities.
-
Cases: The Case is the top-level container in the platform. It is composed of one or more alerts that have been ingested from various data sources.
-
Alerts: An Alert is a specific security notification that lives within a case. Every alert is made up of one or more underlying security events.
-
Events: Events represent the base security data. Connectors are responsible for pulling raw security logs from third-party tools and translating them into these normalized events.
-
Entities: These are the "Points of Interest" extracted from events during ingestion, such as IP addresses, Usernames, Hostnames, or File Hashes.
Ingesting Alerts via Connectors
Connectors are the fundamental ingestion points for alerts into the Google SecOps platform. These Python-based applications' primary function is to pull raw security data from third-party products and translate it into normalized, actionable data. Once ingested and normalized, this data is presented as an alert in the case queue.
A single connector script acts as a template, allowing you to deploy multiple instances, each with its own unique configuration, to support different environments or specialized data streams
When configuring a connector, there will be common parameters as well as parameters specific to that connector.
Regardless of the third-party tool, most connectors require these foundational settings to manage the flow of data:
-
Environment: Defines the logical container where the alerts will reside.
-
Run Every: Sets the polling frequency (the interval between each data fetch).
-
Product & Event Field Names: These are the JSON keys within your raw data that identify the source tool and the type of activity.
-
Python Process Timeout: The maximum time (in seconds) the connector is permitted to run before the system terminates the process to prevent resource hanging.
Generally speaking connectors will have different parameters so it is best to consult the integration documentation to understand what is needed. The Chronicle Alerts Connectors logic specific for it’s API:
-
Identity and Access: User’s Service Account JSON or Workload Identity Email for authentication.
-
Fallback Severity: Severity used in the event the detection doesn’t have one
-
Max Hours Backwards: Defines how far back into the past a connector should look on the first connector run.
-
Max Alerts To Fetch: Number of alerts to fetch on each run
Filtering Alerts with Dynamic lists
The Chronicle Alerts Connector supports advanced filtering logic through Dynamic Lists. This feature allows you to define granular "inclusion" or "exclusion" rules at the point of ingestion, ensuring that only high-fidelity, actionable alerts reach your case queue.
You can filter alerts based on the metadata associated with the detection rule in the SIEM.
| Filter Key | Operators | Possible Values |
| Rule.severity | =, !=, >, <, >=, <= | Info, Low, Medium, High, Critical |
| Rule.ruleName | =, != | User-defined rule names |
| Rule.ruleID | =, != | Specific rule UUIDs |
| Rule.ruleLabels.{key} | =, != | Custom labels assigned to rules |
The Dynamic List uses a specific syntax to handle complex conditions:
-
OR Logic: Values placed on the same line and separated by a comma function as an "OR" statement.
-
AND Logic: Each separate line in the dynamic list is treated as a new "AND" condition.
For example if we want to only ingest alerts that are high or critical, we can use this rule:
Rule.severity = High, CriticalIf we want to ingest alerts that are not low severity and have the “Production” label we can use these rules:
Rule.severity != Low
Rule.ruleLabels.environment = Production
Dynamic Environment Routing
Environments in Google SecOps act as logical containers that provide strict data segregation. While most connectors default to a single static environment, Dynamic Environment Routing allows the platform to automatically assign an alert to a specific environment by extracting information directly from the event data itself.
To enable this in the Chronicle Alerts Connector, you must configure two specific parameters:
-
Environment Field Name: This is the key from the first event of the alert that contains your routing value. This can be found my navigating to an existing alert, click on the events tab, and expand the first event to see the fields
-
Environment Regex Pattern: This is the regular expression used to extract the exact string from that field. If you want to use the raw value of the field without modification, simply use .*
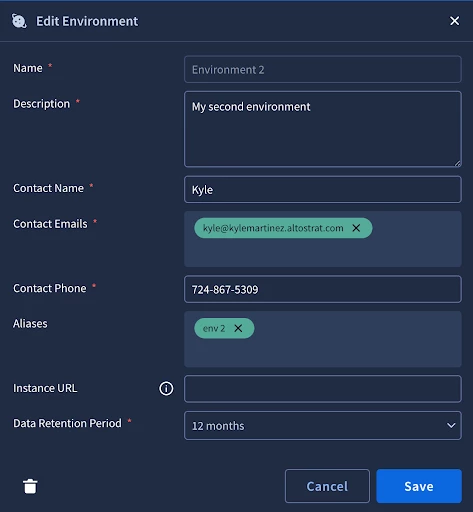
In certain scenarios, the raw value extracted from a security event may not align exactly with the defined name of your SecOps environment. To illustrate this challenge, let’s consider the following configuration example:
Environments
-
Environment 1
-
Environment 2
Connector Configuration
-
Environment Field Name: detection_outcomes_env_name
-
Environment Regex: .*
Alert Data Examples
-
Alert 1 - detection_outcomes_env_name = Environment 1
-
Alert 2 - detection_outcomes_env_name = env 2
In this instance, the platform will successfully route Alert 1 because the field value matches the environment name exactly. However, Alert 2 will fail to ingest properly because "env 2" is not a recognized environment within the system. To resolve this discrepancy, you can create an environment alias by going into SOAR Settings -> Environment -> Environment 2. Then add "env 2" as an alias for "Environment 2".
Ontology
Ontology is the framework that maps event fields to entities and artifacts in Google SecOps. By extracting dynamic objects like IP addresses and usernames, the platform can automatically track history, group related alerts, and trigger seamless playbook automation. Most connectors in the Content Hub come with pre-defined ontology mappings which can save a great deal of time.
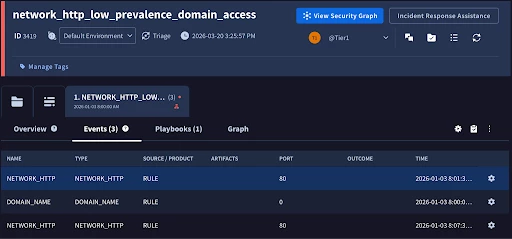
The most effective way to manage ontology is to work backward from an alert within SecOps. You can use an alert that is already in SecOps, or generate a test alert by using the testing tab from the connector configuration page. When on an alert, click on the Events tab associated with the alert, then click on the gear icon. This will pivot us to the ontology configuration for that specific event type.
Ontology is governed by a three-tier hierarchy that allows us to efficiently map once and apply everywhere.
-
Source: The highest level
-
Product Level: Populated by the Product Field name from the connector configuration
-
Event Type: Populated by the Event Field Name from the connector configuration.
This structure allows you to create mappings at the Product level that flow down to all event types, requiring you to only tweak specific mappings at the lower Event level where necessary.

The main table is the entities fields table. Here we have all of the entities that fit the model family. We will be working with the default model family in our example, but it’s important to note that other model families will have different sets of entities available depending on the use case.
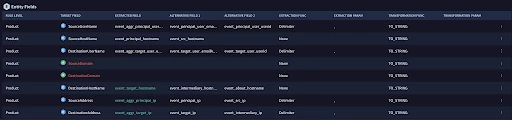
Since we got to the ontology page from the event, it passed over the event fields which is extremely helpful in understanding why entities were or were not created on a particular alert. The color of the fields are also very telling:
- Green - Field mapped, event has data
- Gray - Field mapped, no data in event
- Red - Field not mapped
Let’s check out DestinationHostName since it is mapped and our event has data
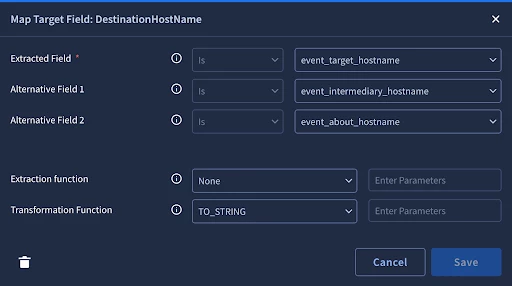
The first three fields are the fields to extract. The system will only extract the first match it finds. For entities (with the blue E on the table), we can only do exact comparison. For artifacts (with the green A on the table) we can use comparisons like contains or starts with to extract multiple entities from one field. For example when we do the event flattening that we discussed earlier, a list of IP addresses might get flattened to ip_1, _ip_2 where we can use the ‘contains’. We also have extraction functions and transformation functions to help extract the right data in the right format.
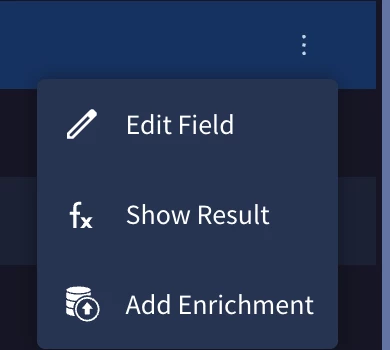
Sometimes the event data holds important enrichment data related to the entity. We can add these fields as entity attributes by clicking the menu option on the end of the row and clicking ‘Add Enrichment’. This will bring up a menu for you to select the relevant fields.
Environment Enrichment
While the ontology maps raw data to entities, we can enrich these entities based on defined domains and networks.
Domains
By default, the system treats all domains as external unless defined in Settings -> Environments -> Domains. Once set, new entities that match the defined domains will be treated as internal entities.
Networks
Networks can be configured in Settings -> Environments -> Networks. Networks are defined in CIDR ranges and can have priority. Priority is helpful so that we can generally define private ip ranges with just a few entries while allowing us the flexibility to define smaller networks that provide more context to the case like business critical servers.
Blocklist
The blocklist is a feature used when your ontology mapping is technically correct, but specific entities are providing redundant or counter-productive information. The blocklist allows you to explicitly exclude entities from specific platform behaviors.
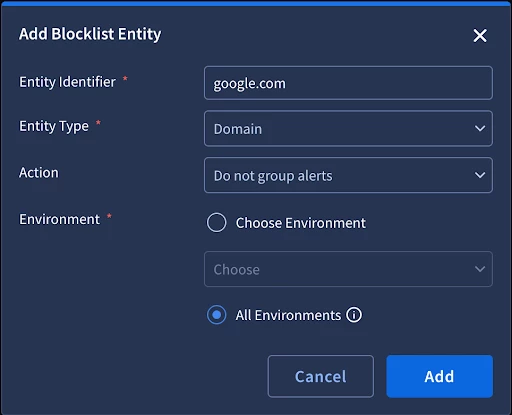
Do Not Group
A common challenge is ensuring unrelated alerts do not get grouped in the same case because they share the same common, but irrelevant entity. For example, some phishing use cases involve a centralized mailbox. The issue is that the central mailbox will be created as an entity and will group all related phishing emails together. By creating a blocklist entry to not group on the central mailbox entity, the platform will skip grouping on the mailbox entity and instead group on relevant entities to provide a clearer picture of the threat.
Do Not Create
The blocklist also allows you to choose not to create specific entities. This is ideal for high-volume, known-safe indicators that clutter the entity graph and distract the analyst.
Alerts Grouping
Alert grouping is the mechanism that automatically groups alerts into cases. The goal is to provide an analyst with a threat centric picture with the complete context in the investigation. In order to achieve this, we will need to tune the alert grouping rules to fit our use cases. We are able to define global settings such as the maximum number of alerts to group into a case and the timeframe of grouping alerts. The rules themselves follow a hierarchy of alert type, product, and data source. They can be configured to not group entirely or to only group on select entities. Our alert grouping documentation walks through the details and provides great examples.
Alert grouping is the mechanism that automatically clusters related alerts into a single case. The ultimate goal is to provide the analyst with a threat-centric picture that contains the complete context of an investigation in one view.
Global Settings
-
Timeframe for Grouping: Defines the sliding window during which subsequent alerts will be appended to an existing case.
-
Maximum Alerts per Case: Sets a limit on how many alerts can be bundled together.
Grouping Hierarchy
Grouping rules follow a strict hierarchy to ensure the most specific logic is applied first:
-
Alert Type: The most granular level. This value would be mapped to the detection rule name for alerts coming from the Chronicle Connector.
-
Product: Based on the source too. Alert from the Chronicle connector would have this hardcoded as ‘RULE’.
-
Data Source: This is the source of the data. For the Chronicle Connector it would be ‘GoogleChronicle’
Grouping Strategies
Within these rules, you have the flexibility to determine how the alerts group together:
-
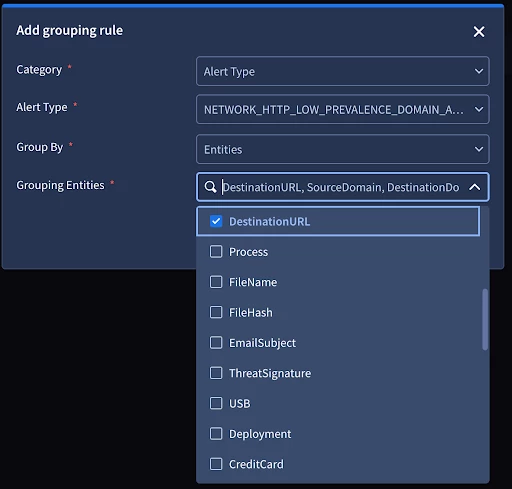
Selective Entity Grouping: You can choose from a drop down list of entities to group alerts only when they share specific entities.
-
Do Not Group: You can configure a rule to bypass grouping entirely by configuring it to not group
By effectively tuning these rules, you ensure that your analysts are investigating consolidated threats rather than chasing individual logs. The alert grouping documentation walks through great examples on how to configure rules for different use cases.
Conclusion
This concludes our guide on Google SecOps connector and alert data model best practices. We have traced the complete ingestion lifecycle—from the initial four-tier data model and connector configuration to the advanced tuning of Ontology, Environmental Enrichment, and Alert Grouping.
By mastering these configurations, you ensure that raw security telemetry is not just collected, but actively transformed into standardized, high-fidelity Entities. These entities serve as the essential foundation for:
-
Case Management: Providing analysts with a clean, searchable, and threat-centric workspace.
-
Noise Reduction: Utilizing blocklists and grouping logic to prevent alert fatigue.
-
Automation: Powering playbooks with the precise, enriched data required for automated remediation.
Implementing these foundational elements correctly will significantly optimize your SOC operations, ensuring that every case in your queue is actionable and contextually rich.