



Author: Ivan Ninichuck, Google Cloud, Technical Solutions Engineer
For years, Security Operations Centers (SOCs) have relied on vanity metrics—alert counts, raw ingestion volumes, and basic averages—that fail to communicate actual risk reduction to the business. Most SIEM dashboards fail to influence leadership because they measure computation, not security. A dashboard showing "10 Billion Events Processed" or "500 Tickets Closed" is an operational expense report, not a measure of resilience. The transition to a "Narrative SOC" requires moving away from the "What happened?" dashboard toward a "How effectively are we mitigating our primary threat models?" narrative.
The Illusion of the Global Average
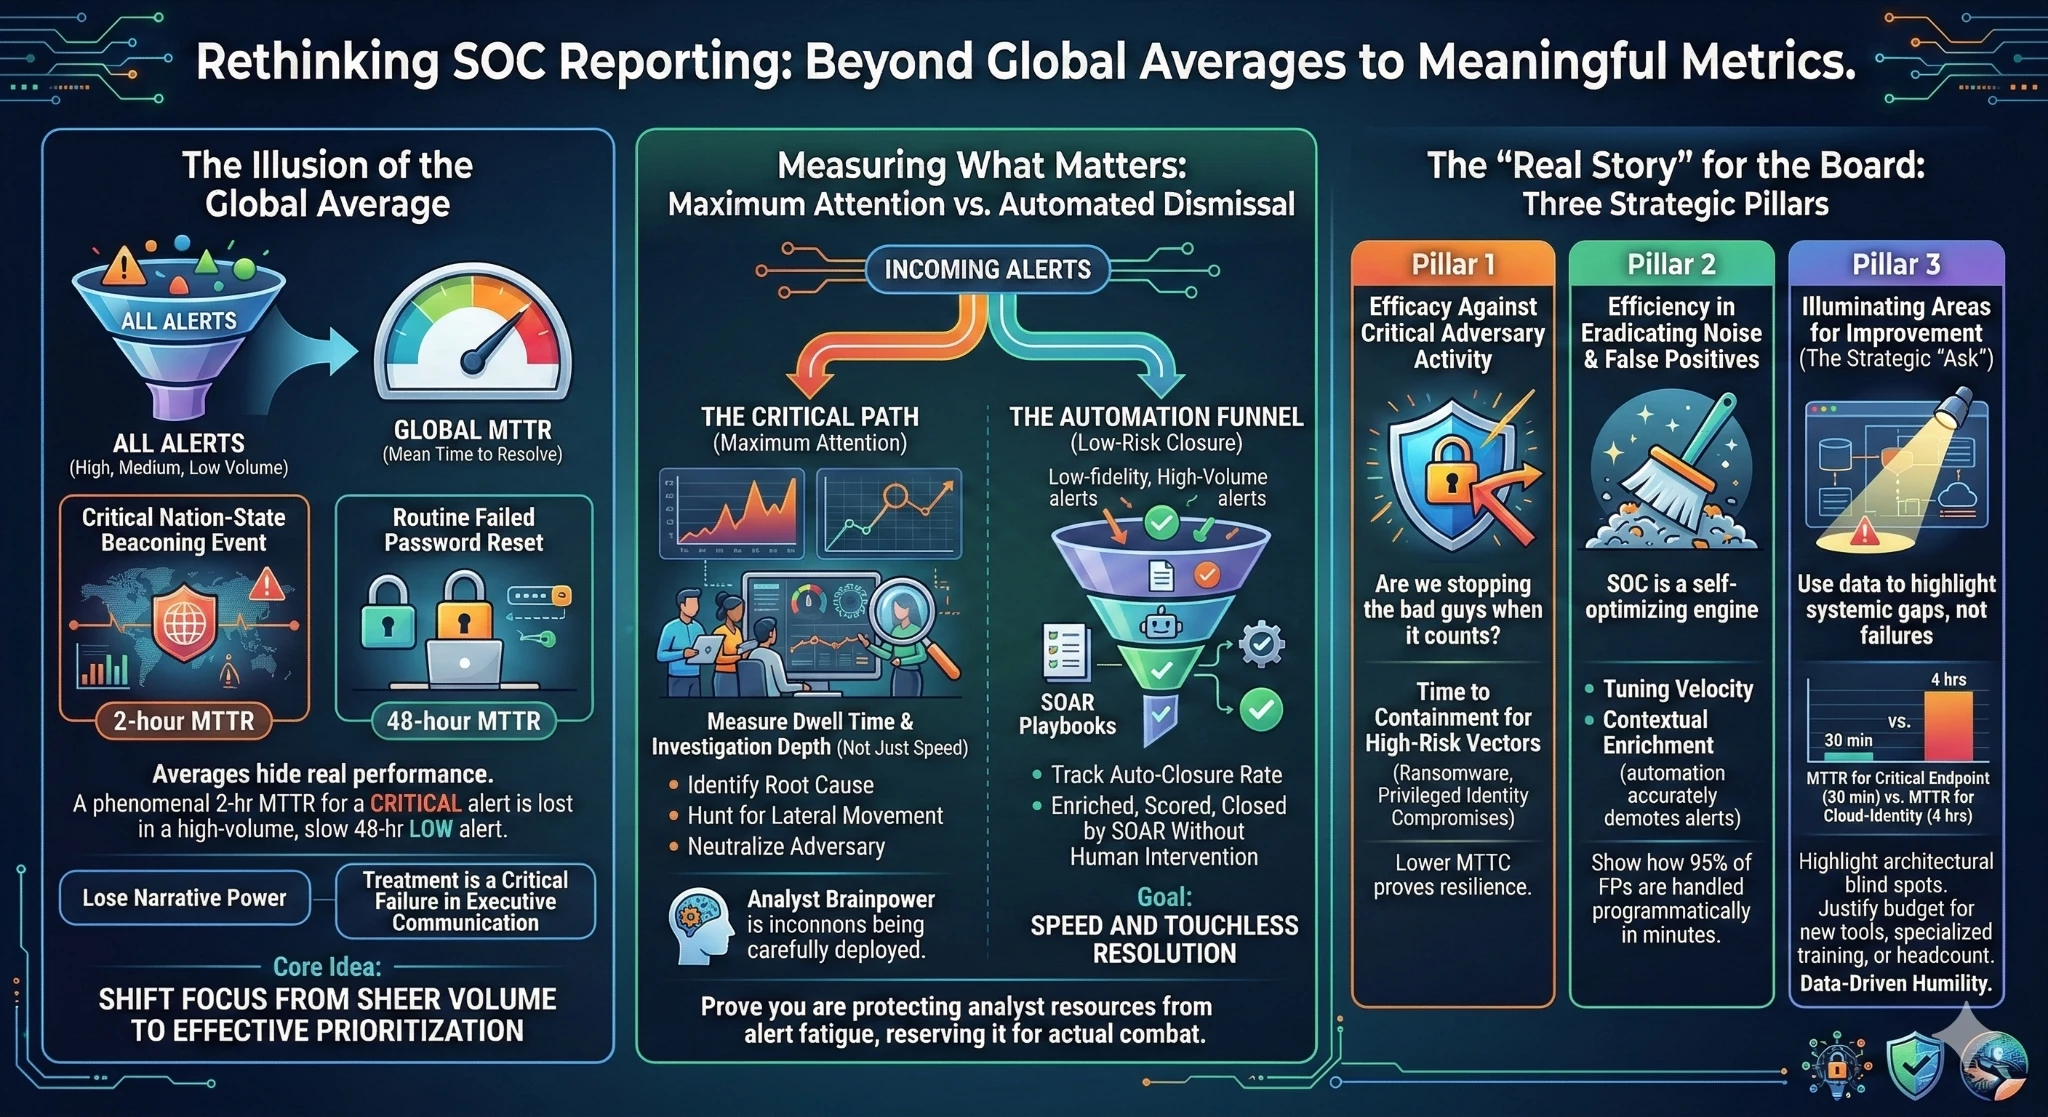
Historically, SOCs have reported global averages to leadership—a single Mean Time to Resolve (MTTR) that blends every alert across the enterprise into one easily digestible, yet entirely misleading, number. Treating a potential nation-state beaconing event the same as a routine, failed password reset is a critical failure in executive communication. When you aggregate everything, your metrics lose their narrative power. A phenomenal 2-hour MTTR for a Critical alert is overshadowed by a sluggish 48-hour MTTR for a Low-priority informational alert, resulting in a mediocre "average" that tells leadership nothing about your actual defensive posture.
To shift the focus away from sheer volume, your reporting must clearly demonstrate the SOC’s ability to effectively prioritize. Leadership doesn't need to know that you processed ten thousand alerts; they need to know that human cognitive load was spent exactly where it mattered most.
Measuring What Matters: Maximum Attention vs. Automated Dismissal
The core of modern SecOps reporting is demonstrating the dual-path division of your workflow. You must show how threats requiring maximum attention are isolated and relentlessly pursued, while low-risk, high-volume cases are systematically dismantled by automation.
To do this, your metrics should track the Divergence of Effort:
-
The Critical Path (Maximum Attention): Measure the dwell time and investigation depth of high-severity incidents. The metric here isn't just speed; it's thoroughness. How quickly did the team pivot from the initial detection to identifying the root cause, hunting for lateral movement, and fully neutralizing the adversary?
-
The Automation Funnel (Low-Risk Closure): Conversely, for low-priority alerts, speed and touchless resolution are the goal. Track the Auto-Closure Rate—the percentage of low-fidelity alerts that are enriched, scored, and closed by automation without a single human analyst ever looking at them.
By presenting these two metrics side-by-side, you prove to leadership that you are actively protecting your most expensive resource—analyst brainpower—from alert fatigue, reserving it for actual combat.
The "Real Story" for the Board
When presenting to the C-suite or the Board, abandon the operational minutiae. The real story that must be told revolves around three strategic pillars:
1. Efficacy Against Critical Adversary Activity Leadership wants to know: Are we stopping the bad guys when it counts? Frame your Critical priority metrics around the attack lifecycle. Show the "Time to Containment" specifically for high-risk vectors like ransomware precursors, privileged identity compromises, or data exfiltration attempts. If your MTTC for Criticals is dropping, you are empirically proving that the organization is becoming more resilient against catastrophic damage.
2. Efficiency in Eradicating Noise and False Positives You must prove that the SOC is not a static, reactive entity, but a self-optimizing engine. Showcase the multiple strategies your team uses to quickly deal with false positives. This includes metrics on:
-
Tuning Velocity: How quickly are noisy rules rewritten or suppressed?
-
Contextual Enrichment: How often does automation accurately demote an alert's severity because the asset is non-critical or the behavior is historically normal for that user? Showing a high volume of False Positives isn't a failure if paired with a metric showing that 95% of them were handled automatically in under three minutes.
3. Illuminating Areas for Improvement (The Strategic 'Ask') The most powerful use of priority-based metrics is using them to highlight what isn't working, without framing it as a failure of the team. By breaking down response times by threat type and priority, you expose systemic gaps.
-
Example: "Our MTTR for Critical endpoint threats is 30 minutes, but our MTTR for Critical cloud-identity threats is 4 hours."
This is the ultimate narrative shift. You aren't just reporting numbers; you are using the data to highlight an architectural blind spot, paving the way to justify a new budget for IAM security tooling, specialized cloud-forensics training, or additional headcount in a highly specific area. Data-driven humility—showing exactly where the adversary still has an advantage—is the hallmark of a mature, narrative-driven SOC.
Part 2: The MTTx Alphabet Soup – Standardizing Your Timeline
The Lifecycle
To calculate Mean Time to Detect (MTTD), Acknowledge (MTTA), Contain (MTTC), and Resolution (MTTR), you must define the precise timestamps used in your architecture.
Consistency in the UDM and SOAR
Google SecOps provides highly granular timestamps that often confuse metrics if not standardized:
-
Event Time (metadata.event_timestamp): When the action actually occurred on the endpoint.
-
Collection Time (metadata.collected_timestamp): When the log aggregator picked it up.
-
Ingestion Time (metadata.ingested_timestamp): When Google SecOps parsed it into UDM.
-
Detection Time: When the YARA-L rule successfully matched and created a detection.
-
Case Creation Time: When Google SecOps SOAR instantiated the case.
Best Practice: * MTTD: Detection Time minus metadata.event_timestamp. (This exposes logging pipeline delays).
-
MTTA: SOAR First Action Taken (or Assigned to Analyst) - Creation Time.
-
MTTC: Time of SOAR Playbook Action: (Isolate Host/Block Hash) - Case Creation Time.
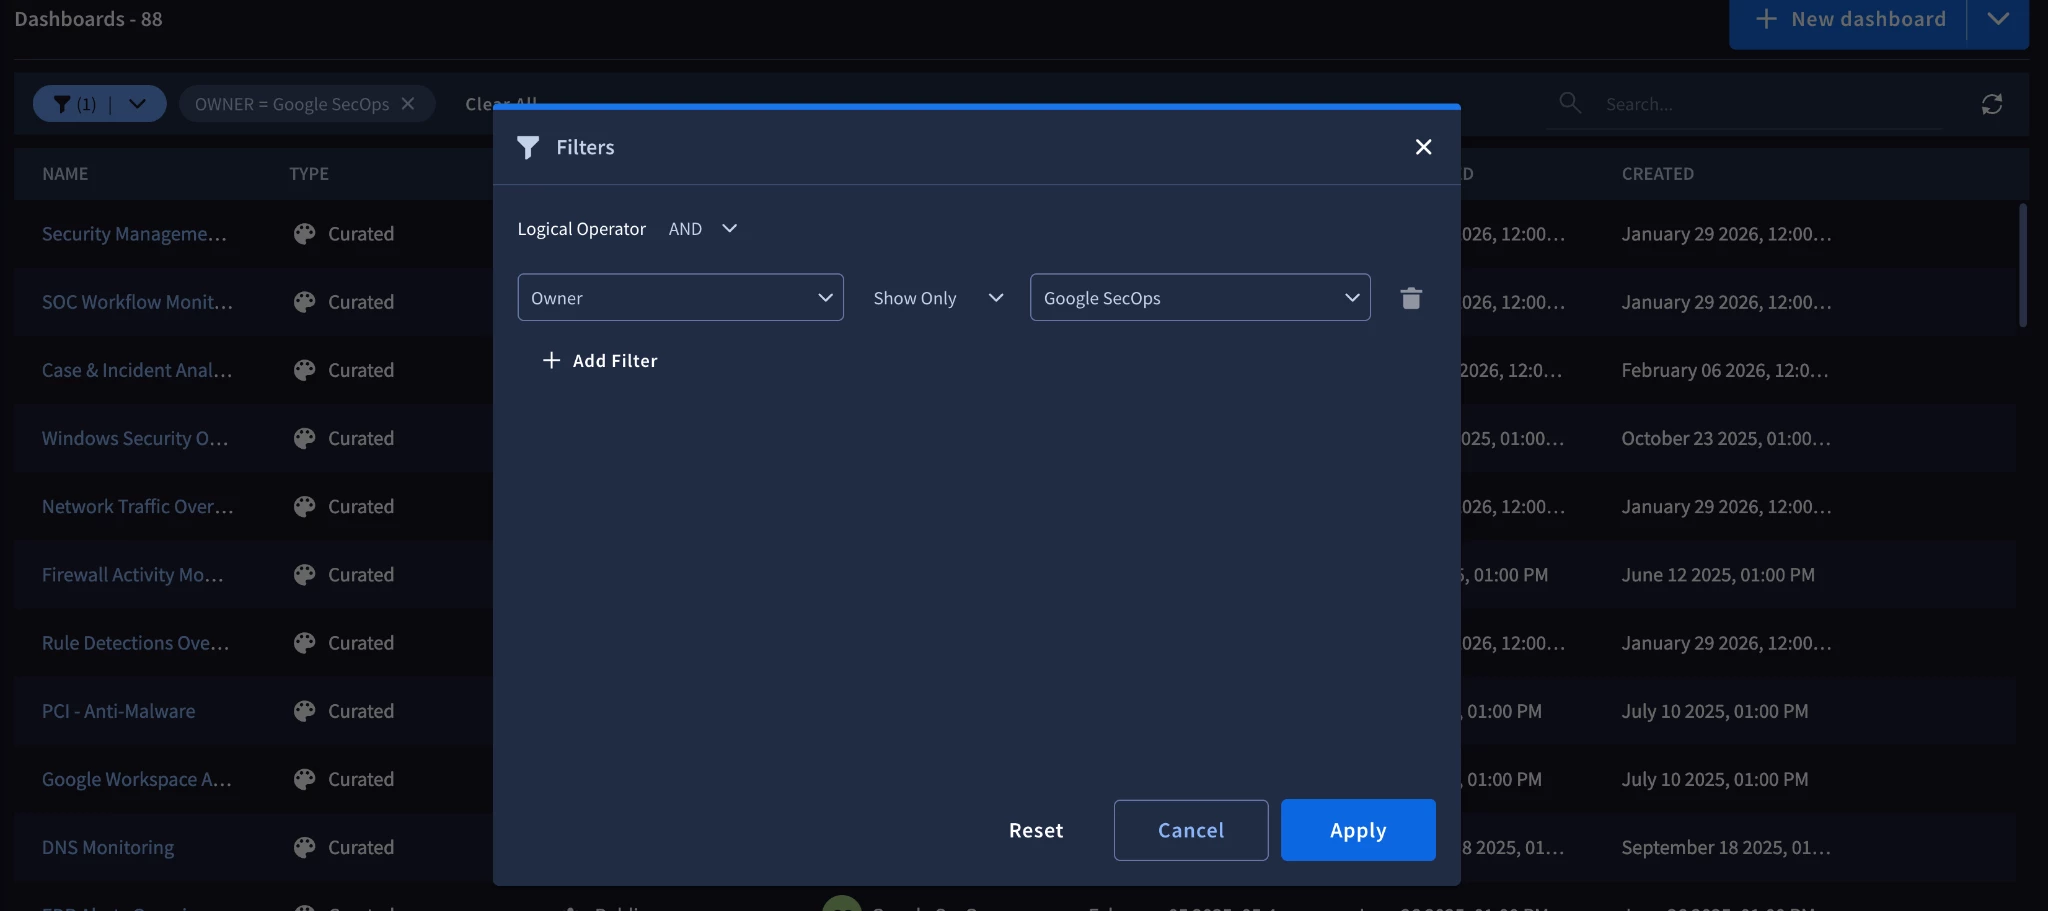
Let’s look at some actual curated dashboards in SecOps that will get you started. You can combine these types of dashboard queries around other capabilities such as case stages to provide data points that can be used to define your metrics. Go to the dashboards menu and filter it for ones that have Google Secops as the owner. This makes it easy to find out what dashboards are provided out-of-the-box(ottb)
SOC Workflow Monitoring:
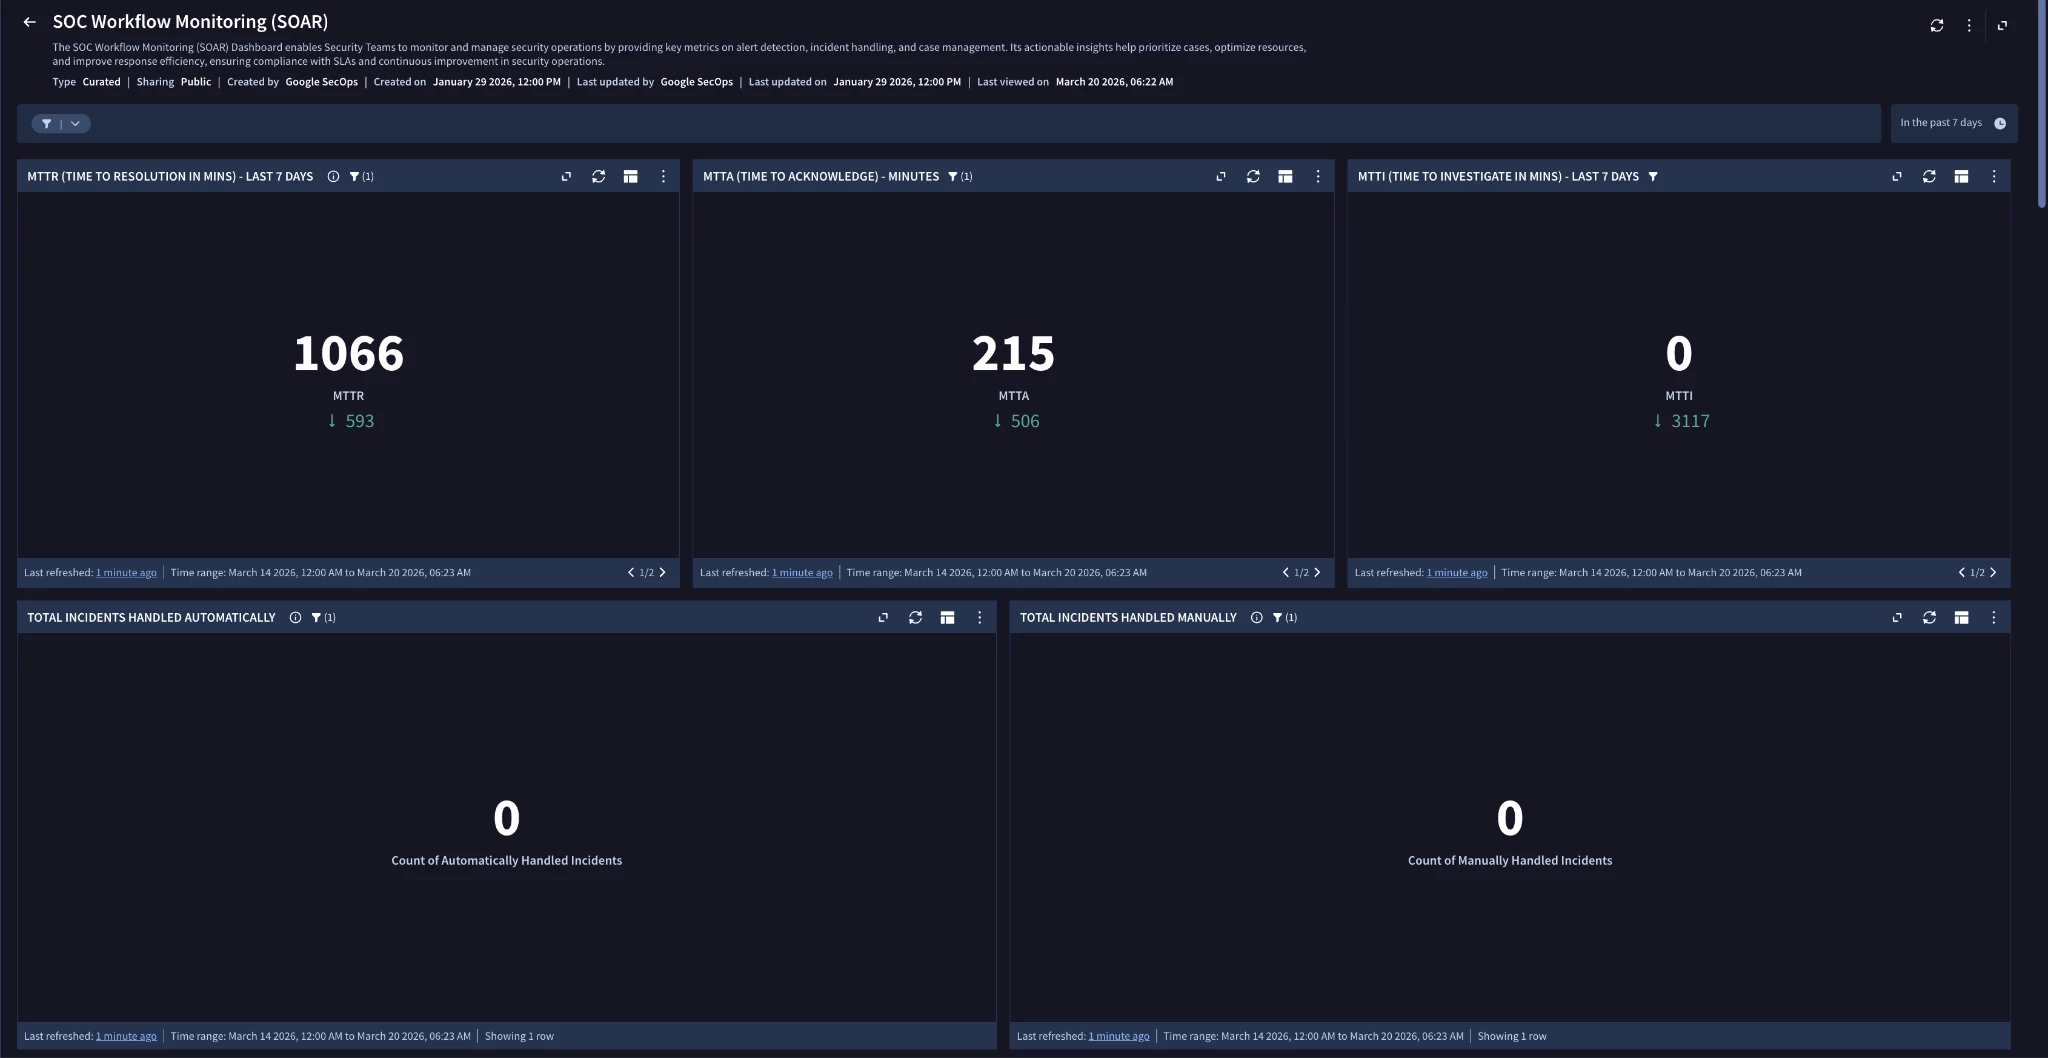
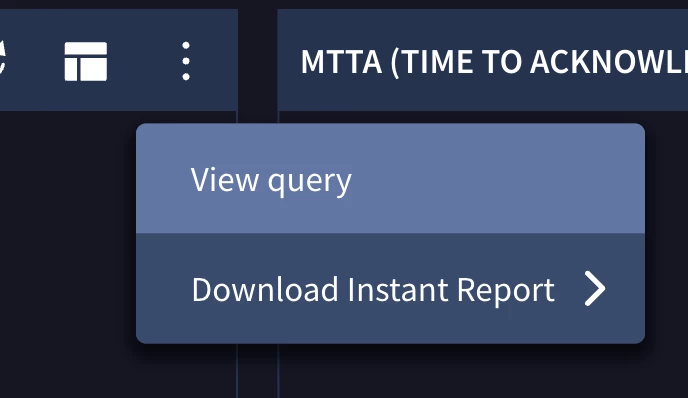
The SOC Workflow Monitoring is a good starting point for finding your base MTTX metrics. The image above only shows part of the dashboard there is more if scroll below. Let’s dive in and learn how these dashboards work. When you click on the three dots at the top right of any chart in the dashboard you see the option to view the query.
Query for MTTR(Mean-Time-To-Resolution)
Lets walk through the query first, you can see the whole query in the image below.
Stage stage1:
The query is broken into two stages. The first stage is first taking every case_id and aggregating them together by their ids. For each of the cases we then define some outcome variables to use in the next stage. First we set a close_time variable by using a conditional clause that looks for closed cases and gives their close time(notice we use a max for the case.history.event_time as this will find the last event in the case flow) and if they are open the value is assigned a zero. Next we create an array of the case statuses. Next we use the close_time followed by the first event in the case(notice this time we use min with case.history.event). We then have a conditional that makes it so only cases that have both a status of open and closed are returned by the search stage.
Root stage:
The match and outcome variables are now available for further use in the root stage of the search. The root stage uses the counts and time ranges from stage 1 to find the average of the close times. This provides the final meant-time-to-resolution.
stage stage1{
$case_id = case_history.case_response_platform_info.case_id
match:
   $case_id
outcome:
   $case_close_time = max(if(case_history.case_activity = "CLOSE_CASE", case_history.event_time.seconds, 0))
   $status = array_distinct(case_history.case_activity)
   $TTC = $case_close_time - min(case_history.event_time.seconds)
condition:
   arrays.contains($status, "CREATE_CASE") and arrays.contains($status, "CLOSE_CASE")

   }
outcome:
   $case_count = count($stage1.case_id)
   $MTTC = (math.round(avg($stage1.TTC)/60))
Expanding the Resolution Story
Let’s change the chart so it doesn’t just tell the overly general average. First we duplicate the chart and choose the pencil icon to edit.
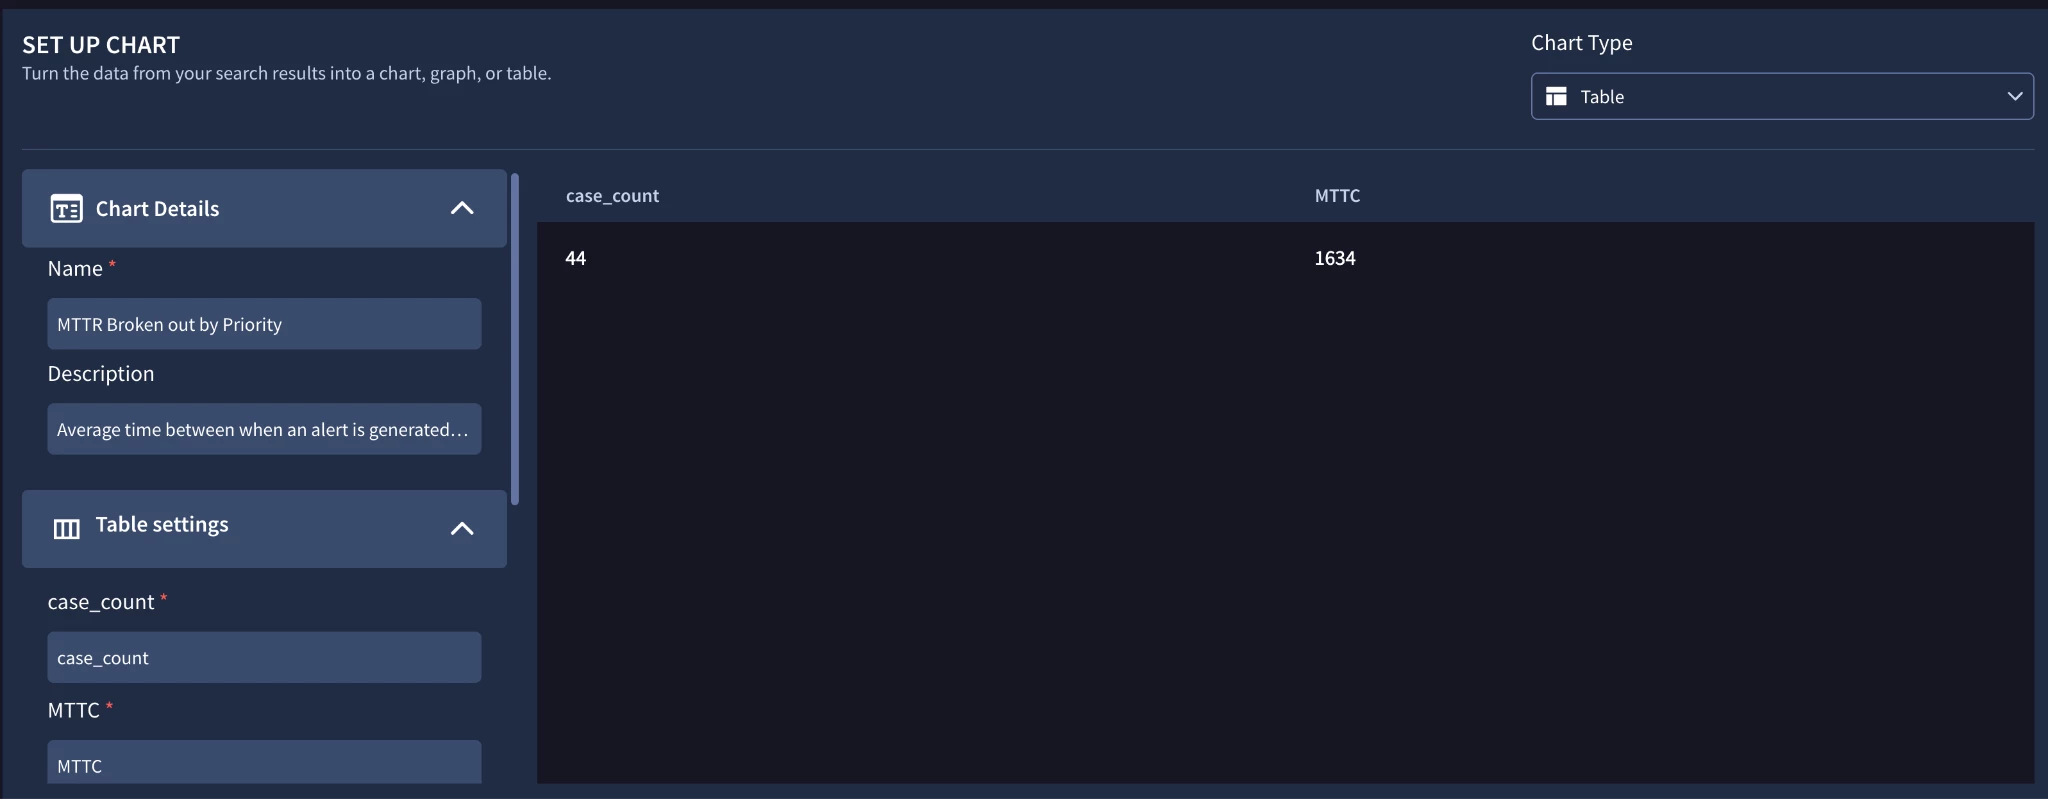
Once in edit mode we scroll down to the chart setup. The chart was a metrics chart which only shows one value. For this example we will change it to a table. Also giving a chart an easily understood name is very important. Be sure to say plainly what is being shown. Now for the query we are going to use a different method to calculate closure time. The reason for this is the data set case.history and case would require a join. We can avoid this heavier operation by settling on just using the case dataset. Remember, there can be multiple ways to reach the same objective in SecOps.
stage stage1{


//event variable $h used for case.history dataset while $c is case dataset
$h.case_history.case_response_platform_info.case_id = $case_id
$c.case.response_platform_info.response_platform_id = $case_id
$c.case.priority = $c_priority


match:
   $c_priority,$case_id


outcome:
   $case_close_time = max(if($h.case_history.case_activity = "CLOSE_CASE", $h.case_history.event_time.seconds, 0))
   $status = array_distinct($h.case_history.case_activity)
   $TTC = $case_close_time - min($h.case_history.event_time.seconds)
   $Priority = array($c_priority)
condition:
   arrays.contains($status, "CREATE_CASE") and arrays.contains($status, "CLOSE_CASE")

   }


   $Priority = $stage1.Priority
match:
  $Priority
outcome:
   $case_count = count($stage1.case_id)
   $MTTC = (math.round(avg($stage1.TTC)/60))


order:
  $Priority asc
The first change that was made is we added a second dataset to the query. Originally only the case.history dataset was utilized, but this time we want the priority of the case. In order to do this we must create a join between the two datasets. The first step is to assign each set its own event variable. The letters chosen are h (for history) and c(for case). Notice I am careful to put comments that explain the meaning behind my choices. I then find the field for case_id in each of the datasets and create the placeholder $case_id. This then is my join and now I can use data that is in either set of results.
Next I add a placeholder that tracks the case priority, $c_priority and use that in the match section. For simplicity I created an outcome variable $Priority to capture the priority of the resulting case. The root stage is almost identical except I add this $Priority value as the match variable, thus the results are broken up by severity. The results are the table below.
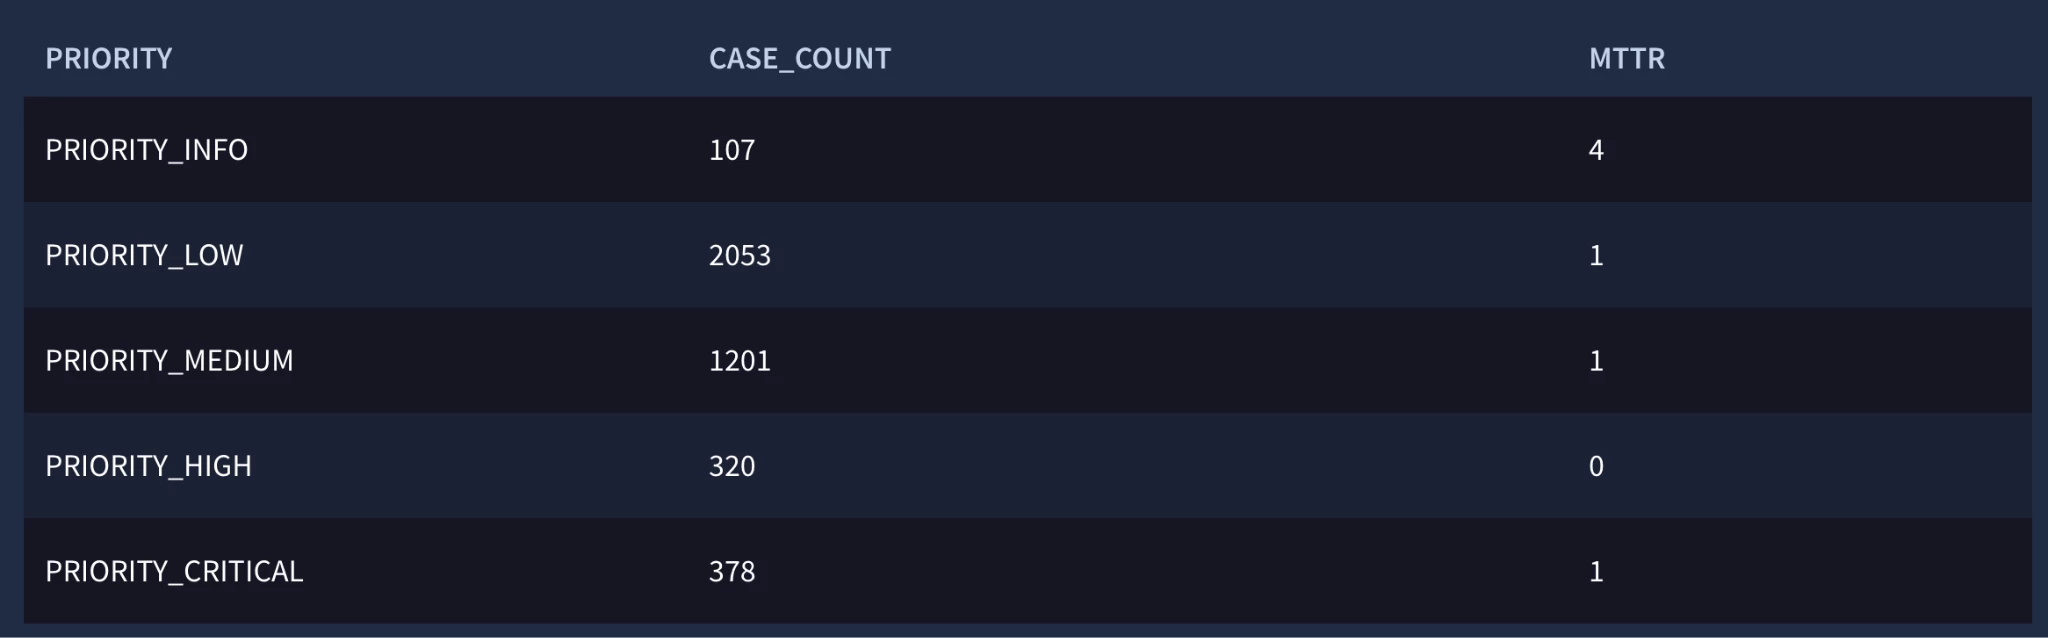
It is worth doing these types of drill downs on several different metrics in order to determine exactly what parts of the story are causing the conclusions. For example an average even when broken down across priorities is still prone to be being affected heavily by outliers. In that case you would want to combine your mean charts with those set to calculate median. It would be the same stage setup for the case close times but instead of the average function you would apply the median function in your Yara-L. The median will give you a much better idea of what your data actually represents in terms of capabilities. Adding a Max and Min metric along with your median will provide enough of the story that further inquiries into the exact bottlenecks can be made with precision. These examples centered around the MTTR but they can be applied to any metric values.
Part 3: The Hidden Tax – Correlation Between False Positives and MTTD
The Noise Ratio
A 10% increase in False Positives (FPs) does not just waste time; it actively suppresses MTTD for true positives. In Google SecOps, noisy rules flood the case queue, burying critical alerts.
Analyst Fatigue
When analysts experience "alert fatigue," the MTTR skyrockets because cases sit in the unassigned queue. The psychological impact creates a "latency lag." If an analyst assumes a specific YARA-L Curated Detection is usually benign, they will subconsciously deprioritize it.
Measurement: The Cost of Investigation
Calculate the Hidden Tax
-
Query logic: Calculate the total duration (MTTR) of all SOAR cases closed with the root cause Not Malicious. Present this metric to leadership as the "Financial Cost of Poor Tuning."
Part 4: Precision over Volume – False Positive Remediation
The Feedback Loop
How many FPs are "tuned out" directly in YARA-L vs. forcefully closed by analysts in SOAR? A healthy SOC closes the loop. When an analyst tags a case as an FP in SOAR, a playbook should ideally capture the exception parameters and push them to a tuning review queue.
Tuning Velocity via Retrohunt
Measure how long a known noisy rule stays active. In Google SecOps, you can dramatically accelerate Tuning Velocity using Retrohunts.
-
Instead of deploying a tuned rule and "waiting to see," security engineers should modify the YARA-L rule then run a Retrohunt against historical UDM data and mathematically prove the noise reduction. Be sure that alerting is turned off during this testing.
-
The resulting reduction in detections can now be measured
Part 5: Breaking the Average – The Power of Median Statistics
The "Mean" Trap
Mean averages are easily skewed. A single complex APT investigation that remains open in SOAR for 45 days will ruin an entire month's MTTR metrics.
Why Median Matters
Use the Median values in the dashboard to find the values in different percentiles of your data.
-
50th Percentile (Median): Represents the true daily experience of your analysts.
-
95th Percentile: Represents the worst-case scenarios and edge-case investigations.
Trend Identification
By tracking the 50th and 95th percentiles on a time-series chart, you can immediately see if a spike is a systemic process failure (both median and 95th rise) or a singular outlier (only the 95th spike).
Example Charts:
Median-Time-To-Remediate:
This chart will be another metric type
stage stage1 {
$case_id = case_history.case_response_platform_info.case_id
match:
   $case_id
outcome:
   $case_close_time = max(if(case_history.case_activity = "CLOSE_CASE", case_history.event_time.seconds, 0))
   $status = array_distinct(case_history.case_activity)
   $TTC = $case_close_time - min(case_history.event_time.seconds)
condition:
   arrays.contains($status, "CREATE_CASE") and arrays.contains($status, "CLOSE_CASE")
}
outcome:
   $case_count = count($stage1.case_id)
   $MTTC = math.round(window.median($stage1.TTC, false) / 60)
Median Percentiles:
Here is an example of what the output will look like. Obviously your TTC will match your data. These values show you exactly what the top 10% of your cases, middle 50% of your cases and bottom 20% of your cases take your team to close.

stage stage1 {
$case_id = case_history.case_response_platform_info.case_id
match:
   $case_id
outcome:
   $case_close_time = max(if(case_history.case_activity = "CLOSE_CASE", case_history.event_time.seconds, 0))
   $status = array_distinct(case_history.case_activity)
   $TTC = $case_close_time - min(case_history.event_time.seconds)
condition:
   arrays.contains($status, "CREATE_CASE") and arrays.contains($status, "CLOSE_CASE")
}
outcome:
   $case_count = count($stage1.case_id)
   $p90_TTC = math.round(window.percentile($stage1.TTC, 90) / 60)
   $p50_TTC = math.round(window.percentile($stage1.TTC, 50) / 60)
   $p20_TTC = math.round(window.percentile($stage1.TTC, 20) / 60)
Part 6: Priority-Based Reporting – Stop Treating Every Alert the Same
The Priority Lens
Aggregated MTTx is useless for showing the ability of your team to separate the utility spent on high/critical alerts versus those with a lower priority. Low priority cases should have numbers that represent the amount of automation used in the entire lifecycle of the case. This ROI begins to be lost when MTTx is not shown based on priority. This type of breakdown also can show you quick wins when increasing the usage of AI directed investigation decision making. This distinction is important to highlight when reporting the overall metrics of success.
Part 7: Investigating the Outliers – The "Long Tail" Analysis
What the Averages Hide
Dedicate a specific dashboard to the "Long Tail"—cases exceeding the 95th percentile for MTTC/MTTR. These are your architectural failures.
Root Cause Categorization
When analyzing Long Tail cases, mandate that analysts categorize the delay upon case closure in SOAR. Was the delay caused by:
-
Visibility Gap: (e.g., EDR wasn't installed on the server, requiring manual forensics).
-
Ingestion Delay: (metadata.collected_timestamp was hours behind event_timestamp due to a broken forwarder).
-
Process Delay: (Waiting on third-party IT to approve a firewall block).
Turning Data into Budget
Long Tail data is your budget justification. If 40% of outliers are categorized as "Visibility Gaps" in cloud environments, you now have the empirical data to justify the purchase of Cloud Workload Protection (CWPP) or expanded Google Cloud Audit Log ingestion.
Part 8: The "Tempo" Metric – Measuring OODA Loop Efficiency
Strategic Speed
The OODA (Observe, Orient, Decide, Act) loop in SecOps dictates survivability. "Tempo" measures the friction between these phases. In Google SecOps, Observe/Orient happens in the SIEM; Decide/Act happens in SOAR.
Automation Impact
To measure true automation impact, track the time spent executing automated playbooks vs. the time cases spent in "Wait for User Input" or "Manual Task" blocks.
-
Metric: Machine-to-Human Time Ratio. If a playbook takes 2 hours to execute, but 1 hour and 55 minutes of that was waiting for an analyst to click "Approve Isolation," your automation is not the bottleneck—your human workflow is.
-
AI usage should be its own metric as well. Tracking this per case will show opportunities to use AI in specific use cases that it has a proven track record.
Part 10: The Continuous Feedback Loop – Evolving Your Metrics
Metric Decay
Metrics have a shelf life. Goodhart's Law states that "When a measure becomes a target, it ceases to be a good measure." If you measure analysts purely on MTTR, they will prematurely close cases to game the system. You must continuously evolve metrics to counter this (e.g., pairing MTTR with a "Re-open Rate" metric).
The Maturity Model
As your Google SecOps deployment matures:
-
Phase 1 (Reactive): MTTA, MTTR, Event Volume.
-
Phase 2 (Proactive): False Positive Ratios, Tuning Velocity, Automation ROI.
-
Phase 3 (Intel-Driven): MTTD against specific Mandiant APT groups, MITRE coverage depth, Entity Risk decay rates.
Next Steps: The Data-Driven Security Culture
Utilize modern capabilities like Gemini in Security Operations. Start tracking the time saved by using LLMs to summarize complex alert clusters and generate YARA-L rules. Building a culture of data-driven security means empowering engineers to treat detection as code, incident response as a measurable pipeline, and the SOC as a strategic business asset.
Additional Resource: Adoption Guide: Best practices for using Gemini Search in Google SecOps
Adoption Guide: Accelerating SOAR: A Practitioner's Guide to the Gemini Playbook Assistant in Google
Conclusion
Transitioning to a modern, narrative-driven SOC requires moving beyond vanity dashboard metrics toward reporting that demonstrates true organizational resilience and strategic value. By implementing a framework that prioritizes high-severity adversary activity while automating low-risk noise, standardizing MTTx lifecycle definitions, and investigating the 'Long Tail' of operational outliers, security teams can expose systemic gaps and ground future budget requests in clear empirical data.
Achieving this level of actionable security intelligence relies on rigorous technical mechanics: joining case and history datasets on case_id for precise tracking, leveraging median-based statistical integrity, and using YARA-L logic to systematically categorize investigation delays. Ultimately, adopting data-driven humility and engineering discipline turns abstract metrics into powerful tools for continuous improvement and strategic influence.
