



Author: Tal Reznikov, Senior Security Solutions Engineer
Co-Author: Vik Singh, Senior Customer Success Manager
In the rapidly evolving landscape of cybersecurity, relying purely on rigid, step-by-step automated playbooks is no longer sufficient to combat advanced, dynamic threats.
The Agentic SOC represents a paradigm shift from deterministic automation to dynamic, AI-assisted reasoning.
The Triage and Investigation (TIN) Agent (also referred to as TINA), powered by Google Gemini Enterprise Platform, represents a massive leap forward. Instead of simply executing pre-programmed actions, the TIN agent autonomously investigates alerts, reasons through evidence, queries threat intelligence, pulls in third party context (in private preview), and delivers actionable verdicts.
This guide serves as an end-to-end framework to help your organization configure, deploy, run, and monitor the Google SecOps TIN Agent.
1. Architectural Concept: A Hybrid Approach to the Agentic SOC
Bringing an AI agent into your Security Operations Center changes the fundamental way you handle case logic, but it does not mean discarding your existing automation.
The Hybrid Automation Decision Matrix
This matrix outlines how incoming alerts are routed and handled based on their structure and volume, comparing deterministic automation with the dynamic Agentic SOC.
| Decision Point & Action | Route A: Deterministic Automation | Route B: Agentic SOC (TINA) |
|---|---|---|
| Is the alert highly structured and known? | Yes → Directs to traditional playbook execution. | No → Escalates to the dynamic reasoning layer. |
| Primary Processing Engine | Dynamic playbooks and deterministic logical branches. | TIN Agent running autonomous investigative workflows. |
| Evidence Gathering Methods | Executes static, pre-defined API queries. | Reasons using searches and tools
|
| Threat Intelligence Integration | Checks static reputation feeds or hard-coded lookup hashes. | Performs real-time correlation with Google Threat Intelligence and VirusTotal. |
| Verdict Delivery | Programmatic status updates or static alert escalation. | Renders a clear True Positive vs. False Positive verdict with a full timeline. |
Deterministic vs. Agentic Automation
-
Traditional Automation (Deterministic): Every step and outcome must be hard-coded. This makes it highly predictable and resource-efficient for known, high-volume alert types.
-
Agentic Automation (Dynamic): Shifts the focus to adaptive reasoning. By embedding the TIN agent directly into your workflows, the system handles unplanned variables by autonomously executing dynamic SIEM searches, cross-referencing findings with Google Threat Intelligence and VirusTotal, and delivering a verdict (True Positive vs. False Positive) along with a step-by-step timeline of its process.
Important Architectural Context and Boundaries
Before deploying the TIN agent, it is critical to understand its operational boundaries within Google SecOps:
-
SIEM Detections Only: The agent evaluates Google SecOps SIEM detections; it does not utilize or analyze data from SOAR Connectors or Playbook action results.
-
Note the Context Agent (in private preview) adds 3P integration for the TIN agent investigations to pull context from SOAR Response Integrations
-
-
Architecture Limits: The TIN agent is currently accessible only by users with a Global Data RBAC scope and does not support multi-tenant architectures.
-
MCP Integration: The TIN agent tools are exposed via the Model Context Protocol (MCP). This allows users to use Gemini to ask natural language questions directly about the agent's findings. You can expand the Gemini pane directly in the SecOps console or explore the MCP with your own agents using the Google Cloud SecOps MCP Documentation.
2. IAM Governance: The TINA Permission Matrix
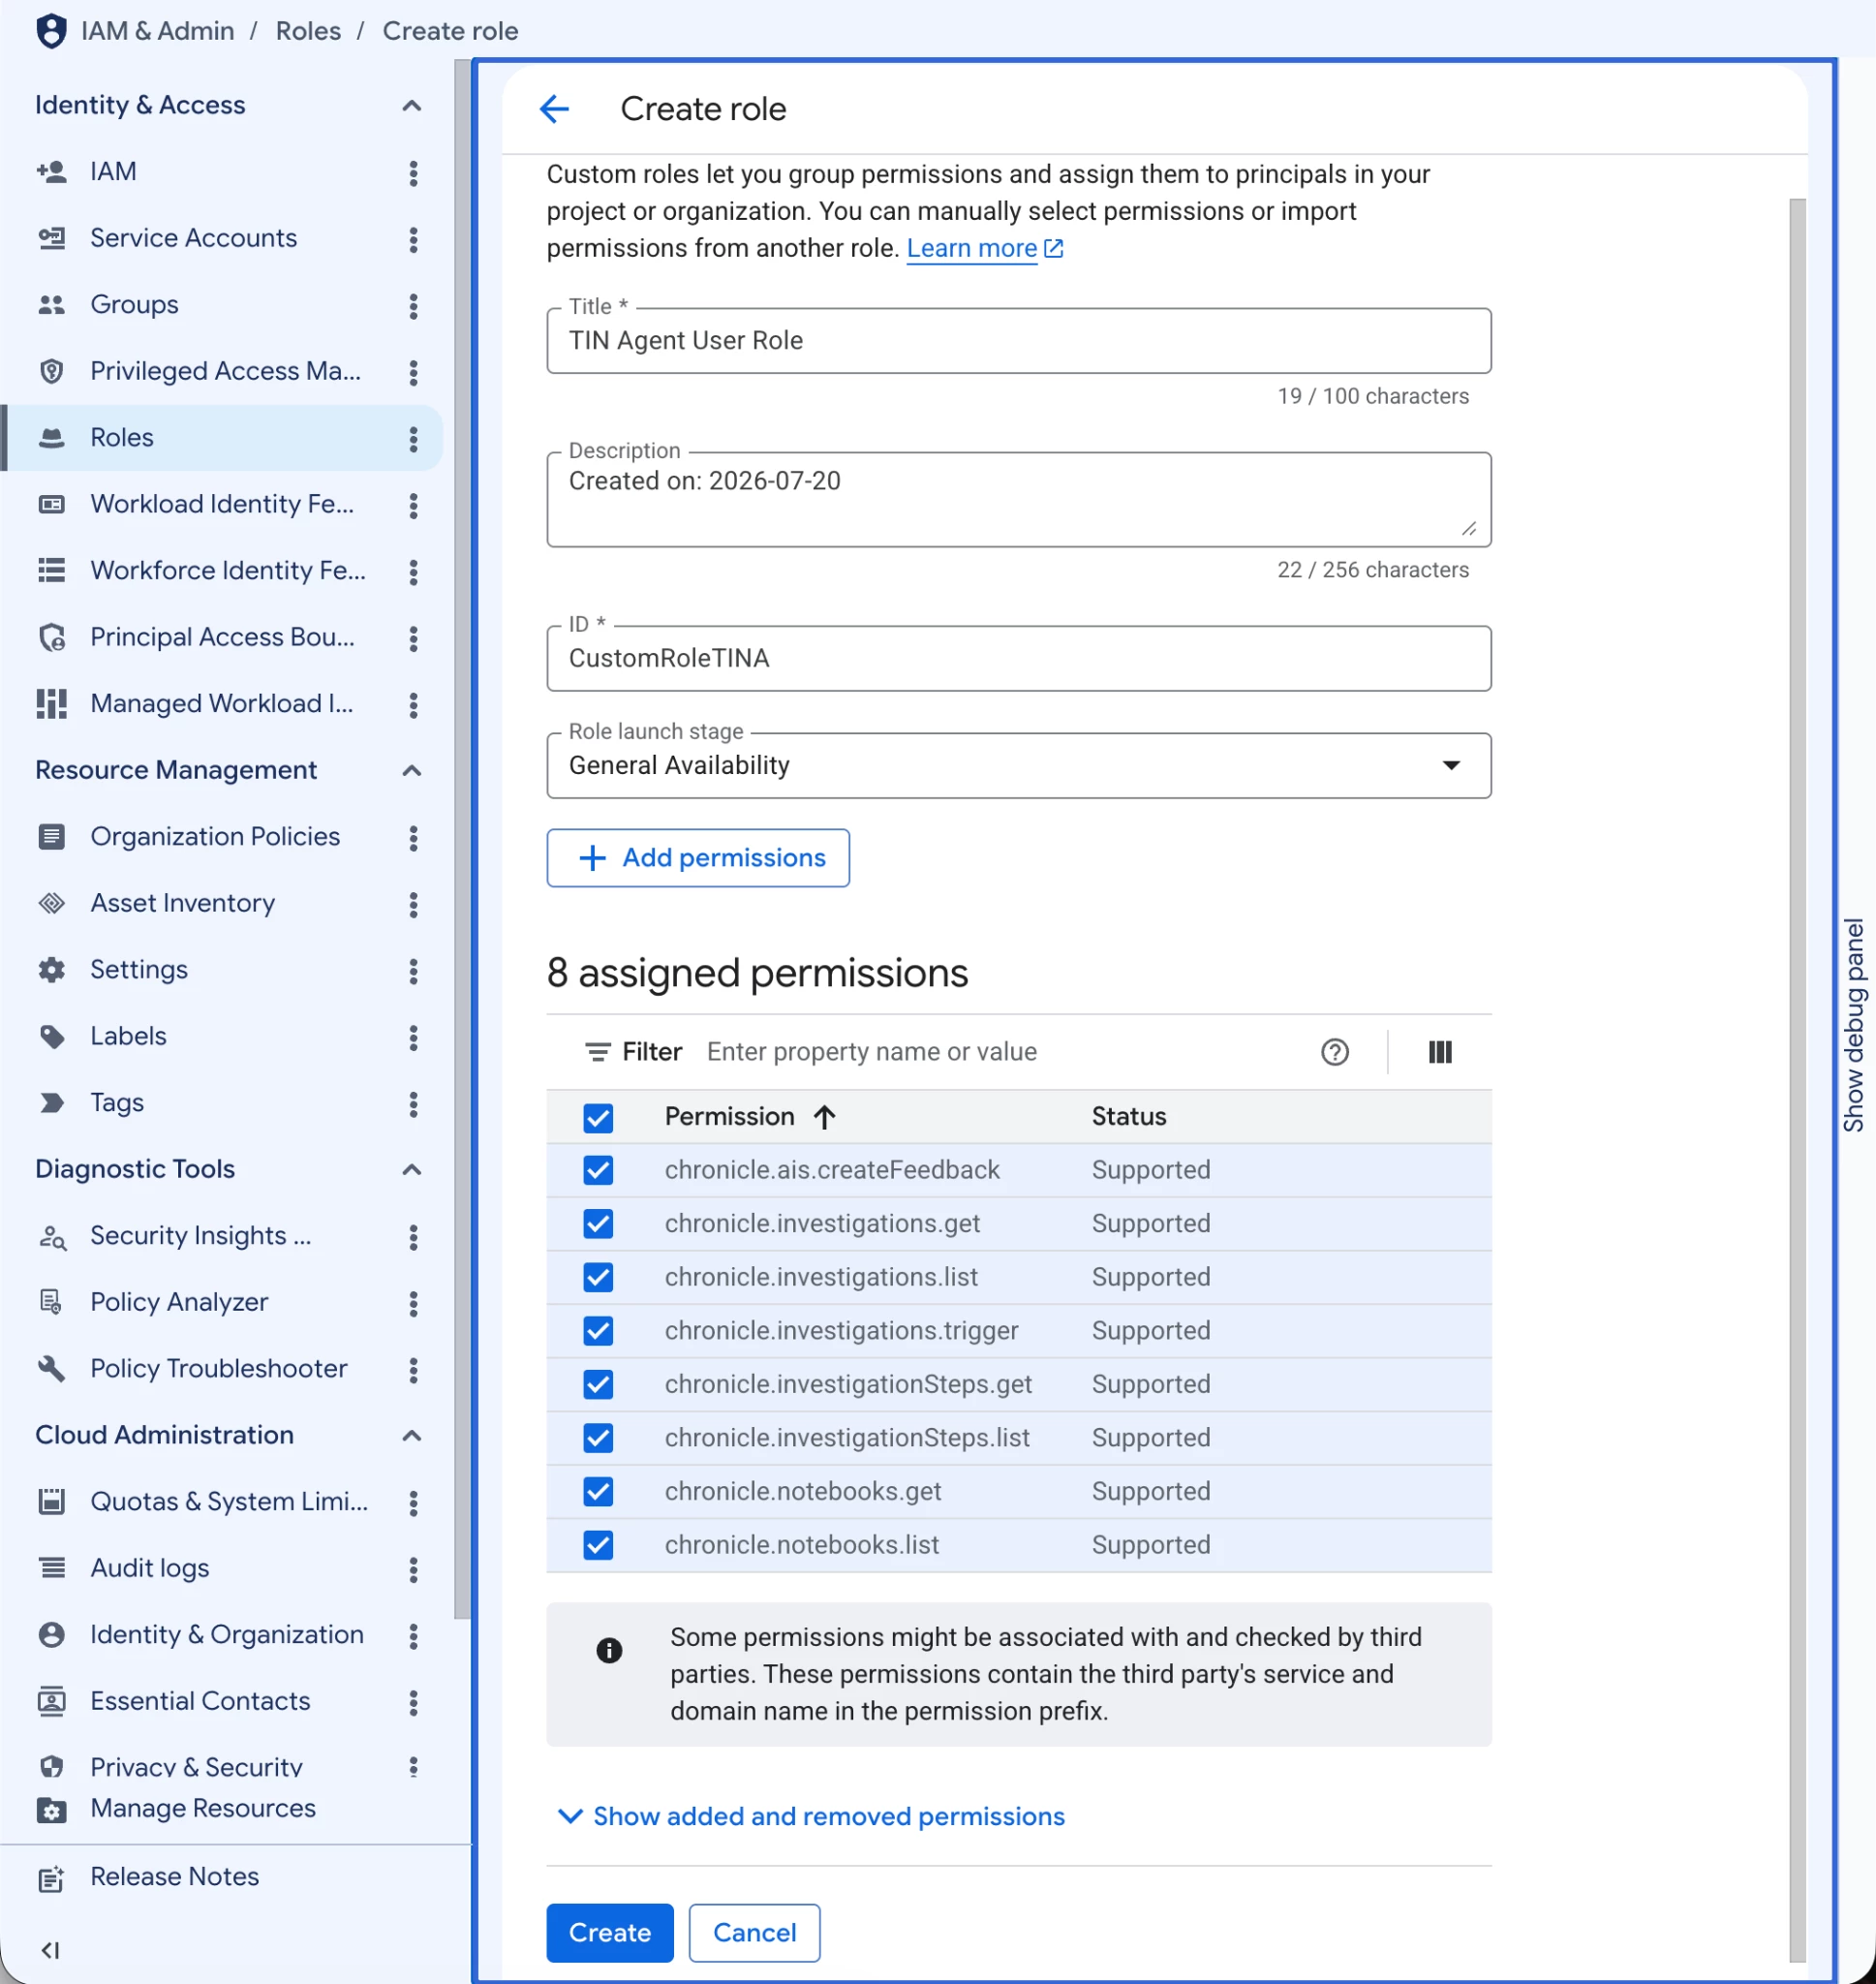
To enable autonomous features, specific Identity and Access Management (IAM) permissions must be granted within the Google Cloud Console. Security principals must be provisioned with roles matching their specific agent interactions using the principle of least privilege.
IAM Permission Schema
| Agent / Context | IAM Permission / Role | Description & Purpose |
|---|---|---|
| Triage & Investigation (TIN / TINA) | chronicle.conversations.create | Allows analysts to initiate natural language discussions about an alert. |
|
| chronicle.notebooks.get chronicle.notebooks.list | Grants access to notebook templates and execution history. |
|
| chronicle.investigations.get chronicle.investigations.list chronicle.investigations.trigger | Controls the manual or automated execution and inspection of investigation cycles. |
|
| chronicle.investigationSteps.get chronicle.investigationSteps.list | Allows analysts to inspect step-by-step reasoning (such as process trees and intelligence lookup queries). |
|
| chronicle.ais.createFeedback | Powers operator feedback integration (thumbs up/down) directly in the UI. |
Step-by-Step IAM Provisioning
To configure these permissions, a Google Cloud Administrator must complete the following walkthrough:
-
Open the Google Cloud Console and navigate to IAM & Admin > IAM.
-
Click Grant Access at the top of the interface.
-
Designate Principals: Enter the targeted user account, Google Group, or managed Service Account.
-
Configure Dedicated Roles:
-
Option A (Predefined): Search for "Chronicle" and select an appropriate predefined role (e.g., Chronicle API Admin or Chronicle API Editor).
-
Option B (Recommended Best Practice - Custom Least Privilege): Click + Create Role to construct a custom role (e.g., "SecOps TIN Agent User"). Add only the specific permissions listed in the TINA permission matrix above, name it descriptively to enforce strict least privilege, and save.
3. Opt-In Activation & Operational Setup
Beyond IAM configuration, administrators must execute a specific opt-in sequence and prepare environmental contexts within the Google SecOps console.
Step 1: UI Opt-In & Activation
-
Access the Google SecOps Console.
-
Access Gemini: Click the Gemini icon in the top right of the primary SecOps screen.
-
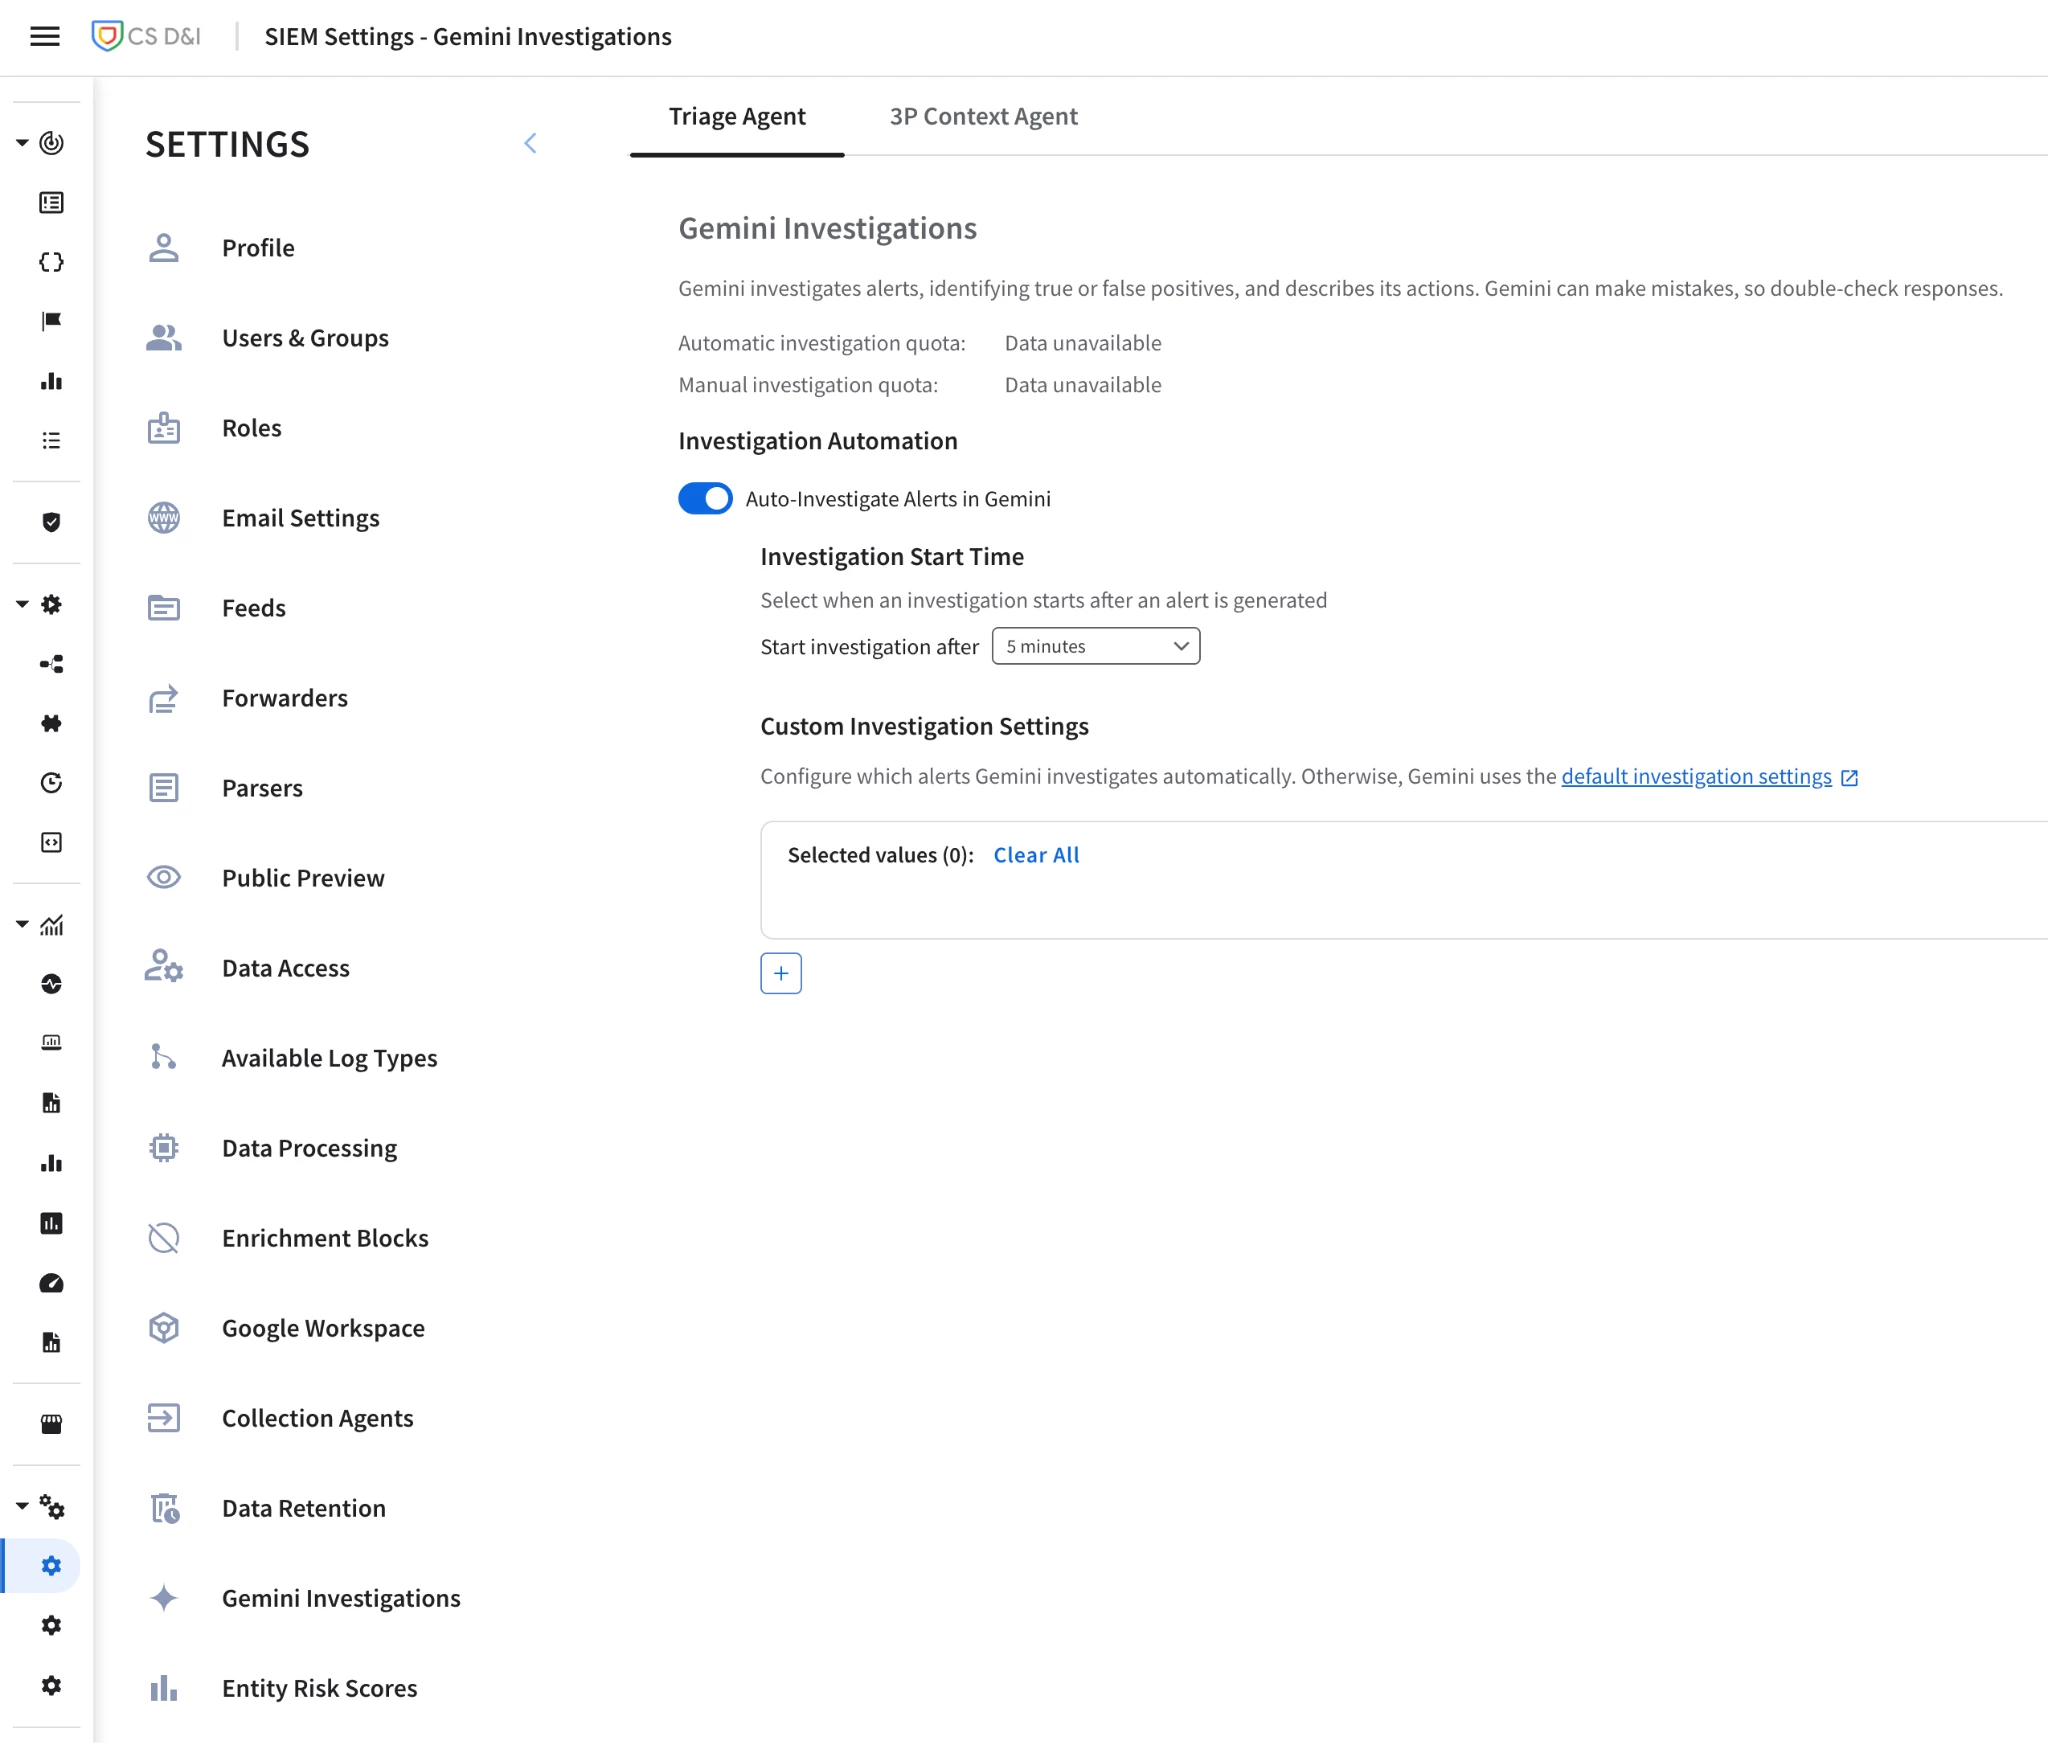
Navigate Settings: Alternatively, go to Settings → SIEM Settings and select Gemini Investigations.
-
Opt-In: Select the Investigations icon and click Opt-In to activate the native Triage and Investigation Agent.
-
Note: If you have insufficient permissions or incorrect RBAC scopes (requires Global Data RBAC), an error popup will prevent saving settings.
-
Ensure Cases View Access: Ensure that users have proper access to SecOps Cases and Investigation views, as TINA relies heavily on native UI triggers for both automatic and manual context enrichment during active investigations.
*3P Context Agent is in private preview
4. Execution Strategy: Settings vs. Playbooks
The TIN agent can be triggered in two ways. Understanding the operational hierarchy of these methods is critical to avoiding duplicate actions.
TINA Trigger & Redundancy Prevention Flow
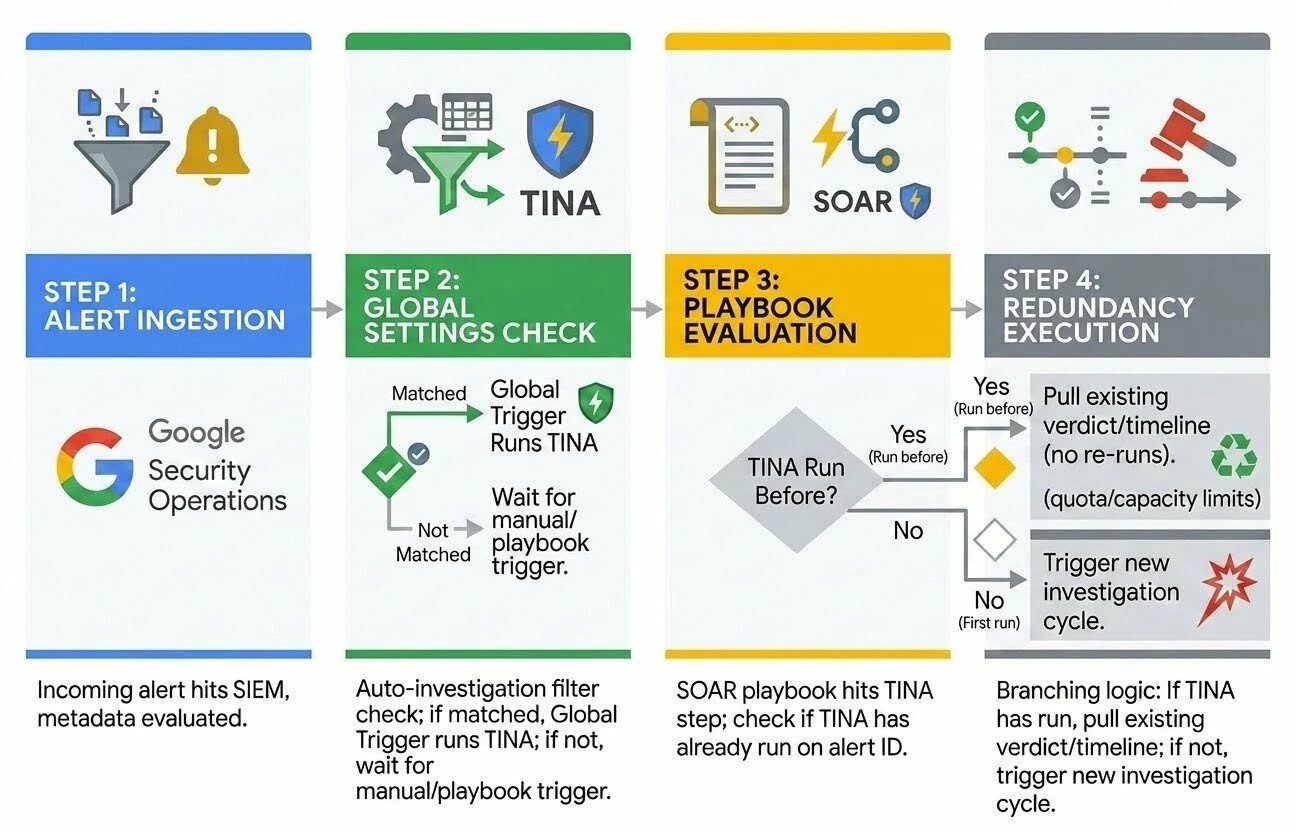
This step-by-step logic explains how SecOps manages TINA runs and automatically prevents redundant machine actions.
| Processing Stage | System Activity & Logic | Action Details |
|---|---|---|
| 1. Alert Ingestion | Incoming alert hits the Google SecOps SIEM. | Evaluates alert metadata against ingestion rules. |
| 2. Global Settings Check | Checks if the alert matches global auto-investigation filters. | • If matched: Global Trigger auto-runs TINA. • If not matched: Wait for manual or Playbook trigger. |
| 3. Playbook Evaluation | The alert hits a SOAR playbook step containing TINA. | The Playbook engine checks: Has TINA already run on this alert ID? |
| 4. Redundancy Execution | The system branches based on prior execution state. | • Yes (TINA has run): Immediately pulls the existing verdict and timeline (no re-runs). • No (First run): Triggers a new active TINA investigation cycle. |
Trigger Methods
| Trigger Method | How it Works | Best For |
|---|---|---|
| Global Settings* | Automatically triggers an investigation on incoming alerts based on user-defined UDM filters (e.g., security_result.severity = LOW or specific rule IDs). Current max 5/hr. | Broad, automated, consistent coverage for specific rule classes across the organization. |
| SOAR Playbooks | Triggered programmatically as a discrete action step inside a response workflow. | Conditional execution that depends on preceding playbook actions or decision branches. |
-
Redundancy Management: If the TIN agent is configured to run automatically via global settings, and a Playbook subsequently attempts to call the agent action on that same alert, the agent will not launch a redundant investigation. The Playbook will immediately retrieve the existing verdict and reasoning from the initial automated run, conserving system resources and API limits.
*Current quotas can be found at the following link: Triage and Investigation Agent (TIN)
Strategic Use Cases
1. High-Priority Thresholds*
To prioritize high-value resources, configure alert filters to trigger agentic investigations on highly critical targets. Reserve agent runs for alerts impacting VIP assets, Domain Controllers, or sensitive network subnets.
2. The Low-Criticality Backlog
SOCs are often overwhelmed by high-volume, low-criticality alerts (e.g., adware or minor policy violations) that analysts rarely have time to investigate. Routing these alerts through the TIN agent allows Gemini to investigate them at scale, write comprehensive explanations of why an alert is benign, and automatically close cases. This guarantees thorough coverage without burning out human analysts.
3. The Tiered "Catch-All" Playbook
Maintain a structured, tiered playbook model:
-
Priority 1 & 2 Playbooks: Run deterministic, highly predictable automation flows for known attack signatures.
-
Priority 3 Playbooks: Serve as a dynamic catch-all for novel, complex, or unclassified alerts. If an alert does not match a deterministic playbook, escalate it to the TIN Agent for context-gathering, threat intelligence correlation, and logical evaluation.
*High-Priority is the currently recommended approach, due to current token capacity constraints
Step-by-Step Playbook Setup Guide
Integrating the TIN agent into your response playbooks enables powerful automated remediation flows:
TINA Playbook Action & Logic Branching Scheme
| Playbook Step | Action Required | Expected Configuration & Output Parameters |
|---|---|---|
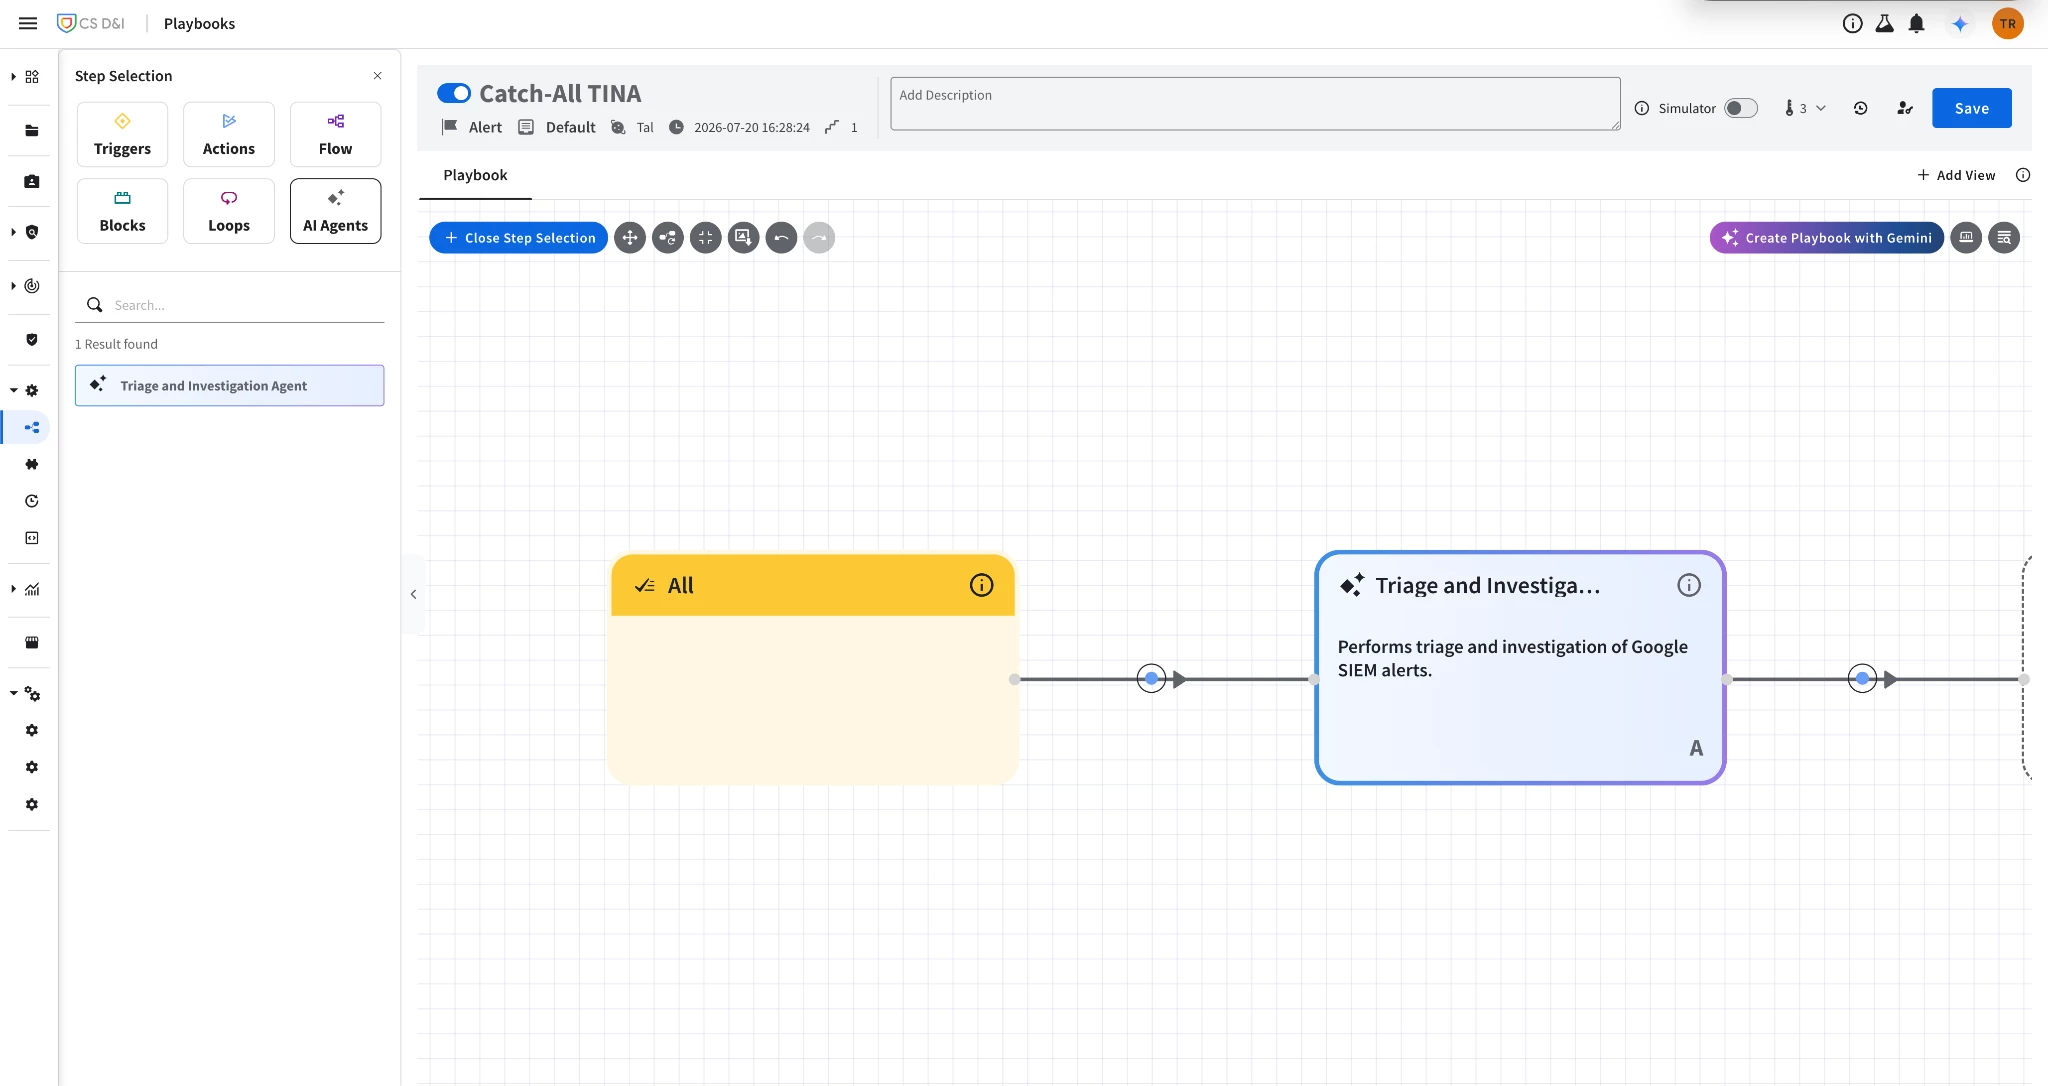
| Step 1 | Drag & Drop Agent Step | Locate the AI Agents block category in the SOAR panel and drag the Triage and Investigation Agent step onto your active canvas. |
| Step 2 | Add Decision Branch | Insert a Condition or Branch block directly following the TINA step. Configure it to evaluate TINA's output verdict string. |
| Step 3A | Branch: False Positive | • Criteria: Verdict = "FALSE_POSITIVE" • Action 1: Automatically attach TINA's timeline and reasoning to the case. • Action 2: Trigger a system action to close the case as resolved/benign. |
| Step 3B | Branch: True Positive | • Criteria: Verdict = "True Positive" • Action 1: Attach TINA's analysis to the case notes. • Action 2: Trigger automated containment actions (e.g., host isolation). • Action 3: Assign the case directly to Tier-2 security analysts for review. |
-
Navigate to Playbooks: Open the SecOps menu and go to Response > Playbooks.
-
Access AI Agents: Open the Step Selection panel on the right. Scroll past standard Connectors to find the AI Agents category.
-
Position the Step: Drag and drop the Triage and Investigation Agent step onto your active workspace workspace canvas.
-
Configure Logic Branching: Place a Condition or Branch step immediately after the AI Agent. Set the criteria to evaluate the output verdict parameter of the agent step:
-
False Positive Branch: If the agent determines the alert is a false positive, attach the agent's timeline and analytical summary as a case note, and execute an action to close the case.
-
True Positive Branch: If the agent returns a true positive, attach the summary, trigger automated containment steps (e.g., isolating the host or disabling the user account), and escalate the case to a tier-2 human analyst for immediate remediation.
5. Auditing, Monitoring & Governance
Maintaining strict oversight of AI operations is critical for security, resource optimization, and compliance.
Monitoring Activity in Google Cloud Logs Explorer
To audit agent executions and verify user access context, navigate to Logs Explorer in the Google Cloud Console and filter logs for the Google SecOps service (chronicle.googleapis.com).
Key Audit Fields
-
protoPayload.authenticationInfo.principalSubject: Identifies the principal (user or service account) who triggered the agent run.
-
protoPayload.methodName: Details the specific API action taken (e.g., TriggerInvestigation).
-
protoPayload.status: Reflects whether the run succeeded or encountered error states (e.g., permission denials).
Comprehensive Log Queries
-
Audit TIN Agent Activity & General AI Service Actions:
resource.type="audited_resource"
resource.labels.service="chronicle.googleapis.com"
protoPayload.methodName:(
  "google.cloud.chronicle.v1alpha.InvestigationService"
  OR "google.cloud.chronicle.v1main.AisService"
) -
Monitor Triage Agent Executions and Retrievals:
protoPayload.serviceName="chronicle.googleapis.com"
protoPayload.methodName:(
  "google.cloud.chronicle.v1alpha.InvestigationService.TriggerInvestigation"
  OR "google.cloud.chronicle.v1alpha.InvestigationService.GetInvestigation"
)

-
Identify Agent Permission Denials (IAM Failures):
protoPayload.serviceName="chronicle.googleapis.com"
severity="ERROR"
protoPayload.status.message:"Permission" -
SecOps Unified Ingestion Query (If Google Cloud Platform logs are forwarded to SecOps SIEM):
(
  metadata.event_type = "USER_RESOURCE_ACCESS"
  AND metadata.product_event_type = "google.cloud.chronicle.v1alpha.InvestigationService.GetInvestigation"
)
OR
(
  metadata.event_type = "STATUS_UNCATEGORIZED"
  AND metadata.product_event_type = "google.cloud.chronicle.v1alpha.InvestigationService.TriggerInvestigation"
)
AND metadata.product_name = "Google Cloud Platform"
AND metadata.vendor_name = "Google Cloud Platform"
6. Visualizing Agent Performance & Metrics
Google SecOps includes curated dashboards to help security managers evaluate token consumption, verify investigation accuracy, and track team efficiency.
Curated Triage and Investigation Agent Dashboard Performance Summary
This dashboard metric breakdown represents actual telemetry statistics evaluated inside active Agentic SOC monitoring dashboards.
| telemetry Category | Dashboard Widget | Value / Count | Description & Analytics |
|---|---|---|---|
| System Usage Summary | Investigations Executed | 204 | Cumulative count of manual and programmatic analyst runs. |
|
| Tokens Consumed | 121.2M | Security model token consumption metrics for cost forecasting. |
| Model Disposition split | True Positive / High Confidence | 101 | High-fidelity critical alerts validated and parsed. |
|
| True Positive / Low Confidence | 14 | Validated alerts containing novel indicators marked for review. |
|
| False Positive / High Confidence | 71 | High-fidelity benign alerts auto-investigated and closed. |
|
| False Positive / Low Confidence | 18 | Edge-case alerts resolved but marked for analyst verification. |
| Volume by Log Source | WINDOWS_SYSMON | 98 | Endpoint system telemetry alert investigations. |
|
| WINEVTLOG | 62 | Windows Event Log security telemetry triage runs. |
|
| GCP_SECURITYCENTER | 31 | Native Google Cloud telemetry threat detections. |
|
| CS_EDR | 3 | Integration endpoint telemetry logs processed. |
Accessing Native Dashboards
-
Open the Google SecOps console.
-
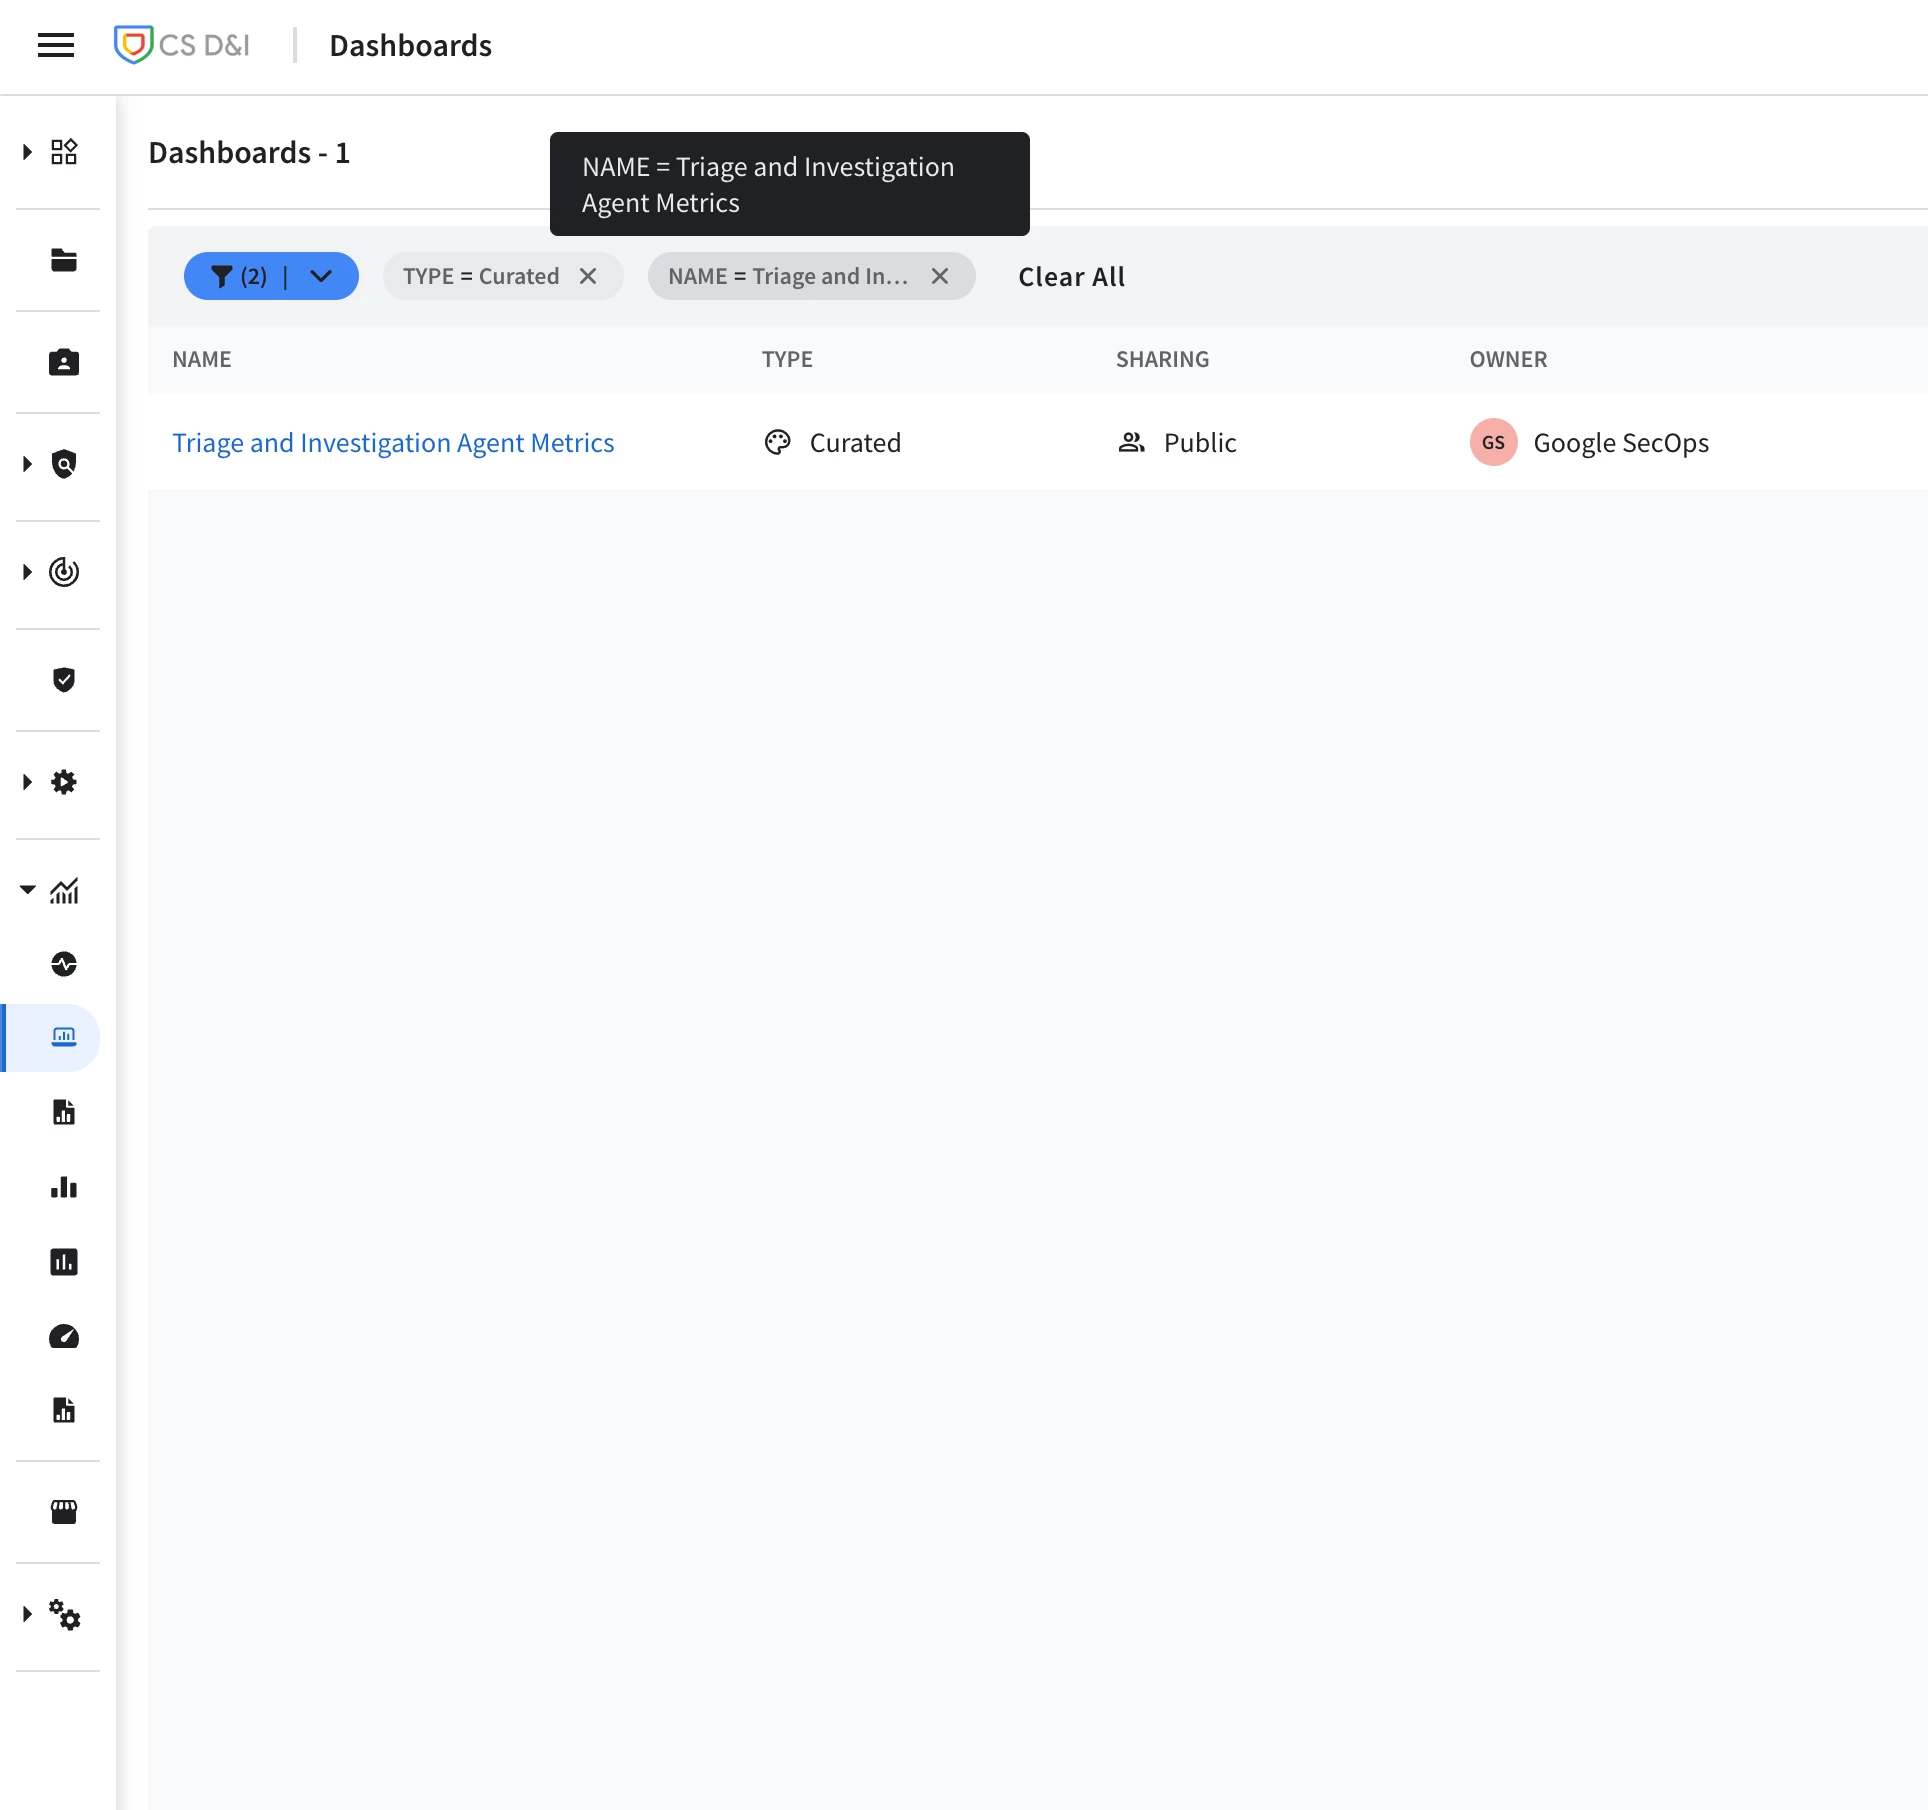
Click the Dashboards & Reports icon on the left-hand navigation panel, then select Dashboards.
-
Click the Filters toggle on the dashboard list page (using the AND operator).
-
Set Type to Curated.
-
Set Name to search for Triage and Investigation Agent Metrics, then click Apply.
Key Metrics to Track
-
Daily Token Usage: Tracks daily token consumption metrics to help manage capacity planning and forecast cost allocations.
-
Gemini Investigations by Trigger Type: Compares the volume of automated triggers (Global Settings) against manual runs initiated by analysts.
-
Gemini Disposition Trends: Displays the ratio of True Positive and False Positive verdicts rendered by the models. Review these categories to ensure accuracy:
-
True Positive / High Confidence vs. True Positive / Low Confidence
-
False Positive / High Confidence vs. False Positive / Low Confidence
-
Investigations Conducted by Alert Type: Identifies which logging sources generate the highest volume of agentic investigations (e.g., WINDOWS_SYSMON, WINEVTLOG, GCP_SECURITYCENTER_THREAT, CS_EDR).
-
Operator Feedback Metrics: Tracks analyst agreement and disagreement with Gemini's findings, which is crucial for measuring real-world accuracy and tuning detection rules.
7. Analyst Enablement: Empowering the Human Element
The goal of the Agentic SOC is not to replace your tier-1 analysts or your deterministic automation playbooks. Instead, it is designed to eliminate the manual "grind" of initial triage. An analyst may trigger the TINA investigation manually from the top portion of the UI in the detection/alert view.
SOC Workflow Optimization Matrix
This hierarchy highlights how security activities are divided between machine pipelines, hybrid orchestration, and strategic human analysts.
| SOC Layer | Key Operations & Responsibilities | Core Execution Engine |
|---|---|---|
| Strategic Analyst Layer (High Value) | • Deep-dive retrospective threat hunting. • Proactive rule development and detection engineering. • Critical incident eradication and response choreography. | Human-Centric (SOC Security Analysts) |
| Hybrid Orchestration Layer | • AI reasoning logic and analytical case parsing. • Automated forensic timeline generation. • Natural language interactive telemetry query (MCP server). | TINA Agent Hybrid Layer (AI-Assisted) |
| Infrastructural Machine Layer (High Scale) | • Initial ad-hoc evidence accumulation. • Automated threat intelligence and reputation lookups. • High-volume low-criticality backlog execution. | Machine-Centric (Deterministic & Automated) |
By balancing fast, deterministic playbooks with the reasoning capabilities of the TIN Agent, you build a resilient, scalable defense. This automation layer handles initial evidence collection, threat intelligence correlation, and draft case documentation, freeing up your analysts to focus on high-impact initiatives:
-
Performing deep-dive threat hunting across advanced log types.
-
Optimizing proactive detection engineering frameworks.
-
Conducting containment, eradication, and post-incident forensic reviews.
8. Conclusion
By following this guide, organizations can successfully deploy the TIN Agent to handle alert triage and investigation. Embracing this architectural shift allows security operations teams to scale their efficiency and improve overall resilience against sophisticated threats through three primary takeaways:
-
1. The shift from deterministic to agentic SOC workflows: Moving beyond rigid, hard-coded playbooks to adaptive, AI-assisted reasoning enables the dynamic analysis of novel and unplanned variables.
-
2. The importance of balancing automation with human analysis: Integrating the high-speed execution of traditional automation with the comprehensive reasoning capabilities of AI agents ensures full coverage without over-taxing resources.
-
3. Empowering analysts: By handling the initial triage grind and context aggregation automatically, the TIN Agent enables analysts to focus on higher-value tasks like proactive threat hunting and advanced detection engineering.
