Author: Kyle Martinez
In any Security Operations Center (SOC), a critical question must be addressed when deploying SOAR: How do we know if the critical pieces of SecOps are working?
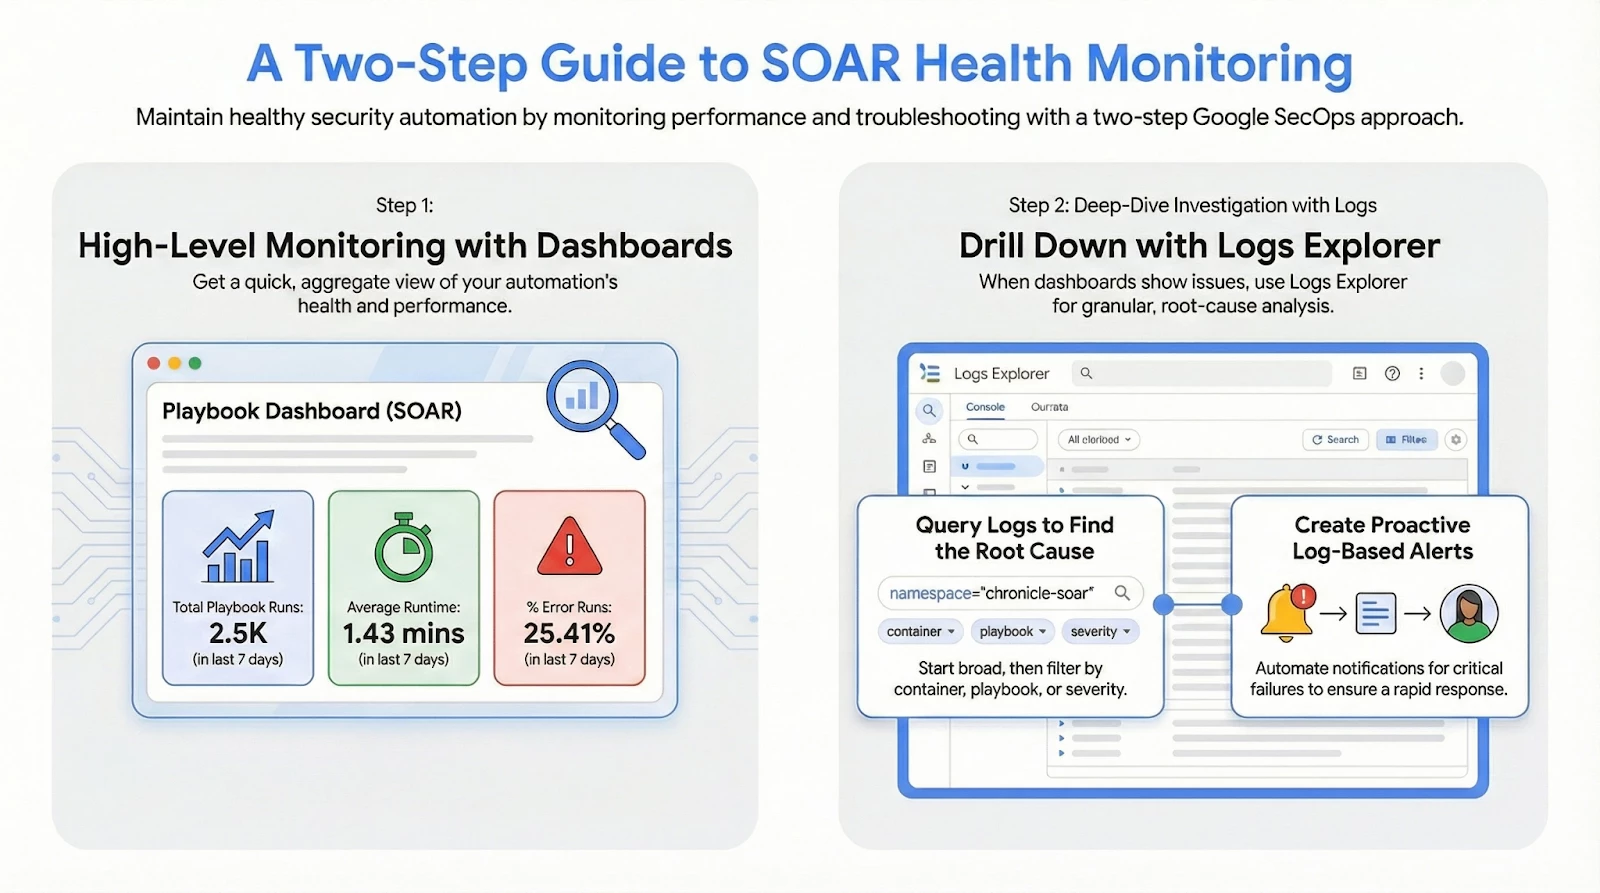
This is an important question that needs to be addressed when deploying SecOps. Without visibility into the performance and health of your automation workflows, your organization risks delayed response times and failed mitigations. In this guide, we’ll explore the necessary steps to monitor for performance issues and errors across the key components of the platform, including:
- View playbook performance
- Python/playbook errors
- Remote agent errors
- ETL processes
Monitoring Playbook Performance with Dashboards
To gain high-level, aggregate insights into your automation, we’ll start by taking a look at Playbook metrics in Dashboards. Before we review the dashboard, lets first quickly cover how to access Dashboards and the required permissions
Accessing SOAR Dashboards
- Log in to your Google SecOps portal.
- Open the Navigation Menu: Hover over the sliding left navigation bar to expand the menu.
- Navigate to Dashboards: Select Dashboards & Reports > Dashboards.
- Select a curated or customer dashboard.
Required Permissions
Access to these dashboards is governed by Identity and Access Management (IAM). To view SOAR data sources, you must be a global user. Key permissions include:
- chronicle.nativeDashboards.list
- chronicle.nativeDashboards.get
- chronicle.nativeDashboards.create
- chronicle.nativeDashboards.duplicate
- chronicle.nativeDashboards.update
- chronicle.nativeDashboards.delete
Playbook Dashboard (SOAR)
SecOps offers a curated dashboard named “Playbook Dashboard (SOAR)”. This dashboard is a vital tool, presenting a lot of useful information around Playbooks related to their performance, distribution, and errors.
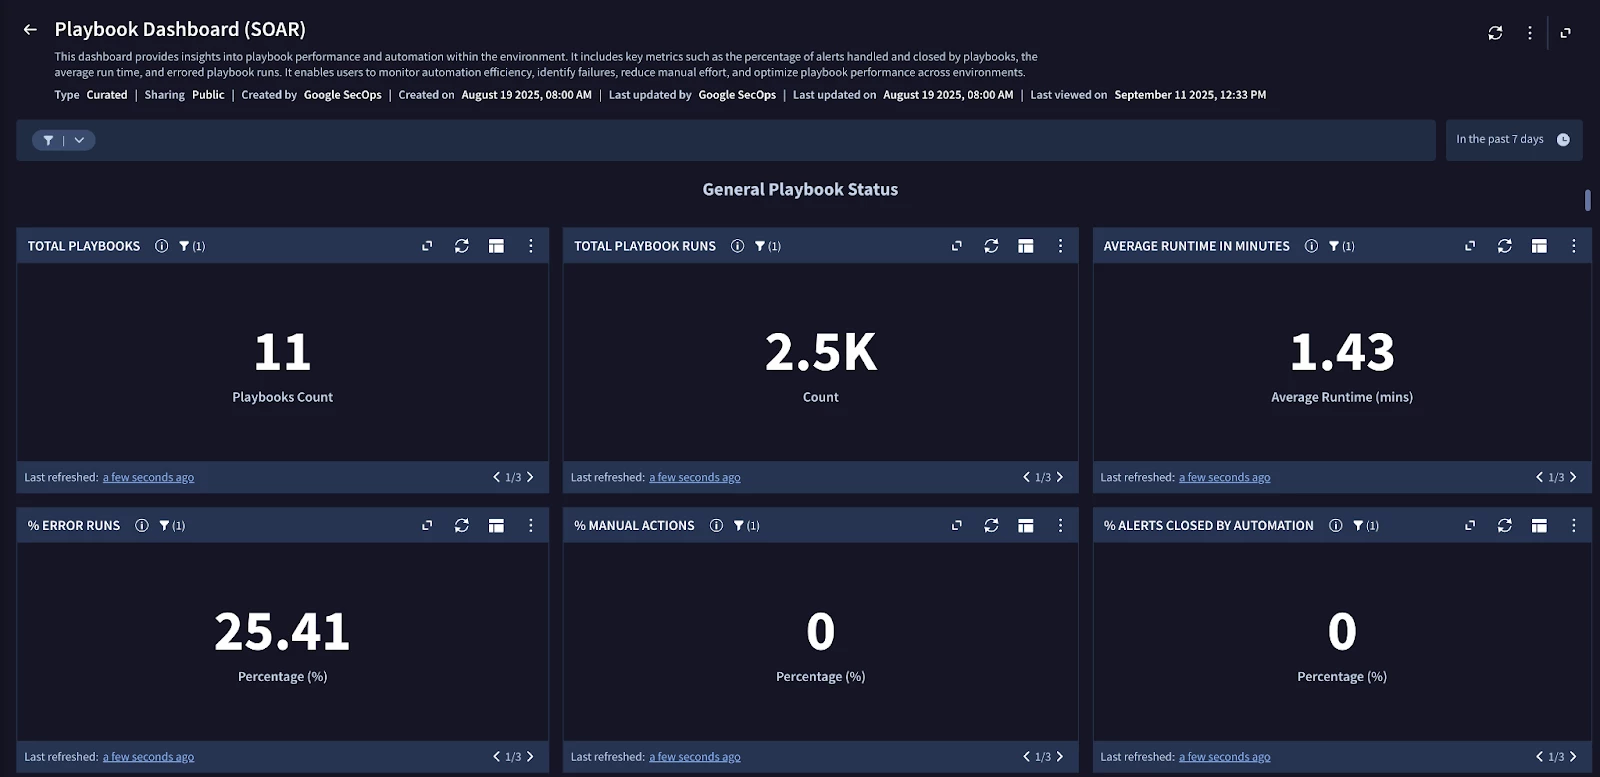
Key Performance Indicators (KPIs)
The following charts available on the Playbook Dashboard will help us rapidly identify potential issues and bottlenecks with our playbooks:
- Average Runtime in Minutes: Monitors efficiency and provides the average runtime of all playbooks
- % Error Runs: Provides the overall percentage of playbook runs that resulted in an error.
- % Errored Playbook Runs Per Playbook: Identifies specific playbooks that are failing most often.
- Average Runtime per Playbook: Provides the average runtime for each playbook.
- Playbook Queue: Lists the numbers of playbooks that are queued..
- % Faulted Actions: Displays a list of actions that have failed within a playbook.
In addition to using curated dashboards, you can create custom visualizations using the Playbook data set. This data set provides deep visibility into the execution lifecycle of your automation, allowing you to track exactly how playbooks are performing over a 365-day retention period.
Deep Dive into SOAR Logging with Logs Explorer
When an issue is identified in the dashboard, the next step is to investigate the raw logs for granular debugging. SOAR logs capture ETL processes, playbook executions, and python functions. These logs are extremely helpful in proactively monitoring the operational health of your SOAR and provide the insight necessary to debug playbook and integration failures.
The primary tool for viewing and analyzing these logs is the Google Cloud Logs Explorer.
Accessing Google Cloud Operations Tools
Both tools are located in the Google Cloud Console:
- Logs Explorer: In the navigation panel, go to Logging > Logs Explorer.
- Cloud Monitoring: In the navigation panel, go to Monitoring > Alerting (for alerts) or Dashboards.
Required IAM Roles
Access to these logs and metrics is governed by Google Cloud IAM. Ensure you or your service account has the following roles assigned at the project level:
- Logs Explorer
- roles/logging.viewer
- roles/logging.privateLogViewer
- roles/logging.admin
- Cloud Monitoring
- roles/monitoring.viewer
- roles/monitoring.alertPolicyEditor
Setting Up SOAR Log Collection
This process will differ depending on if you have Google SecOps or standalone Google SecOps SOAR platform. You can find the appropriate documentation to walk through the initial setup:
- Google SecOps: https://docs.cloud.google.com/chronicle/docs/secops/collect-secops-soar-logs
- Standalone Google SecOps SOAR: https://docs.cloud.google.com/chronicle/docs/soar/investigate/collecting-soar-logs
SOAR Log Organization
To start, let’s see how SOAR logs are organized and filtered in Logs Explorer.
To see all logs originating from SOAR, you can use the following fundamental query, which targets the primary namespace label:
resource.labels.namespace_name="chronicle-soar"
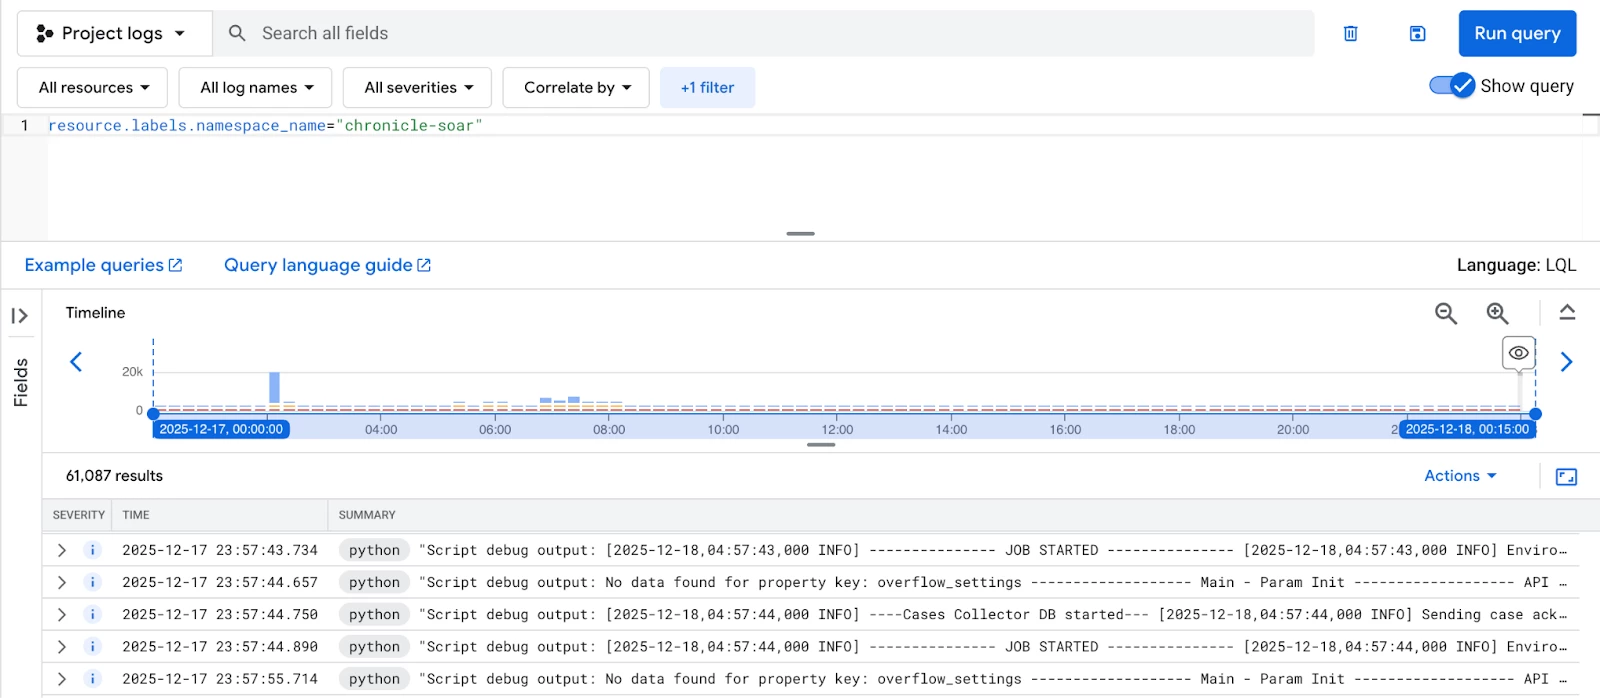
For more granular analysis, you can query relevant service containers, which will have their own set of labels for further filtering.
Filtering by Container and Labels
Python Service
The python service handles connectors, jobs, and actions. The logs generated here are critical for debugging integration failures.
| Component | Key Labels for Filtering |
| Integrations & Connectors | integration_name , integration_version , connector_name , connector_instance |
| Jobs | integration_name , integration_version , job_name |
| Actions | integration_name , integration_version , integration_instance , correlation_id , action_name |
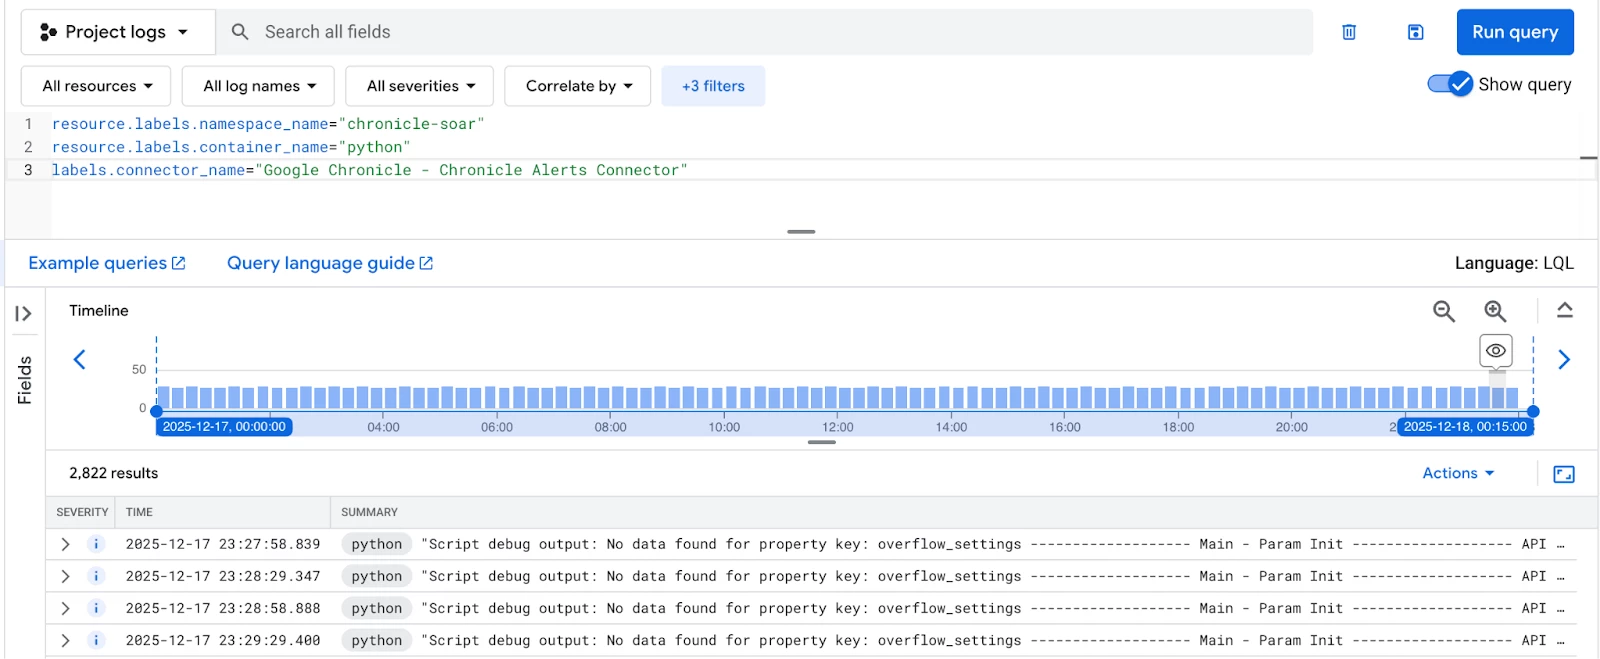
Example: Viewing logs from a specific connector
To see all logs from any instance of a Google Chronicle Alerts Connector, combine the namespace, container, and connector labels:
resource.labels.namespace_name="chronicle-soar"
resource.labels.container_name="python"
labels.connector_name="Google Chronicle - Chronicle Alerts Connector"
Playbook Service
To isolate logs related to the flow logic and errors within your automation workflows, target the playbook container.
Available Playbook Labels:
- playbook_name
- playbook_definition
- block_name
- block_definition
- case_id
- correlation_id
- integration_name
- action_name
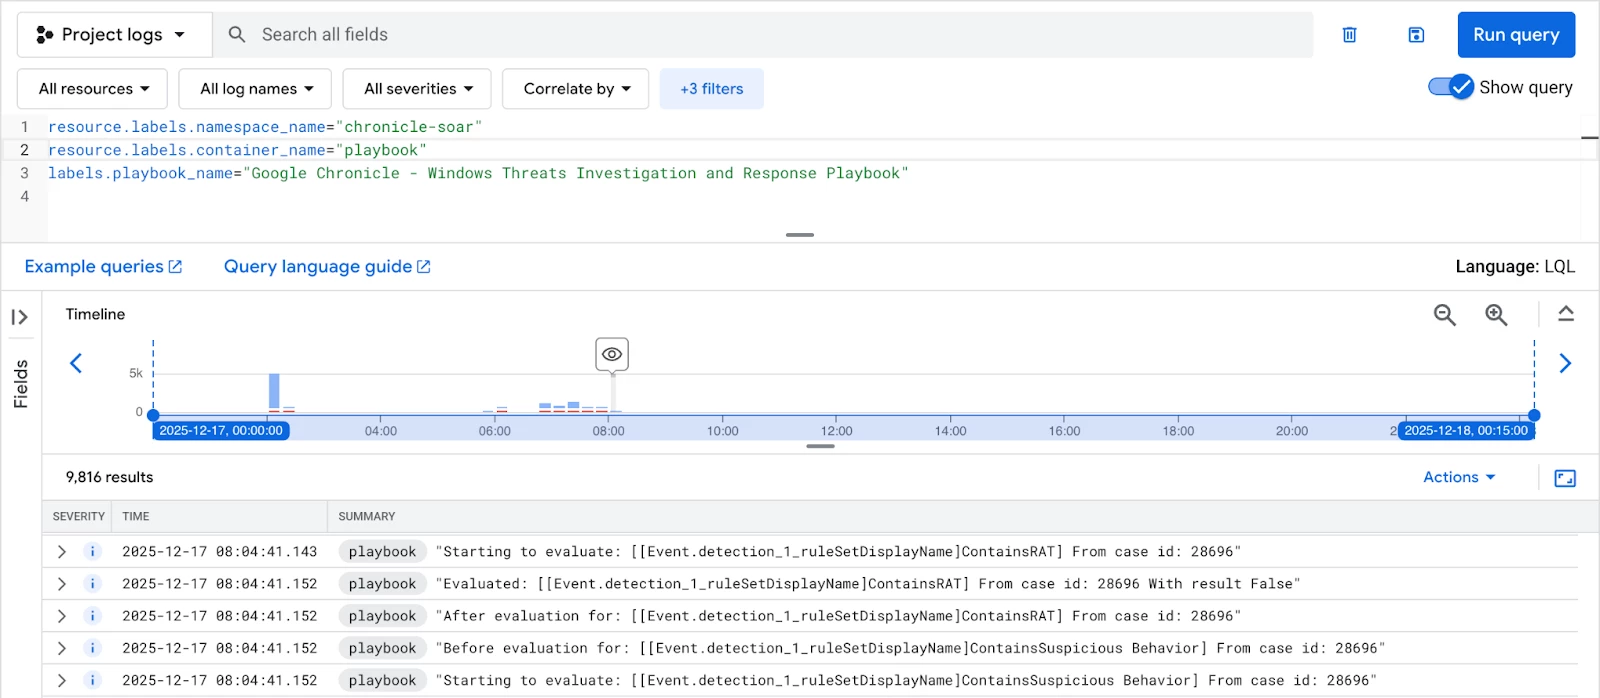
Example: Viewing logs for a specific playbook
resource.labels.namespace_name="chronicle-soar" resource.labels.container_name="playbook"
labels.playbook_name="Google Chronicle - Windows Threats Investigation and Response Playbook"
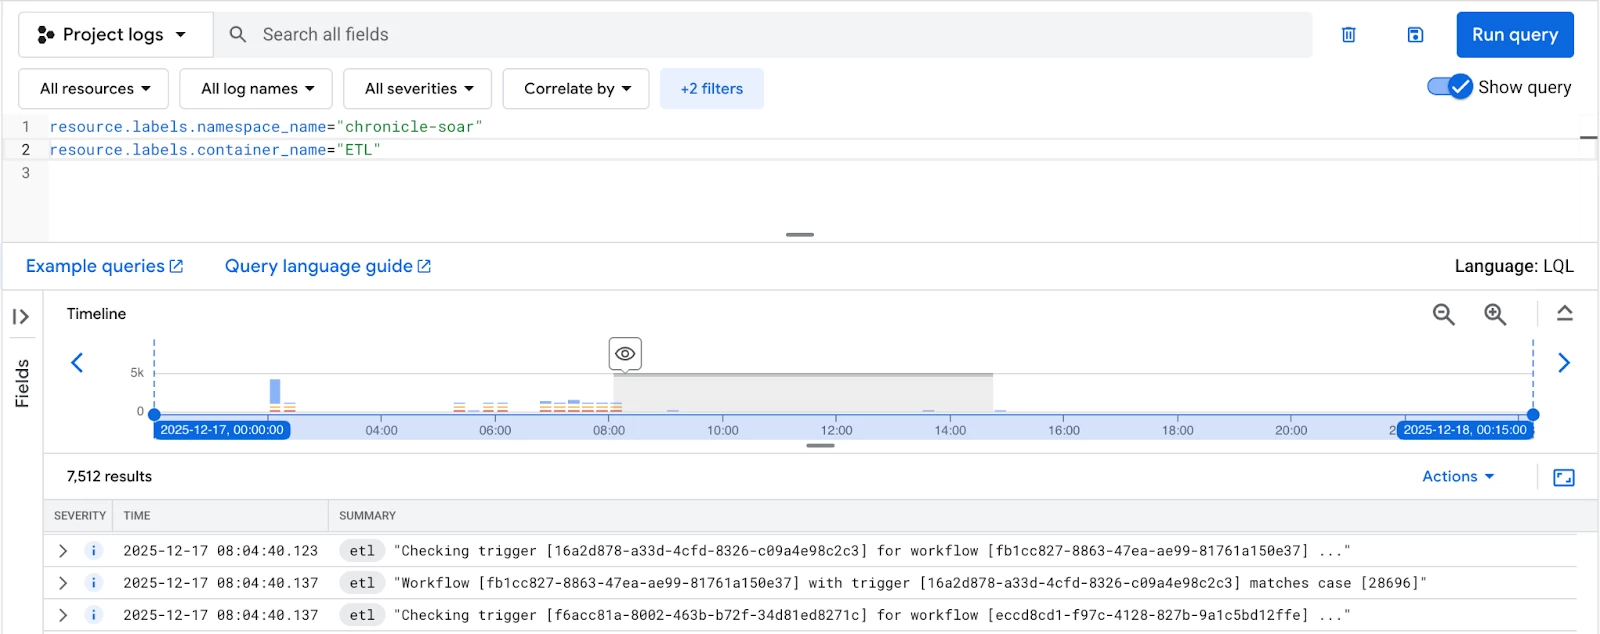
ETL Service
The ETL service handles data ingestion and processing. It’s essential to monitor this to ensure data is flowing correctly into your SOAR environment.
Available ETL Labels:
- Correlation_id
Example: General ETL query
Use Cases
One of the most critical monitoring tasks is identifying and resolving playbook failures. A silent failure means missed threat coverage, so a targeted search for errors is essential.
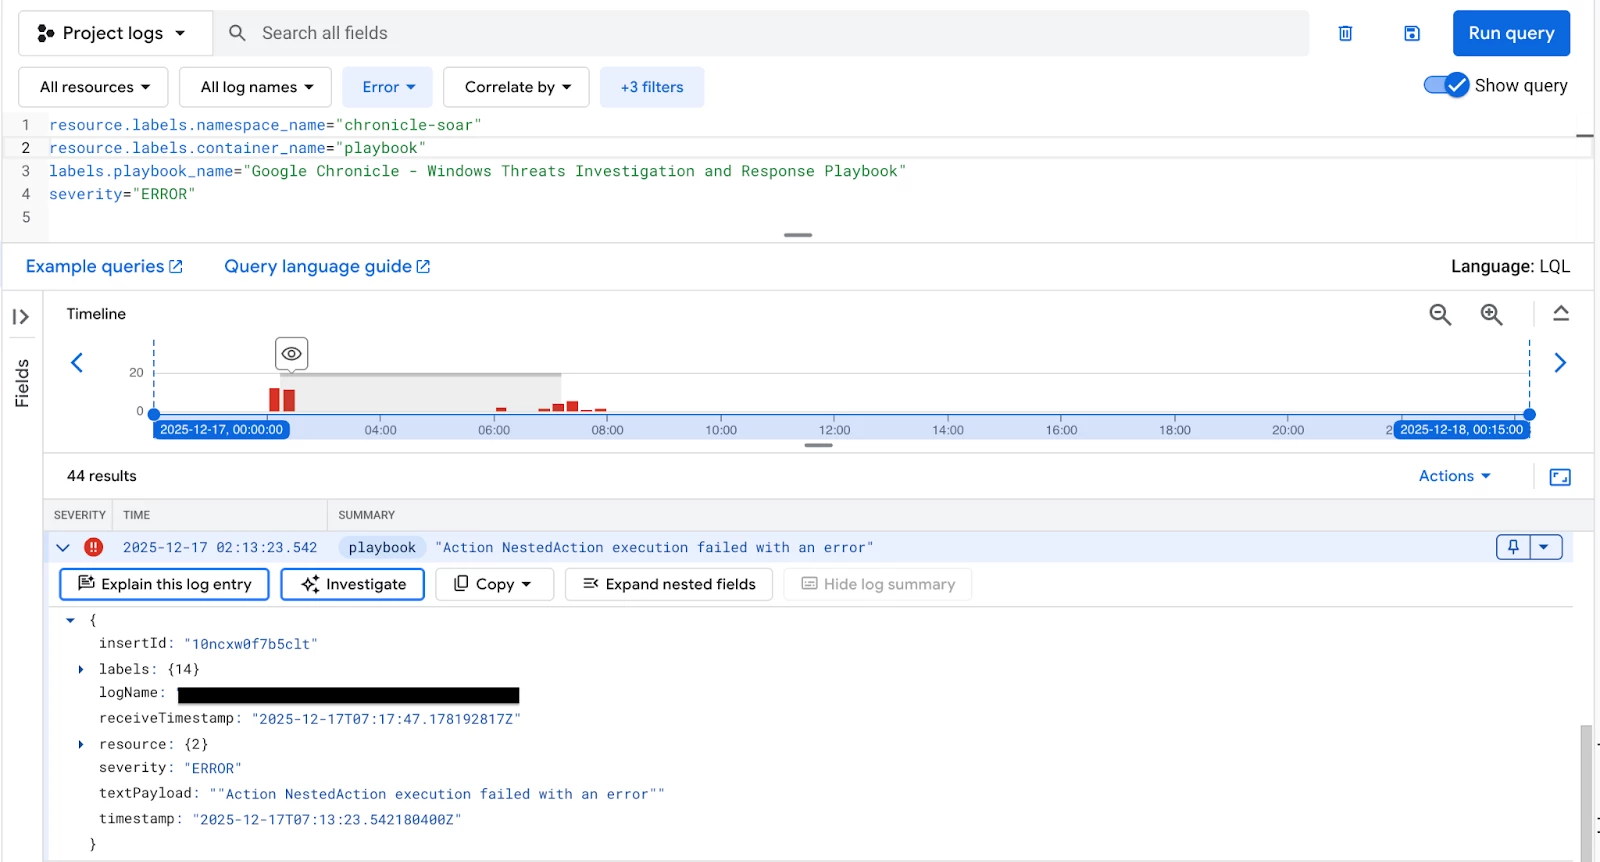
Specific Playbook Errors
To investigate a failure within a particular automated workflow, filter for all log entries generated by the playbook container that have a severity level of "ERROR", specifically targeting the playbook by name. This quickly narrows down the scope of the investigation.
resource.labels.namespace_name="chronicle-soar" resource.labels.container_name="playbook"
labels.playbook_name="Google Chronicle - Windows Threats Investigation and Response Playbook"
severity="ERROR"
Pinpointing Action and Python Failures
Actions executed by your playbooks, which handle connectors, jobs, and actions, run within the python service container. It is crucial to monitor this service for connector and integration issues. A simple severity filter might not suffice, as an action can "fail" gracefully but still return a problematic result, which is why we inspect the textPayload.
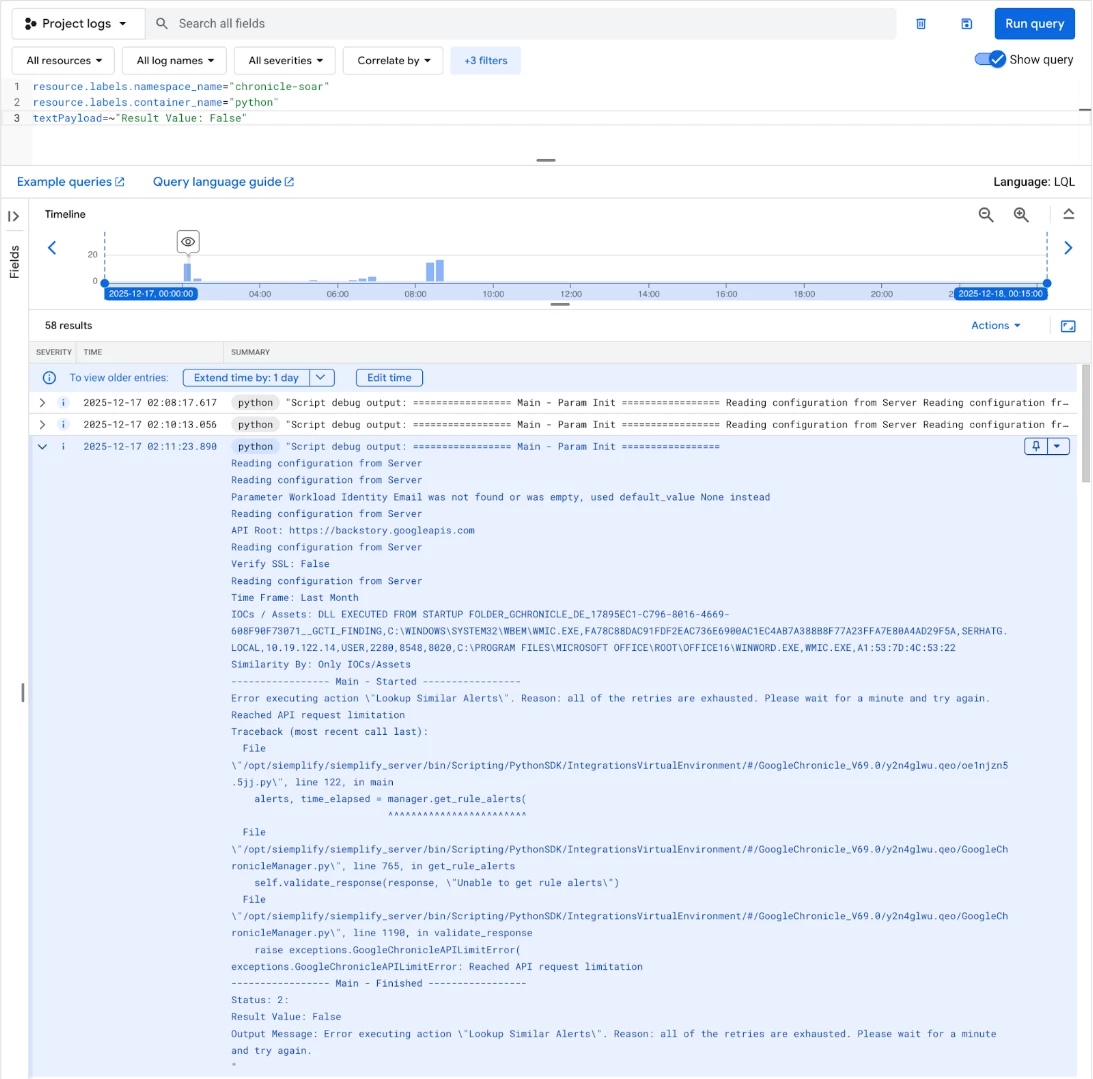
Failed Actions (General)
This query is powerful because it searches the raw log content (textPayload) for the specific string "Result Value: False". This directly identifies instances where an action completed but returned an unsuccessful outcome, regardless of the log's set severity level.
resource.labels.namespace_name="chronicle-soar"
resource.labels.container_name="python"
textPayload=~"Result Value: False"
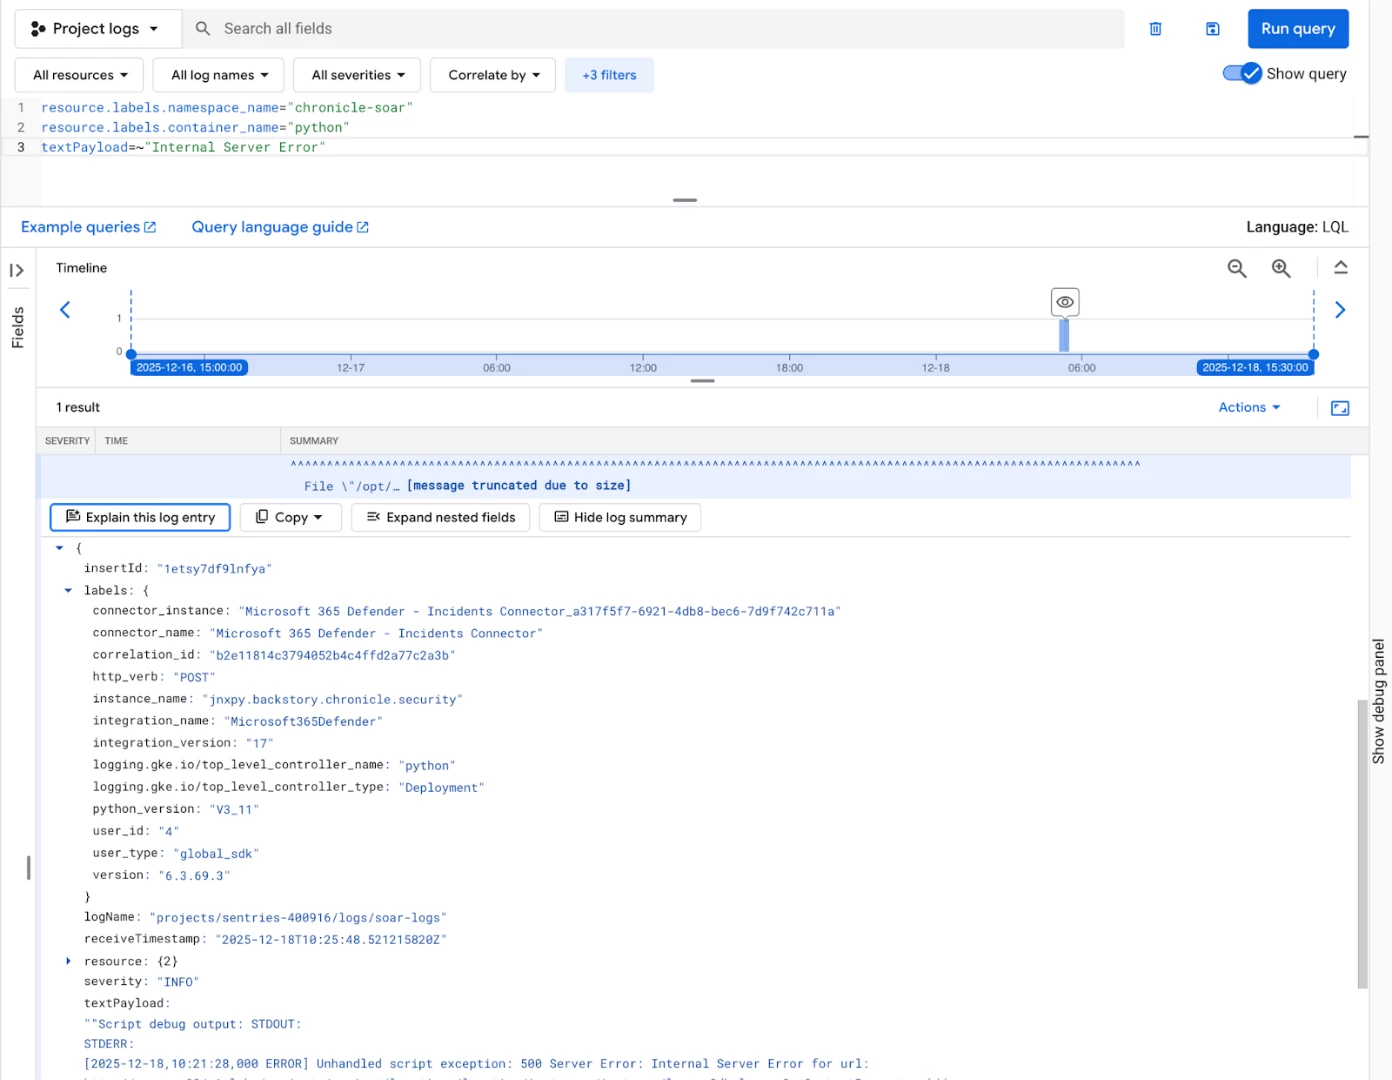
Internal Server Errors
Quickly identify systemic service issues by searching for critical application errors. These often point to configuration or resource problems within the environment.
resource.labels.namespace_name="chronicle-soar"
resource.labels.container_name="python"
textPayload=~"Internal Server Error"
III. Tracking System Processes (ETL & Correlation)
Core system tasks, such as Extract, Transform, Load (ETL) processes, are fundamental to data flow. Monitoring these for errors ensures that your ingested data is being processed correctly.
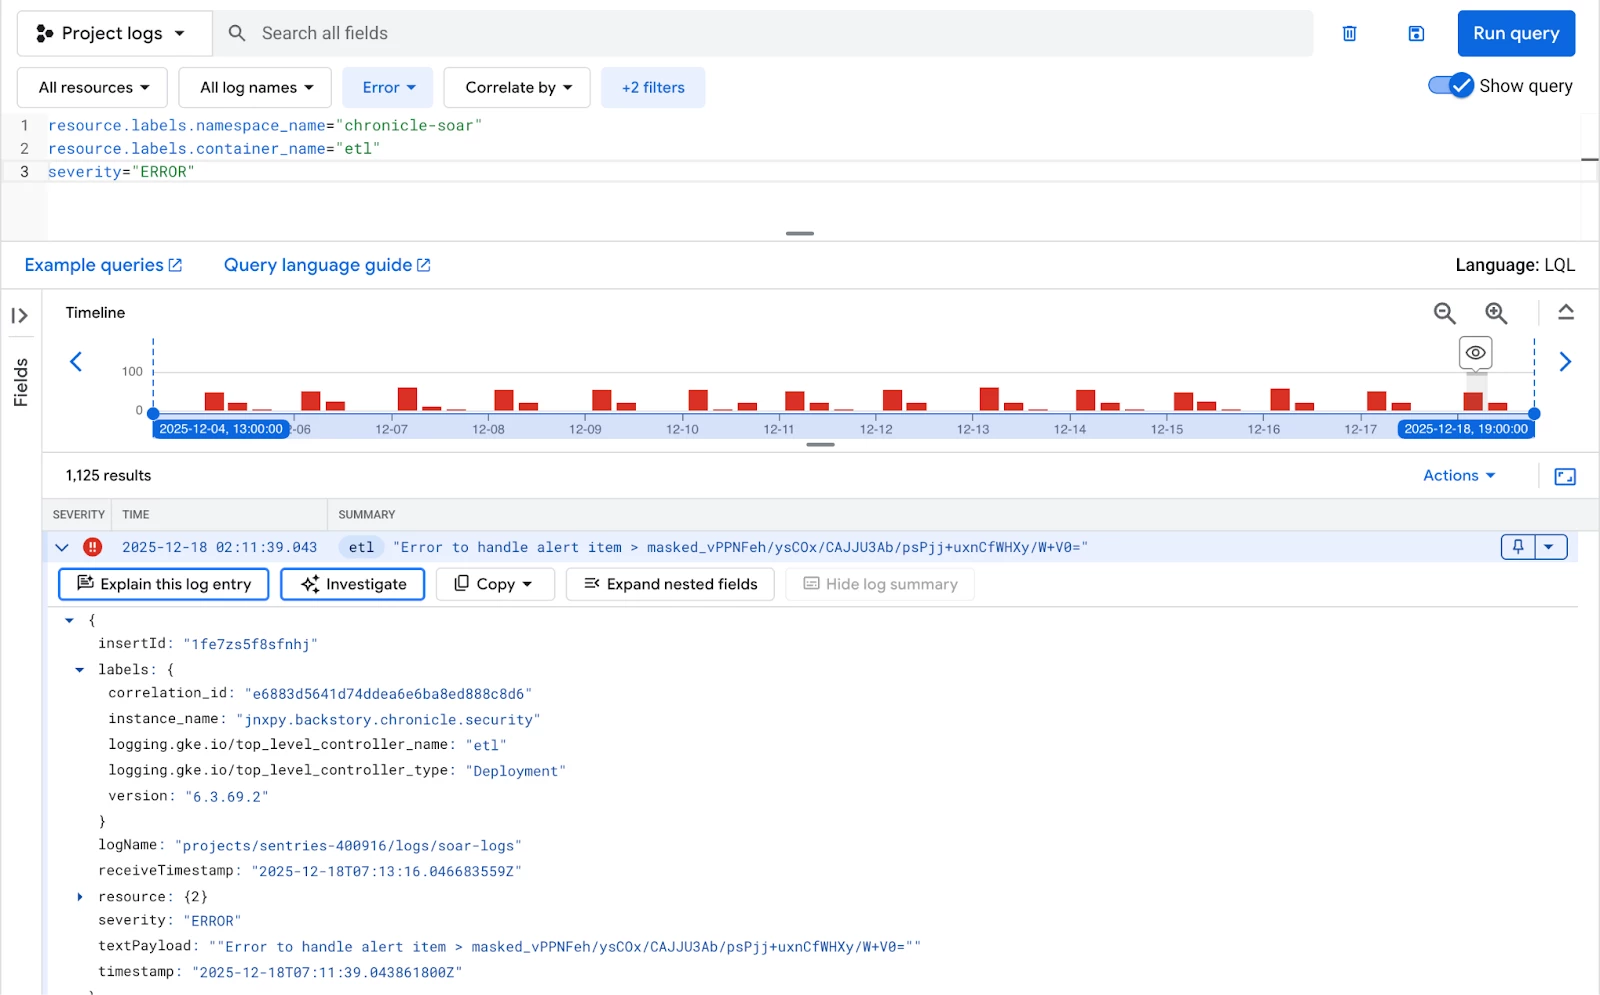
ETL Failures
Filter on the “etl” container and look for any log entry with a severity of "ERROR". Consistent ETL errors can indicate issues with data sources or transformation scripts. The only available label for the ETL container is correlation_id.
resource.labels.namespace_name="chronicle-soar"
resource.labels.container_name="etl"
severity="ERROR"
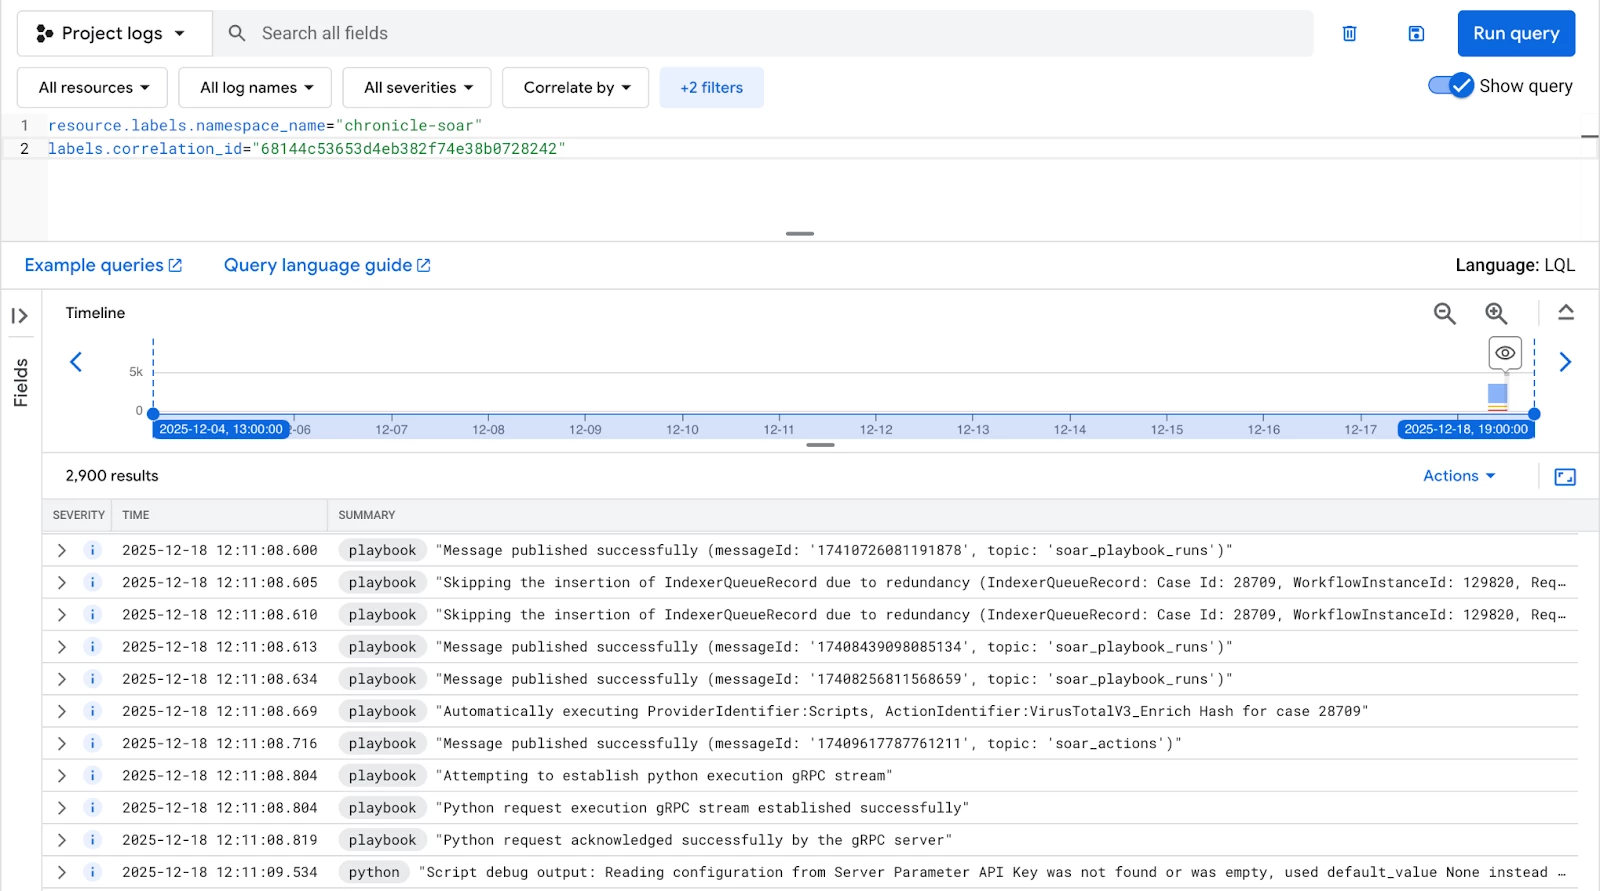
Correlation ID Tracking
Every significant action or process run has a unique correlation_id. Using this label allows you to pull all related logs (from playbook, python, and etl containers) for a single comprehensive view of a specific event's lifecycle.
resource.labels.namespace_name="chronicle-soar"
labels.correlation_id="e4a0b1f4afeb43e5ab89dafb5c815fa7"
Filtering by Timestamp
When investigating an incident that occurred at a known time, accurate temporal filtering is essential. You can use RFC 3339 or ISO 8601 formats for precise searches.
Logs Newer Than (Specific Time)
Use this to view all activity occurring after a known event, such as a deployment or a reported error.
timestamp>="2023-12-02T21:28:23.045Z"
Logs for a Specific Day Range
This inclusive/exclusive filter retrieves all logs within a defined period. For example, the query below would capture all logs from December 1st and December 2nd.
timestamp>="2023-12-01" AND timestamp<"2023-12-03"
V. Proactive Monitoring (Beyond Ad-Hoc Search)
While manual searches are great for debugging, true operational health requires automation. Consider setting up:
- Log-based alerts: Define alerts that trigger whenever one of the critical error queries (like textPayload=~"Internal Server Error") returns a log entry.
- Metric-based alerts : Create alerts for thresholds and rates
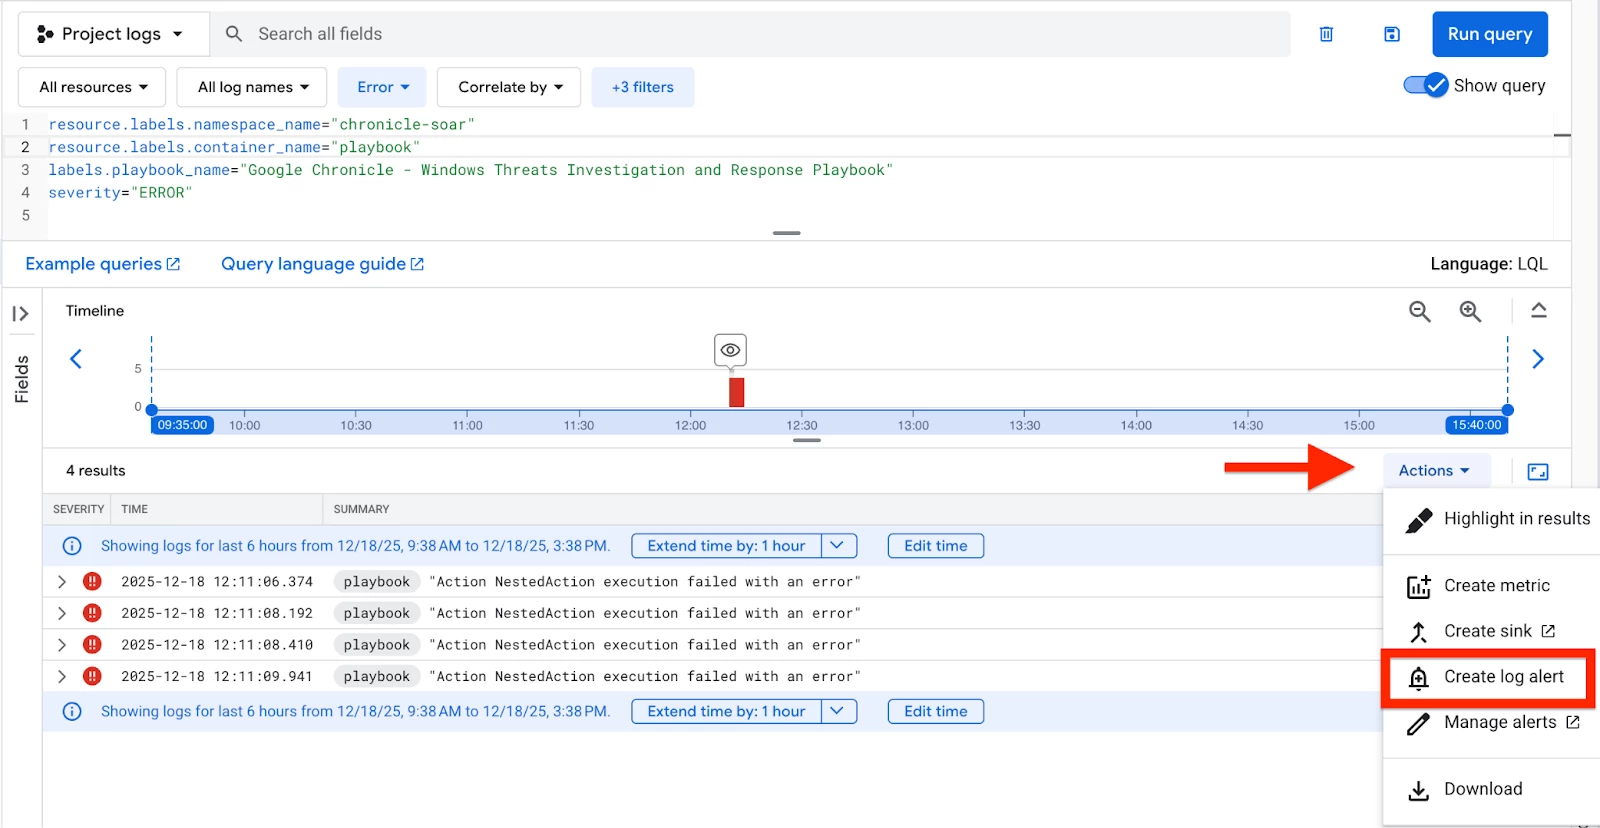
Let’s work through an example of a log based alert where we want to know if a critical playbook experiences failures.
First, we’ll start with our example query from earlier in the doc. We can then click the ‘Actions’ button, then ‘Create log alert’ to begin creating our alert.
The initial section requires the configuration of alert specifics, including the policy name, the appropriate severity level, and necessary documentation. The documentation field is crucial for providing contextual details about the alert and its relation to the log data.
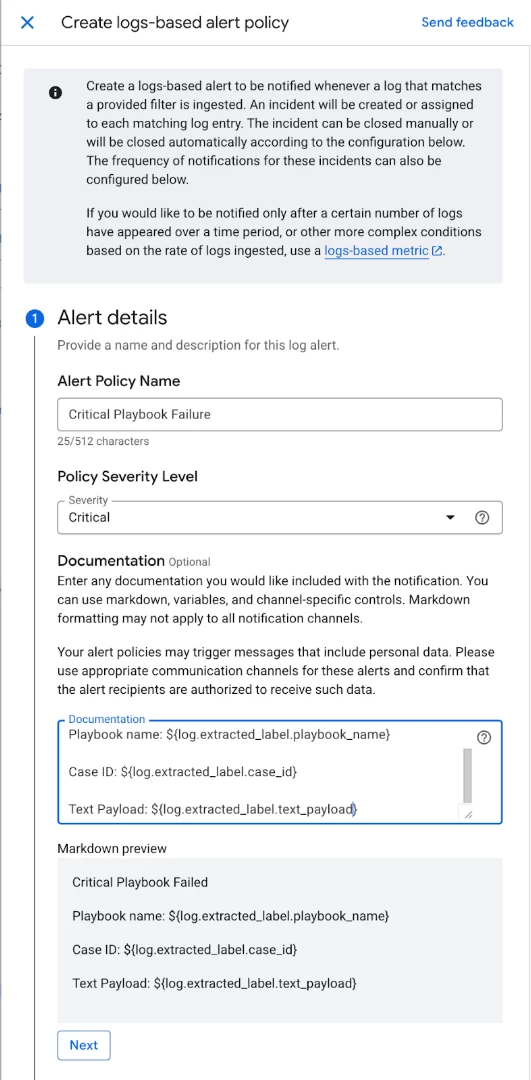
In the subsequent section, you designate which logs are pertinent to the alert. The log query will already be populated. You also have the option to extract specific log labels if required.

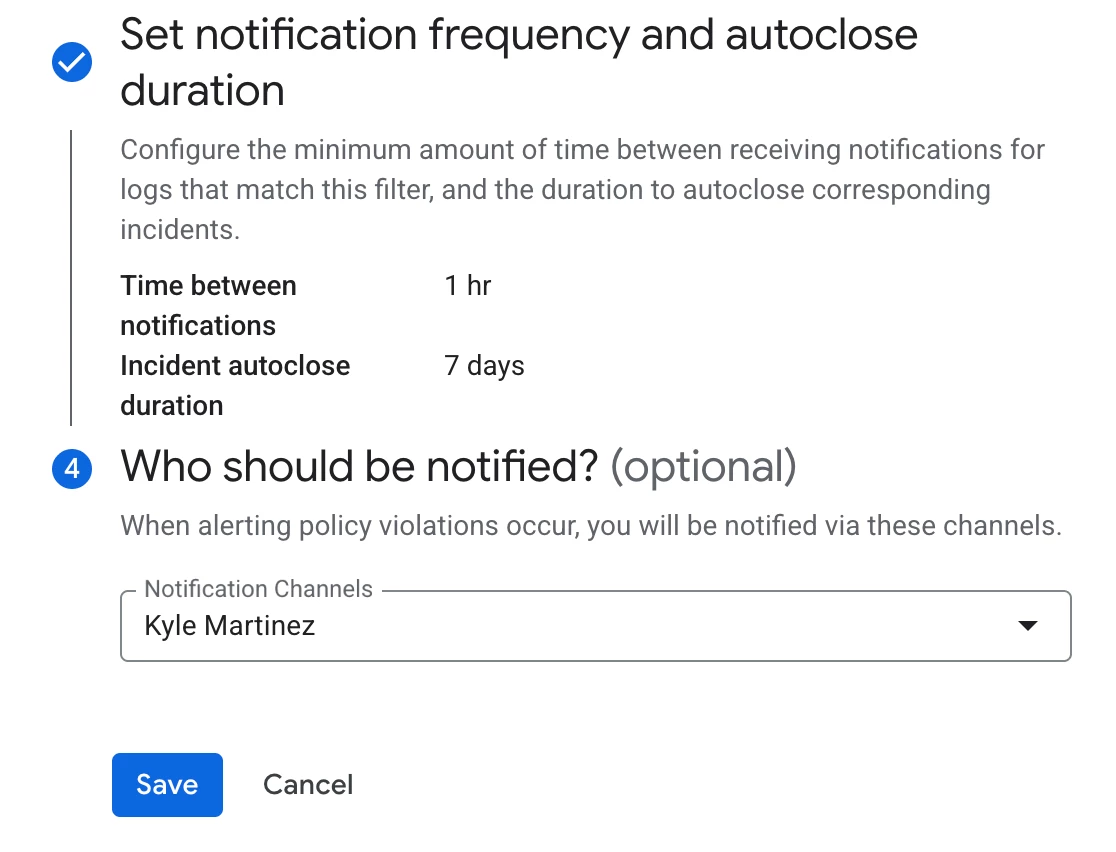
Finally, determine the notification frequency and specify the recipients. While this example focuses on sending an email notification, a variety of notification channels are available, such as Google Chat, Webhooks, and Slack. Further details on notification channels are accessible here.
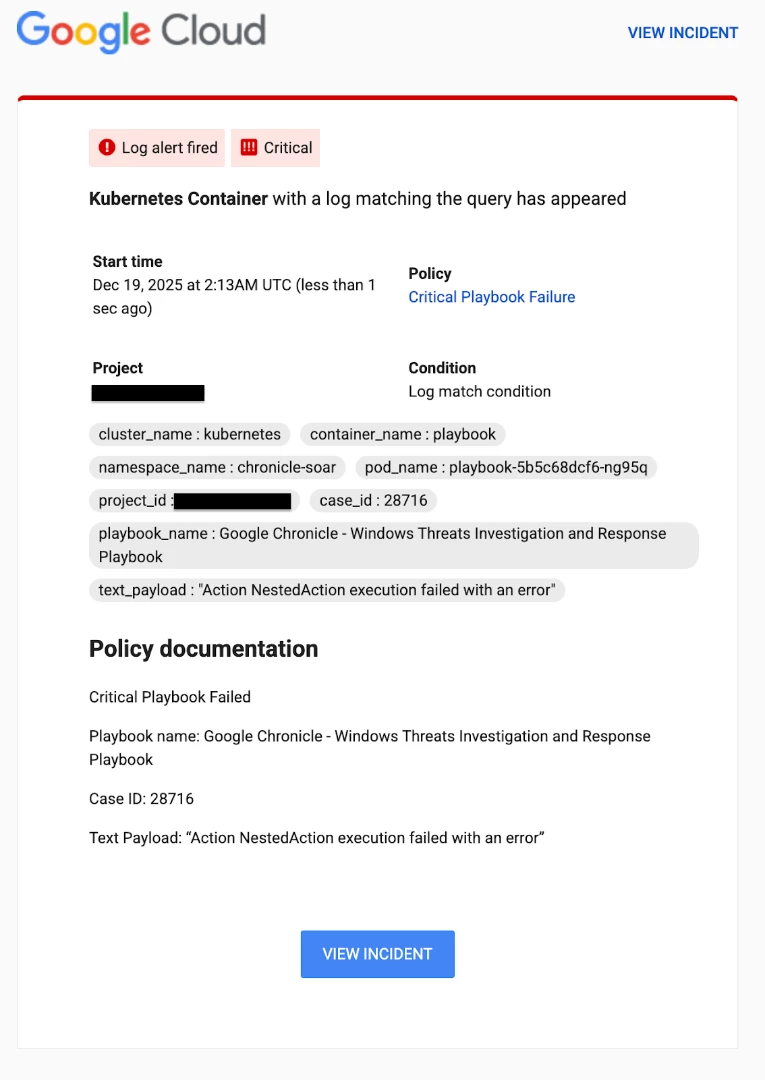
The example alert below illustrates both the extracted labels and the essential policy documentation, offering crucial contextual insight regarding the alert and its connection to the underlying log data.
Conclusion
Topic Conclusion: Ensuring Operational Readiness
Monitoring the operational health of your SOAR platform is not a one-time task; it is an ongoing necessity for maintaining the integrity and effectiveness of your security automation. By leveraging the Playbook Dashboards for high-level performance metrics and mastering the Logs Explorer for granular debugging and alerting, you are equipped to proactively identify, diagnose, and resolve issues related to:
- View playbook performance
- Python/playbook errors
- Remote agent errors
- ETL processes
Implementing these monitoring practices will ensure that your automated processes are consistently working as intended, maximizing your security team's efficiency and minimizing response latency. Let’s understand more about using this infographics below.