



Author: Yuriy Landovskyy, GCP Cloud Security Steward
Introduction
In Google SecOps, SOAR Connectors are responsible for ingestion of data from Google SecOps SIEM and the creation of Alerts, which are then handled as part of Case management.
The moment the connector stops working, it immediately creates a visibility hole in SOC operation as the alerts are invisible for the SOC analysts, playbooks can’t run and everything goes to a halt.
Knowing how to troubleshoot connectors can save critical time and ensure that SOC operations are not disrupted.
Use Cases
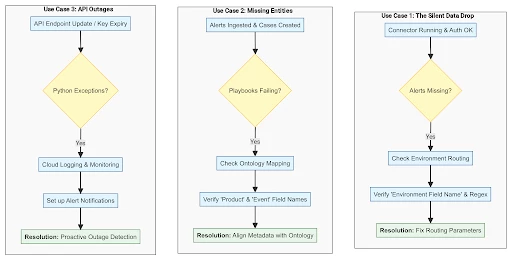
Use Case 1: The "Silent" Data Drop (Environment Routing Failure)
Example Scenario: A connector is successfully authenticating and running without Python syntax errors, but SOC analysts notice that alerts for a newly onboarded department or subsidiary are not generating Cases in the platform.
Use Case 2: Missing Entities & Broken Playbooks (Ontology Mismatch)
Example Scenario: Alerts are successfully ingested and Cases are appearing on the board. However, automated containment playbooks are failing because critical entities (like IPs, Hashes, or Hostnames) are missing from the Case wall.
Use Case 3: API Outages & Proactive Notification (Cloud Logging)
Example Scenario: A third-party vendor pushes an update that breaks their API endpoint, or an integration API key expires. The Python script begins to throw unhandled exceptions, and no new alerts are ingested.
Key Concepts
At its core, connector is a python script that is executed periodically as a cron job to fetch data from 3rd party products via API. Depending on the connector type, it can have unique custom parameters, which will influence the way the connector is going to handle data and the Alerts being created.
Still, there are certain parameters that are common and it’s important to understand, how they work:
| Parameter Name | Parameter Impact |
| Environment | This parameter dictates to which SecOps environment the Alerts should be pushed from the connector. |
| Environment Field Name | Just like the “Environment” parameter, this parameter is used to determine the target Environment for the Alert, but unlike the “Environment” parameter, this one allows you to do it dynamically. For example, if you have 1 Connector that fetches information from the EDR and you want to split Alerts based on “departments” into different SecOps Environments, then you need to provide “department” as value and the connector will search in the Alert information for the key “department” and match it against available Environments. |
| Environment Regex Pattern | This parameter is used together with “Environment Field Name” to more precisely extract data about the Environment. Let’s assume that you don’t have a proper key called “department” in the alert, but you have this information as part of the Alert title. In that case, you will put “title” in the “Environment Field Name” and then apply a regex pattern to only extract a substring from it. |
| Product Field Name | This parameter dictates the “Product Name” of the events associated with the Alert, which influences Ontology mapping. Most connectors have a fallback value for this parameter, so that even if an invalid key is used, there is still a value that can be used. It’s not a problem, if the key is not resolved, it will not break the ingestion, but it can lead to an ontology mismatch and entities will not be extracted, so it’s still important to be careful here. |
| Event Field Name | Works similarly to “Product Field Name”, but this parameter is determining the event type of the “Event” for the ontology mapping. |
| Max Alerts To Fetch | This parameter can have different variations depending on the connector (Max Incidents To Fetch, Max Security Events To Fetch etc), but the core idea is that this parameter dictates how many alerts should be created in 1 connector iteration. |
| Max Hours Backwards | This parameter can also have different variations. Its purpose is to tell the connector, from which timestamp it should start ingestion. It’s important to emphasize that this parameter is only used in the 1st iteration of the connector and after 1 successful iteration, it will be ignored moving forward. |
| Padding Hours | Sometimes in the connectors, you may see parameters that are referencing padding. Unlike “Max Hours Backwards”, this parameter influences the timestamp on every iteration. The way it works is that if “Padding Hours” == 1, then on each connector iteration, the connector is going to fetch data in the time range of current_time and current_time-1 hours. This is needed only for situations, where data from 3rd party products may appear in the API with a delay. |
| Disable Overflow | This parameter is responsible for the disabling of the overflow mechanism that is a part of the connector. If this parameter is enabled, then the connector will dismiss the conditions that create “Overflow Cases”. But it’s important to know that there is also an overflow mechanism at “ETL” level, which will dismiss alerts completely, if there was a big spike of similar alerts in a 15 minute window. |
| Use dynamic list as a blocklist | As part connector configuration, we also support “Dynamic List”, which in most cases is responsible for filtering Alerts. Each connector can have its own implementation of the Dynamic List. If this parameter is enabled, then the connector will treat all of the entries inside the dynamic list with a flipped logic. Instead of “include”, it’s going to be “exclude”. |
Test Run Connector
Before enabling the connector, you should do a test run. To do it, you need to open the “Testing” tab and press on the “Run connector once” button.
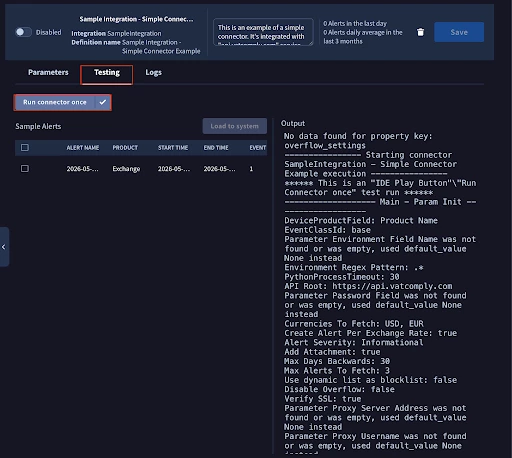
If all is good, it’s expected that you will see a green checkmark. Keep in mind that even if you didn’t “ingest” any alert, it doesn’t mean that the connector didn’t work. It can just mean that there was no data to ingest for that connector iteration.
If there are errors, then I suggest you copy the traceback and share it with Gemini or other chatbots. They will be able to explain to you what may be the problem.
Additionally, it’s important to know what actually happens, when you press on “Run connector once”. Basically, everytime you run the connector like this, it spawns a new connector instance in the background for this testing operation. The results of the execution are not persistent, so any time you run in the connector, it’s as if it’s 1st iteration always.
Logs Tab
As part of the connector architecture, you are able to stream logs from the enabled connector and validate, if the iterations are executed successfully. To enable log collection, you need to go to “Logs” tab and press on the “Enable Log Collection Button”.
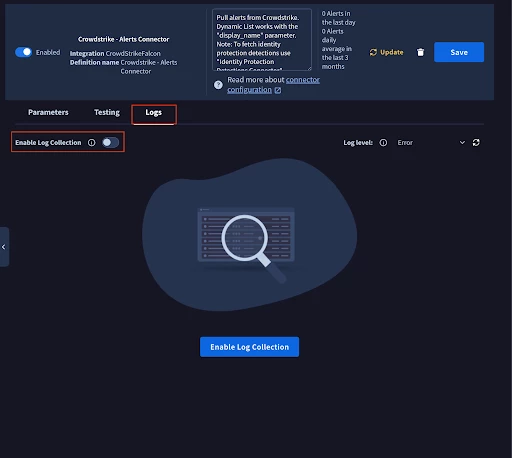
These logs are enabled for 3 hours and you can monitor for any logs that have “error” status, but the general recommendation is to read all logs as there may be valuable information there.
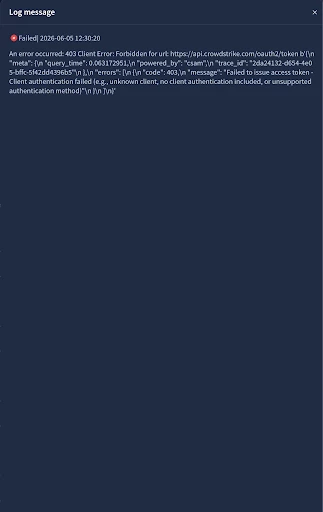
Logs will only appear after the iteration has finished execution. Here is an example of those logs:
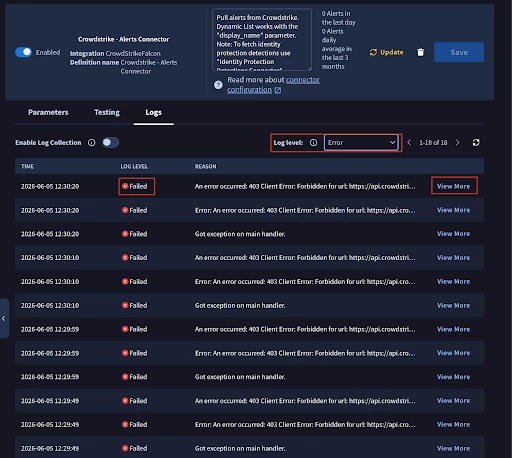
To see the logs in more detail, you need to press on the “View More”, which will open a sidebar with more information.
Cloud Logging
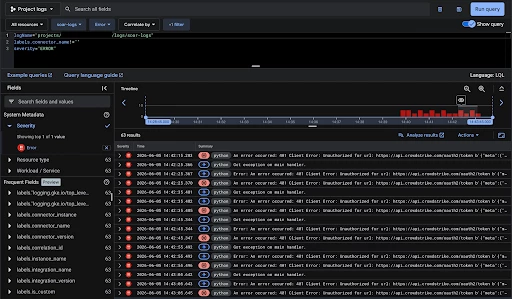
In 2026 we introduced a way for you to consume connector logs directly from the Cloud Logging service of your BYOP (bring your own project) Google Cloud project. It’s only available for BYOP tenants with unified Google SecOps deployment that have finalized the migration to GCOM.
There are a lot of benefits using Cloud Logging for this agenda, as you can monitor logs indefinitely and it’s not bound to a 3 hour window. Still, you can expect a few minutes delay before the data will become available in your Cloud Logging instance.
Below are some example queries:
Query 1: Fetch all ERROR logs related to any connector
logName="projects/adoption-guide/logs/soar-logs"
labels.connector_name!=""
severity="ERROR"
Query 2: Fetch all logs related to a specific connector
logName="projects/adoption-guide/logs/soar-logs"
labels.connector_name="Google Chronicle - Chronicle Alerts Connector 1"
Query 3: Fetch error logs related to a specific connector
logName="projects/adoption-guide/logs/soar-logs"
labels.connector_name="Google Chronicle - Chronicle Alerts Connector 1"
severity="ERROR"
Here is how it’s going to look like:
Additional benefit of using Cloud Logging is that you can set up alert notifications:
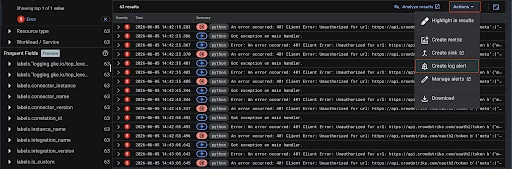
You can set up the interval, the notification channels - everything that you will need to be notified about the problems as soon as possible.
Keep in mind that sometimes there can be transient errors coming from 3rd party products and with the way connectors are designed you shouldn’t expect any data loss in those scenarios.
Troubleshooting Ontology Mapping Issues
As connector is responsible for the definition of Product and Event Types on the events associated with the Alert, then there can be a situation, where connector misconfiguration led to entities not being extracted correctly and important metadata (timestamps) missing.
A brief reminder. As part of the ontology architecture, we have 3 levels:
- Source
- Product
- Event

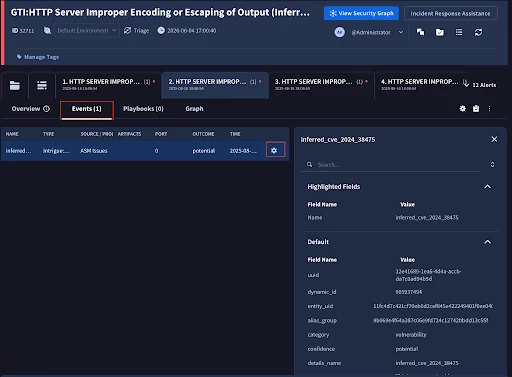
These 3 levels tell the platform which ontology mapping should be applied to that event. In the screenshot above, the mapping will be taken from GoogleThreatIntelligence -> ASM Issues -> Intrigue::Entity::Uri ontology.
For example, if the product name inside of the event would be changed to just “ASM” like this:
GoogleThreatIntelligence -> ASM -> Intrigue::Entity::Uri
then it would be considered a completely different mapping. That’s why it’s important to monitor that “Product Field Name” and “Event Field Name” parameters are assigned correctly.
To understand what mapping was applied for the event, you need to go to Alert details, then the “Events” tab and then press on the “Configure Event” button.
IDE Testing
If you are developing a custom connector, then you may consider testing the connector directly in the IDE. It’s definitely a viable path, but it can also be a little bit frustrating as the parameters are not persistent and every time you refresh the page you will need to provide all input parameters again.
The recommendation is to properly configure, create that connector instance and whenever there is an update, you need to press on the “yellow” updated button and then perform test runs from the main connector page.
Response Integration & Connector Update
It’s important to understand that Response Integration update doesn’t force a connector update. You need to manually update connectors after changes were added to them.
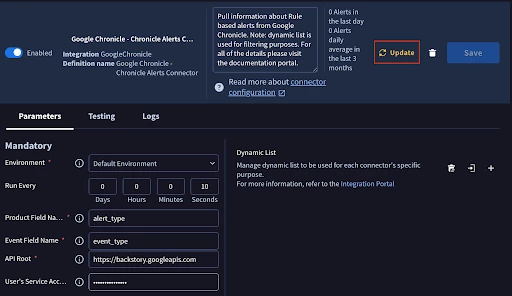
There is an alternative path. You can use “Response Integration & Connector Upgrade Job” from Siemplify integration that will automatically update all connector instances after the integration update.
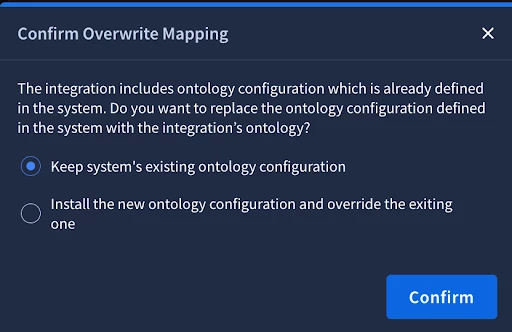
Additionally, as part of integration updates, you may get changes to the ontology. If you’ve made custom changes to the ontology, then you need to make sure that you don’t accidentally overwrite them. You will be prompted about it during the update process:
Conclusion
Effective SOC operations rely heavily on the continuous and accurate ingestion of data. While Google SecOps SOAR connectors are designed to run autonomously, understanding their underlying mechanics—specifically how parameters dictate data handling and routing—is essential for maintaining a healthy security posture.
By proactively utilizing features like the Test Run, enabling localized Connector Logs, and implementing robust monitoring through Cloud Logging, engineering teams can rapidly diagnose issues ranging from silent data drops due to environment misconfigurations, to playbook failures caused by ontology mismatches. Mastering these troubleshooting methodologies ensures that when a connector inevitably encounters an API change or a bad data structure, your team can resolve the issue before it impacts your time-to-respond.
