

Author:
Bernie Weidel, Security Advisor, Google Cloud Security
Introduction:
For years, the Security Operations Center has been defined by friction. As enterprise data volumes exploded, the concept of the SIEM evolved from a mandatory compliance logging repository into a full-lifecycle security workflow. Today, practitioners are expected to master ingestion pipelines, raw log transformations, threat intelligence enrichment, high-speed querying, detection engineering, and SOAR playbooks. Yet, despite these advancements, analysts still spend a majority of their day searching through logs and struggling with syntax. Translating a simple search—like identifying if any brute force attacks were successful in your environment—into a complex query language can take longer than the investigation itself.
In the age of generative AI, Google SecOps is actively eliminating this friction by integrating Gemini directly into analyst workflows. Nowhere is this step-function improvement more noticeable than in the platform's Search interface—specifically, Natural Language Search (NLS) for UDM, and via the Gemini Investigation Assistant.
By leveraging SecLM, Google’s security-tuned large language model, Gemini acts as a universal translator between human intent and massive data lakes. It fundamentally removes the technical barrier to entry, transforming the SOC from a reactive, syntax-heavy environment into a proactive, conversational one. A SOC analyst on day one of their SIEM journey can simply type out their hypothesis in plain English, and Gemini instantly and accurately parses the intent, translating it into perfect UDM search code. What historically required an analyst to undergo months of proprietary query language training to master is now available at their fingertips in seconds. In this article, we’ll explore how this AI integration goes far beyond simple query generation, fundamentally redefining the entire SecOps lifecycle from initial threat hunt to automated detection and executive reporting.
The Old Way vs. The New Way
In legacy SIEM environments, threat hunting has historically been an exercise in friction and cognitive overload. When an interesting event was flagged by an IPS or endpoint tool, analysts were forced into a painstaking process of manual pivoting. Expanding a timeframe, filtering for specific protocols, or cross-referencing allowed versus blocked actions required writing and rewriting complex, proprietary query syntax. If you were lucky, your SOC maintained a shared repository or a cheat sheet of common searches. If not, analysts—especially juniors—were left struggling with a steep learning curve, spending more mental energy debugging their queries than actually analyzing the threat behavior. This steep technical barrier to entry artificially bottlenecks the SOC, drastically slowing down investigations and inflating the Mean Time to Detect (MTTD).
The paradigm shifted in 2023 when Google SecOps became the first SIEM to incorporate generative AI natively into its core workflows, introducing Natural Language Search (NLS) for the Unified Data Model (UDM). This unassuming search bar wielded immense operational power by attacking the syntax barrier directly. Instead of forcing the human to learn the language of the machine, the machine finally learned the language of the human.
Building on this foundation, Google SecOps introduced the Gemini Investigation Assistant—a context-aware analytical partner that transforms how analysts interact with data. Instead of spending time writing complex search queries, users can iteratively filter results through natural conversation, simply asking the AI to "exclude internal IPs" or "group by domain." The Assistant instantly synthesizes these refined logs into clear, conversational summaries, drastically reducing analysis time for end users. The Gemini Investigation Assistant also bridges the gap between threat hunting and detection engineering. Once malicious behavior has been isolated, analysts can seamlessly pivot their workflow, instructing the Assistant to draft a production-ready YARA-L detection rule or generate a SOAR response playbook based on that exact context, creating an unbroken pipeline from initial alert to automated defense.
Core Capabilities of Gemini Search in SecOps
Gemini in Google SecOps goes far beyond functioning as a simple text-to-code generator. Instead of just executing commands, it operates as an interactive, context-aware assistant embedded directly into the analyst's workflow. This integration fundamentally shifts how security teams interact with their telemetry across four core operational pillars.
The foundation of this shift begins with Search and Investigation. In traditional SIEM environments, analysts are forced to write complex, monolithic queries. If the results are too noisy, they must manually rewrite the code to adjust parameters or add exclusions. Gemini transforms this into a conversational, iterative process. An analyst can run an initial, broad natural language search and then seamlessly converse with Gemini to refine the data. By simply typing "filter out our internal scanner IPs" or "group these results by the target hostname," Gemini dynamically updates the underlying UDM syntax while maintaining the context of the investigation. This conversational stacking allows analysts to drill down into massive datasets organically, mimicking how they might troubleshoot an issue with a colleague sitting next to them.
Beyond just retrieving data, Gemini acts as a critical triage multiplier through its Contextual Summaries. Staring at hundreds of rows of raw JSON or UDM logs is mentally taxing and time-consuming. When Gemini returns search results, it doesn't just throw the raw logs back at the user; it analyzes the dataset and provides a plain-English, conversational summary of what the events actually mean. It highlights statistical anomalies, aggregates commonalities—such as noting that 90% of the blocked traffic originated from a single ASN—and even suggests logical follow-up actions. This approach drastically reduces the cognitive load on analysts, allowing them to grasp the narrative of an attack in seconds.
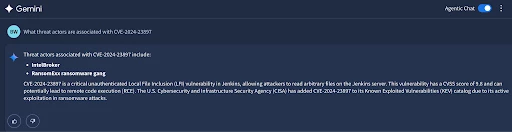
To truly understand that narrative, analysts need context, which brings us to the third capability: Threat Intel Q&A. Historically, investigating an unknown indicator of compromise (IOC) required severe context switching. Analysts would have to copy an IP, domain, or CVE, open a new browser tab, and pivot through various threat intelligence portals. Gemini eliminates this friction by bringing Google Threat Intelligence (GTI) and Mandiant's frontline data directly into the chat pane. Analysts can pause their hunt to ask, "What threat actors are associated with this CVE?" or "Is this domain known to distribute malware?" Gemini instantly cross-references these industry-leading intelligence repositories, delivering deep, actionable context right alongside the security telemetry.
Finally, the power of Gemini Search extends far Beyond Search itself. While threat hunting is the entry point, the ultimate goal of a SOC is to engineer resilient defenses. Gemini acts as the connective tissue across the entire SecOps lifecycle. The exact same natural language engine that helps an analyst find a threat can be used to engineer the automated response to it. Users can prompt Gemini to transition their search logic into structured YARA-L 2.0 detection rules, draft SOAR playbooks to automate the containment of compromised hosts, and construct Native Dashboards to visualize the risk. This unified capability shifts the analyst's focus away from struggling with complex search syntax, and toward actual security engineering.
Navigating the Interface: UDM Search vs. The Investigation Assistant
While Gemini is infused throughout Google SecOps, understanding exactly where to engage Gemini is critical for optimizing your SOC workflows. There are two primary interfaces for Gemini Search within the platform, and each is purposefully tailored to distinct phases of your security operations.
The first interface is the inline Natural Language Search bar located directly at the top of the UDM Search page. This input is engineered for the tactical, single-shot SIEM search. When an analyst needs to rapidly query ingested security telemetry—such as pulling a list of blocked firewall events or verifying the presence of a specific file hash—they can simply type their request in plain English. Powered by SecLM, this top bar acts as an instantaneous query translator. It automatically maps your natural language intent to the correct UDM fields and syntax, entirely abstracting the underlying data schema. This acts as a massive force multiplier, particularly for junior analysts, as it enables immediate operational productivity on Day 1 of using Google SecOps. It allows you to execute precise data retrieval without wasting time hunting through documentation to construct the perfect query.
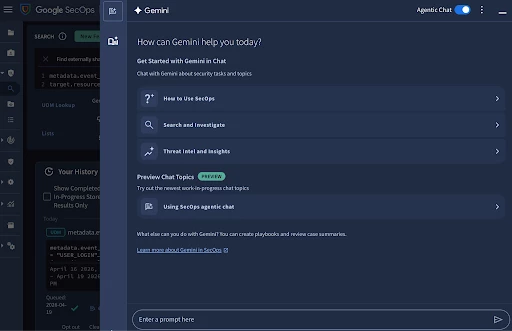
However, when a routine search uncovers something suspicious and evolves into a complex, multi-layered threat hunt, the workflow demands a tool that can retain context and support a full-scale inquiry. This is the exact moment analysts should pivot to the Gemini Investigation Assistant, located in the right-hand side panel of the UI. Unlike the transactional nature of the inline search bar, the Investigation Assistant provides a stateful, conversational experience specifically designed for conducting deep investigations. It allows you to run an initial query and iteratively drill down into the resulting dataset by stacking conditions—such as asking Gemini to "exclude internal IP ranges" or "group the remaining results by target hostname"—without having to rewrite the query from scratch.
Furthermore, Gemini Investigation Assistant serves as the command center for advanced SecOps workflows. Because it retains the thread of your ongoing investigation, you can seamlessly branch out to query Google's massive threat intelligence datasets, asking for behavioral context on a specific APT or details regarding a newly published CVE. Once your investigation has successfully isolated the malicious behavior, you can execute the ultimate pivot: commanding the Investigation Assistant to draft a structured YARA-L detection rule based entirely on the conversational context you just built.
Ultimately, the choice of interface dictates the depth of your workflow. For standard, transactional SIEM searches where the goal is rapid, ad-hoc data retrieval, the inline UDM Search bar is your most efficient tool. However, for conducting comprehensive investigations that require iterative filtering, threat intelligence enrichment, and the eventual transition into Detection Engineering, Gemini Investigation Assistant provides the context-aware environment necessary to drive the complete SecOps lifecycle.
Example 1: The Iterative Threat Hunt
Let’s walk through a common SIEM scenario: investigating suspicious authentication activity. In a traditional environment, finding this data usually begins with an analyst digging through documentation to remember the exact Unified Data Model (UDM) fields required to represent specific authentication actions and outcomes. With Gemini in Google SecOps, you can bypass the syntax translation entirely and simply ask Gemini what you are looking for in plain English. For example, you might start your investigation by entering the following into the Gemini search pane:
Prompt: "Show me all failed logins in the last 3 days."
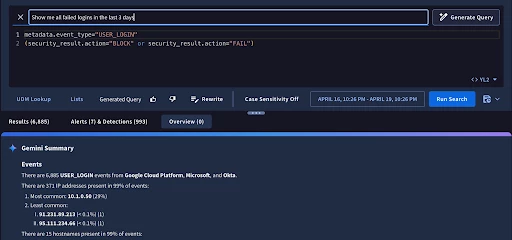
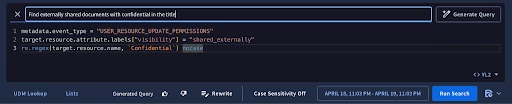
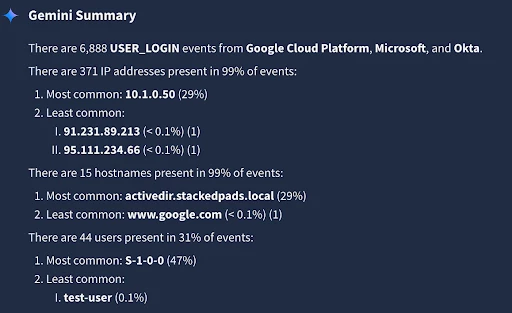
Instantly, Gemini processes your natural language request and generates the underlying UDM search syntax—specifically translating your words into metadata.event_type = "USER_LOGIN" AND security_result.action = "BLOCK". But it doesn't just stop at running the query and returning a massive wall of raw logs. Instead, Gemini provides a conversational summary of the results. It might inform you that it found 4,500 failed login attempts over your specified time window, and it will often automatically aggregate the data to point out trends, such as noting that the vast majority of these failures stem from three specific user accounts. This immediate summarization gives analysts a vital jumping-off point without requiring them to manually pivot or write aggregate functions.
Of course, in a moderately sized enterprise, 4,500 failed login events over three days is simply too much noise to manually review, and most of it is likely benign user error (like expired passwords or typos). This is where the iterative power of Gemini Search truly shines. Because Gemini retains the context of your ongoing investigation, you don't need to write a brand-new, highly complex query from scratch to filter down your results. You can just converse with Gemini to perform a more comprehensive hunt, stacking your conditions naturally. To zero in on actual threats, you might follow up with:
Follow-up prompt: "Filter this to only show failed logins for administrative accounts where the source IP is outside of the United States."
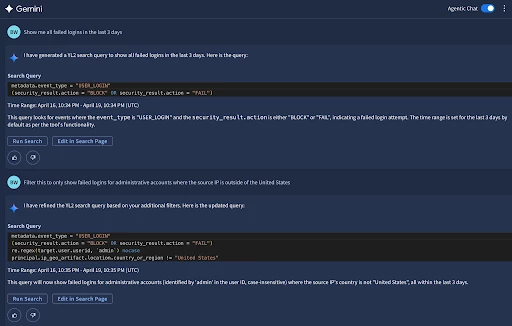
Gemini understands the context of the previous query and dynamically updates the UDM search. It seamlessly incorporates geographic enrichment fields, adding principal.location.country_or_region != "US", and applies identity context parameters to filter specifically for accounts with administrative privileges. It then structures the output to group the data by the target domain as requested. Within seconds, the AI cuts through the noise, paring down those 4,500 generic failures into just 12 highly suspicious, actionable events. What normally requires deep familiarity with UDM joins, aliasing, and enrichment schemas is reduced to a simple conversation, providing you with a precise, high-fidelity dataset ready for immediate investigation.
💡 Gemini Pro Tip: The Anatomy of a Perfect Prompt
To get the most accurate and actionable search results from Gemini, refine your search prompts to include these four core building blocks:
-
Objective: What is your core intent? (e.g., Show me, Search for, Summarize, Correlate)
-
Entity / Indicator: What specific data points are you pivoting on? (e.g., specific IPs, hashes, users, or distinct behaviors like failed logins and service account creations)
-
Timeframe: What are the exact chronological boundaries? (e.g., in the last 3 hours, yesterday, between 8:00 AM and 1:00 PM on May 1)
-
Action / Output: How do you want Gemini to handle the data once found? (e.g., group the results by target domain, extract the unique hostnames, generate a detection rule)
By formatting your search prompts with these elements, you drastically speed your time from initial search to desired results.
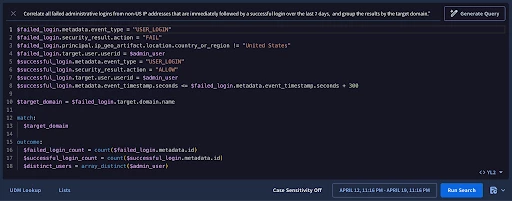
An example of a highly effective prompt:
“[Objective] Correlate [Entity] all failed administrative logins from non-US IP addresses that are immediately followed by a successful login [Timeframe] over the last 7 days, [Action/Output] and group the results by the target domain.”
Example 2: From Search to Detection Rule
Finding those 12 highly suspicious events is a massive win for an active threat hunt, but in a modern SOC, the investigation doesn't end there. Once you've identified a malicious behavior pattern, the next logical step is to ensure your SIEM catches it automatically the next time it happens. Historically, transitioning from an ad-hoc search to a production-ready detection required a hand-off to a specialized Detection Engineering team. Now, Gemini democratizes this entire process, allowing the analyst who found the threat to immediately build the detection for it.
Because Gemini retains the context of your conversational threat hunt, you don't need to explain the parameters all over again. You simply ask the AI to translate your refined search into a detection rule:
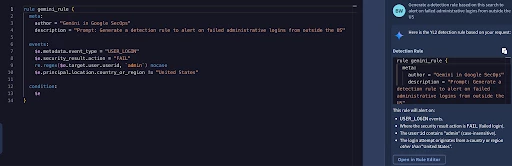
Prompt: "Generate a detection rule based on this search to alert on failed administrative logins from outside the US."
Without missing a beat, Gemini drafts a fully structured YARA-L 2.0 rule. It automatically populates the meta section with a description, structures the events block by assigning an event variable (like $e1) to the specific UDM fields we filtered for earlier—such as metadata.event_type = "USER_LOGIN", security_result.action = "BLOCK", and the geographic and administrative identity exclusions—and sets up the basic condition block to trigger an alert. What used to be an intimidating coding exercise is now instantly drafted for your review.
However, a static rule that just alerts on failed logins might still generate false positives. To make this a truly high-fidelity, behavioral detection, we need to look for a sequence of events: specifically, a brute-force attempt that eventually succeeds. With Gemini, you can easily stack this complex logic using natural language.
Follow-up prompt: "Update this rule to trigger if there are 5 or more failed logins from an IP located outside of the US, followed by a successful login from that same IP.."
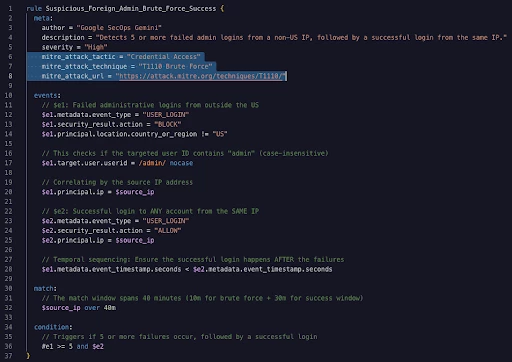
Gemini instantly overhauls the logic of the drafted rule to accommodate this multi-event correlation. It updates the events block to define two distinct variables: $e1 for the failed authentication attempts and $e2 for the successful login (where security_result.action = "ALLOW"). It then applies the match block to tie these disparate events together by their shared source IP address. Finally, it constructs a sophisticated condition block that identifies their relationship, ensuring that at least 5 instances of $e1 failed authentication occur, followed by the occurrence of $e2 successful login. The analyst’s role shifts from writing code to simply reviewing the AI's logic. You verify the parameters, adjust the severity, and deploy it to production.
💡 Gemini Pro Tip: Automated MITRE ATT&CK Mapping
A well-documented rule needs proper framework mapping, but digging through the MITRE matrix to find the exact technique numbers can disrupt your workflow. Instead of manually looking up IDs, simply ask Gemini to do the heavy lifting for you.
Prompt: "Add the relevant MITRE ATT&CK tactics and techniques to the meta section of this rule."
What happens: Gemini evaluates the behavioral logic of your brute-force-to-success rule and automatically appends the correct reference tags to the meta block. It will intelligently add key-value pairs like mitre_attack_tactic = "Credential Access" and mitre_attack_technique = "T1110 Brute Force", ensuring your newly minted detection seamlessly integrates into your broader threat framework and reporting dashboards.
The Golden Rule of Detection Engineering: Monitor Before Alerting
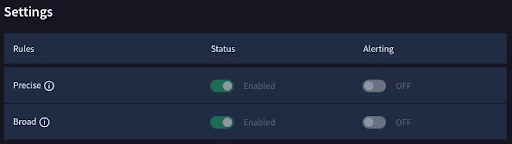
While Gemini drastically accelerates rule creation, deploying these detections into production requires discipline. The most common pitfall for new Detection Engineers is setting a newly drafted rule to both "Enabled" and "Alerting" immediately. Even a logically sound rule—like our foreign admin brute-force detection—can trip over edge cases like misconfigured proxies or authorized vulnerability scanners. Prematurely alerting on these conditions can flood the Case Management queue, leading to alert fatigue and a loss of confidence in AI Powered workflows.
To prevent this, Google SecOps best practice recommends a 1-2 week tuning period. When deploying a Gemini generated rule, enable it to run "Live" against incoming telemetry, but keep the "Alerting" toggle disabled. In this silent monitoring mode, the rule logs detections without generating active alerts or opening formal cases. It is highly recommended to let a new rule "bake" in this state for at least seven to fourteen days to account for normal business cycles, including weekend maintenance or scheduled jobs.
During this tuning window, periodically review the silent detections. If the rule triggers on authorized behavior, simply feed that context back into the Gemini pane and ask Gemini to append the necessary exclusion logic to your detection code. Once you have confirmed a near-zero false-positive rate, toggle "Alerting" to the on position. This critical pivot transforms a silent backend match into a front-line operational priority, generating an actionable Case within the platform’s SOAR module. By adhering to this phased deployment strategy, security teams ensure that every alert hitting the SOC floor is high-fidelity, fine-tuned, and genuinely warrants an analyst's attention.
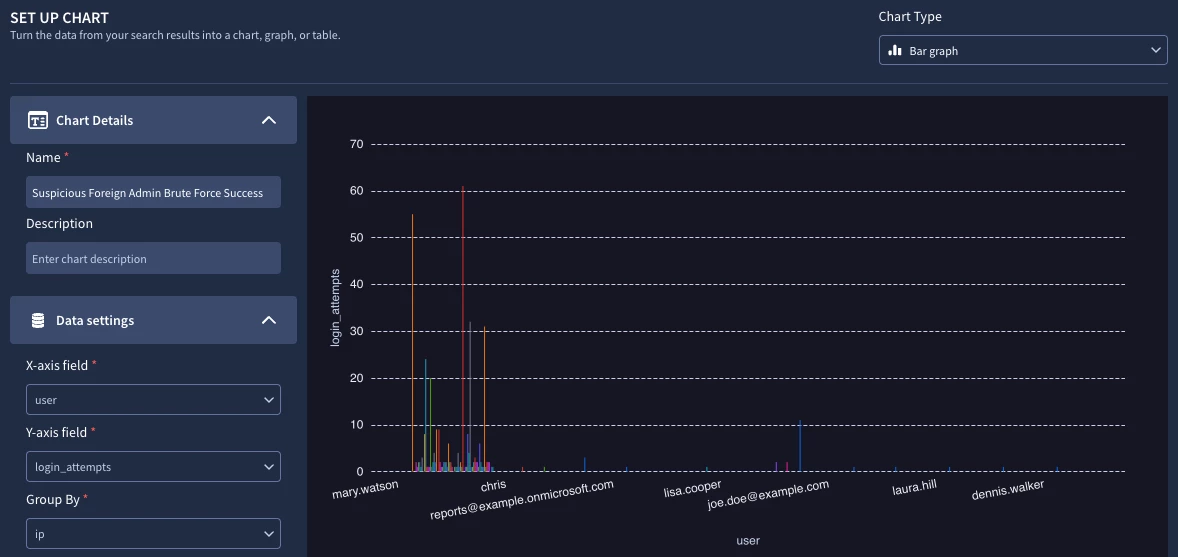
Example 3: Visualizing Risk with Native Dashboards
Searching for historical threats and deploying automated detection rules are critical pillars of a modern SOC, however they represent only part of the lifecycle. Once a high-fidelity threat—like our scenario of successful administrative logins following repeated brute-force failures from foreign IPs—is actively being detected, the business requires visibility. This is where the workflow pivots from the tactical weeds of detection engineering to the strategic high ground of reporting and metrics via Google SecOps Native Dashboards.
Before diving into the creation process, it is important to understand the fundamental architectural differences between a standard UDM search query and a dashboard query. When an analyst runs a UDM search, the goal is to retrieve rows of log data or isolated alerts. The syntax is flat and transactional (e.g., metadata.event_type = "USER_LOGIN"). A dashboard query, however, is fundamentally analytical and dimensional. Because Native Dashboards in Google SecOps are designed to render visual widgets—like bar charts, time-series graphs, and pie charts—the underlying query language requires specific structural components. You cannot simply pass raw logs to a bar chart; you must define the axes. This means a dashboard query heavily relies on explicit data source definitions (often utilizing prefixes like events., alert., or case. to point to the correct internal dataset) coupled with aggregate functions such as count(), sum(), or avg(). Furthermore, dashboard queries require robust group by logic to organize the data logically—in our case, grouping by the target domain to see which areas of the business are under the heaviest attack.
In a traditional environment, understanding these analytical nuances creates a significant bottleneck. A Senior Analyst or Detection Engineer who perfectly understands the threat behavior might spend hours struggling with visualization schemas and aggregation logic just to build a simple chart. Meanwhile, the Tier 1 analysts actively monitoring the "glass" are left without visual context, and executive leadership lacks the high-level metrics needed to understand the current threat landscape.
This is the exact scenario where Gemini fundamentally alters the organizational dynamic. Armed with the context of our previous threat hunt, our Tier 3 Detection Engineer opens the Native Dashboard builder. Instead of opening a new tab to study schema documentation for aggregation syntax, they simply engage Gemini in a natural, conversational manner.
Prompt: "Create a dashboard widget visualized as a bar chart that shows the count of successful administrative logins that occurred immediately after 5 or more failed login attempts from the same non-US IP address over the last 30 days. Group the results by the target domain."
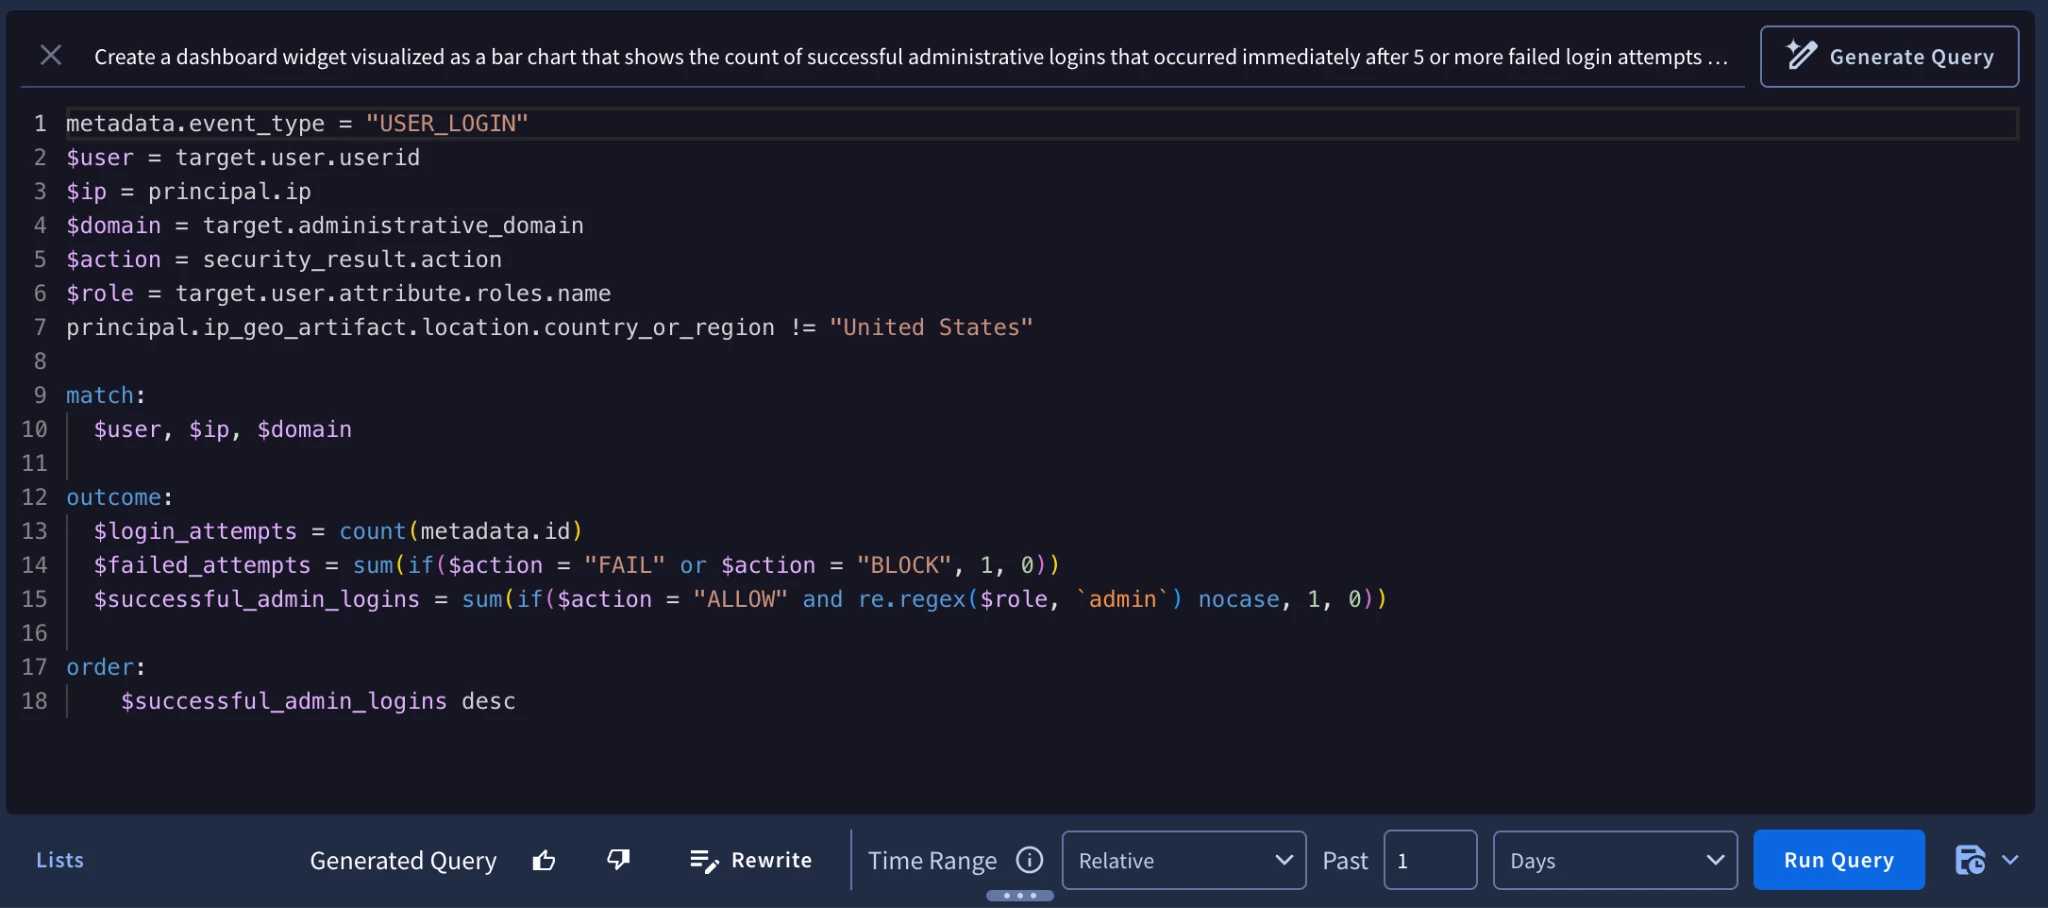
Once again, Gemini acts as the translator. It automatically maps the natural language request to the events data source and structures the complex sequence logic. More importantly, it handles the intricate dashboard-specific syntax: wrapping the event criteria in the necessary count() aggregations and automatically appending the group by target.hostname (or domain equivalent) parameter so the bar chart knows exactly how to render the X and Y axes. Gemini outputs a fully functional configuration that the engineer can simply save as a new dashboard widget. What used to be a multi-hour exercise in data visualization is completed in minutes.
Beyond the tactical monitoring, this visualization delivers massive strategic value. Because Google SecOps Native Dashboards support automated scheduling, the SOC Manager can configure this specific dashboard to compile into a polished PDF report. Every Monday morning at 8:00 AM, the CISO and executive management team receive an automated email detailing the geographic origin of targeted attacks against their administrative infrastructure, cleanly broken down by business unit or domain. By leveraging Gemini, the SOC has seamlessly transitioned a raw telemetry hunt into an automated detection, and finally, into a board-level executive metric—all without ever leaving the platform or writing a single line of proprietary code from scratch.
The Business Value: A Unified SOC Scenario
To truly understand the operational impact of this AI integration, let’s synthesize these capabilities into the real-world scenario we’ve been tracking: investigating a targeted brute-force campaign against administrative accounts from foreign IPs, culminating in a successful login. In a legacy SIEM environment, uncovering and operationalizing a defense against this specific behavior is a grueling, multi-step ordeal. An analyst must first spend upwards of 45 to 60 minutes just executing the search—digging through documentation to remember the exact UDM fields for authentication, figuring out how to call geographic enrichment data, and structuring the query to filter the noise. Once the threat is found, the focus shifts to automated detection. Because this requires a multi-event, time-series correlation, a Detection Engineer must spend another two to three hours writing YARA-L code, establishing $e1 and $e2 variables, defining sliding time windows, and painfully debugging compilation errors. Finally, to give leadership visibility, the engineer spends an additional hour manually configuring aggregation logic and proprietary dashboard syntax to build a custom reporting widget. In total, this manual, syntax-heavy workflow might consume four to five hours of total time, across multiple analysts in various departments.
Now, contrast that time consuming workflow with the Gemini powered experience in Google SecOps. When the initial suspicious activity is spotted, the workflow is entirely transformed. The analyst simply asks Gemini to hunt for failed admin logins from outside the US, refining the data conversationally in about two minutes. Transitioning to defense is just as seamless; the analyst instructs Gemini to translate that exact conversational context into a detection rule, producing a structured, production-ready YARA-L 2.0 draft in under five minutes. Finally, a simple prompt tasks the AI to generate a grouped bar chart for this specific threat, outputting the configuration for the executive Native Dashboard in about three minutes. What traditionally required roughly five hours of specialized technical engineering is condensed into a fluid, ten-minute conversation.
This contrast highlights the value Gemini Search brings to SOC Analysts workflows. It drives a massive, measurable reduction in critical security metrics. By slashing the time it takes to hunt through telemetry from an hour to two minutes, you drastically lower your Mean Time to Detect (MTTD). By accelerating the deployment of complex detection logic and executive visibility from half a day's work down to under ten minutes, you achieve an unprecedented improvement in your Mean Time to Respond (MTTR). By completely removing the friction of manual log analysis, detection engineering, and dashboard compilation, Gemini fundamentally alters the human economics of the SOC. It directly combats analyst burnout by replacing tedious coding tasks with high-value security analysis, and it serves as an incredible force multiplier that empowers Tier 1 analysts to confidently execute Tier 3-level threat hunts and detection engineering tasks in minutes.
Conclusion: Shifting from Reactive to Agentic
The integration of Gemini into Google SecOps represents far more than a simple quality-of-life upgrade; it is a fundamental re-architecture of the analyst workflow. As demonstrated throughout our brute-force scenario, Gemini Search eliminates the steep learning curve that has historically siloed SOC responsibilities. By allowing analysts to interact with their telemetry the same way they might brainstorm with a colleague—conversationally, iteratively, and logically—the platform democratizes advanced security engineering.
We have seen how a multi-hour, highly manual process of executing a complex threat hunt, writing YARA-L detections, and building custom executive dashboards can be condensed into a seamless, ten-minute conversation. This Gemini powered workflow not only slashes your Mean Time to Detect (MTTD) and Mean Time to Respond (MTTR), but it also directly addresses the human element of cybersecurity. By removing the cognitive load of data wrangling, compiling code, and debugging syntax, Gemini actively prevents analyst burnout.
As generative AI continues to evolve, we are witnessing the leading edge of a broader industry shift. We are moving away from reactive, query-heavy SOCs where humans do the heavy lifting and machines merely assist, toward proactive, agentic environments where machines do the heavy lifting and humans provide the strategic guidance. With Gemini handling the translation layer, security professionals can finally stop fighting their tools and get back to doing what they do best: hunting threats, engineering resilient defenses, and catching the bad guys.