
Hi there,

We have been using ReCaptcha for a while now for the websites we create for our customers, and recently we have upgraded all keys to the new ReCaptcha enterprise.

The "Protected Traffic" graph on the top of the page says there are 80,476 assessment requests in the past 30 days. We have about 150 recaptcha-keys, which would mean that in the past 30 days on avarage on every website 500+ calls were made.

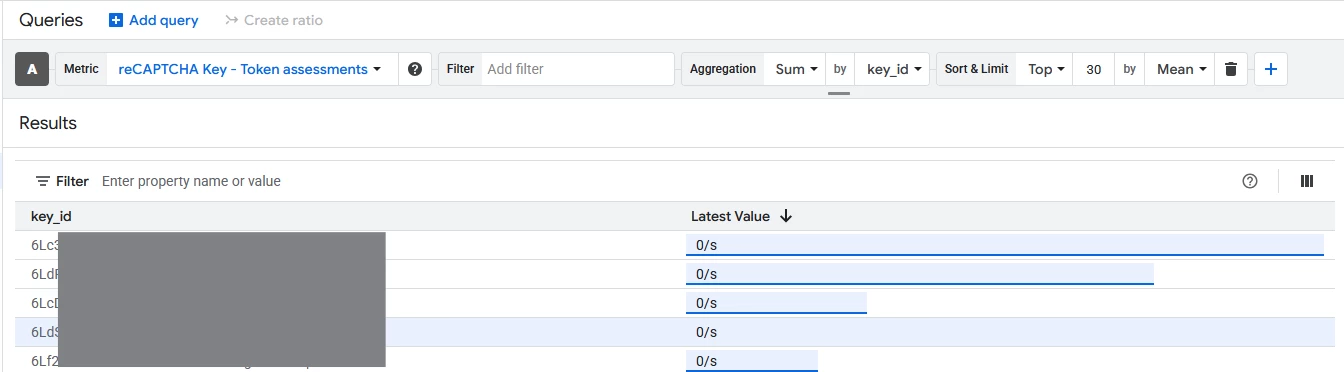
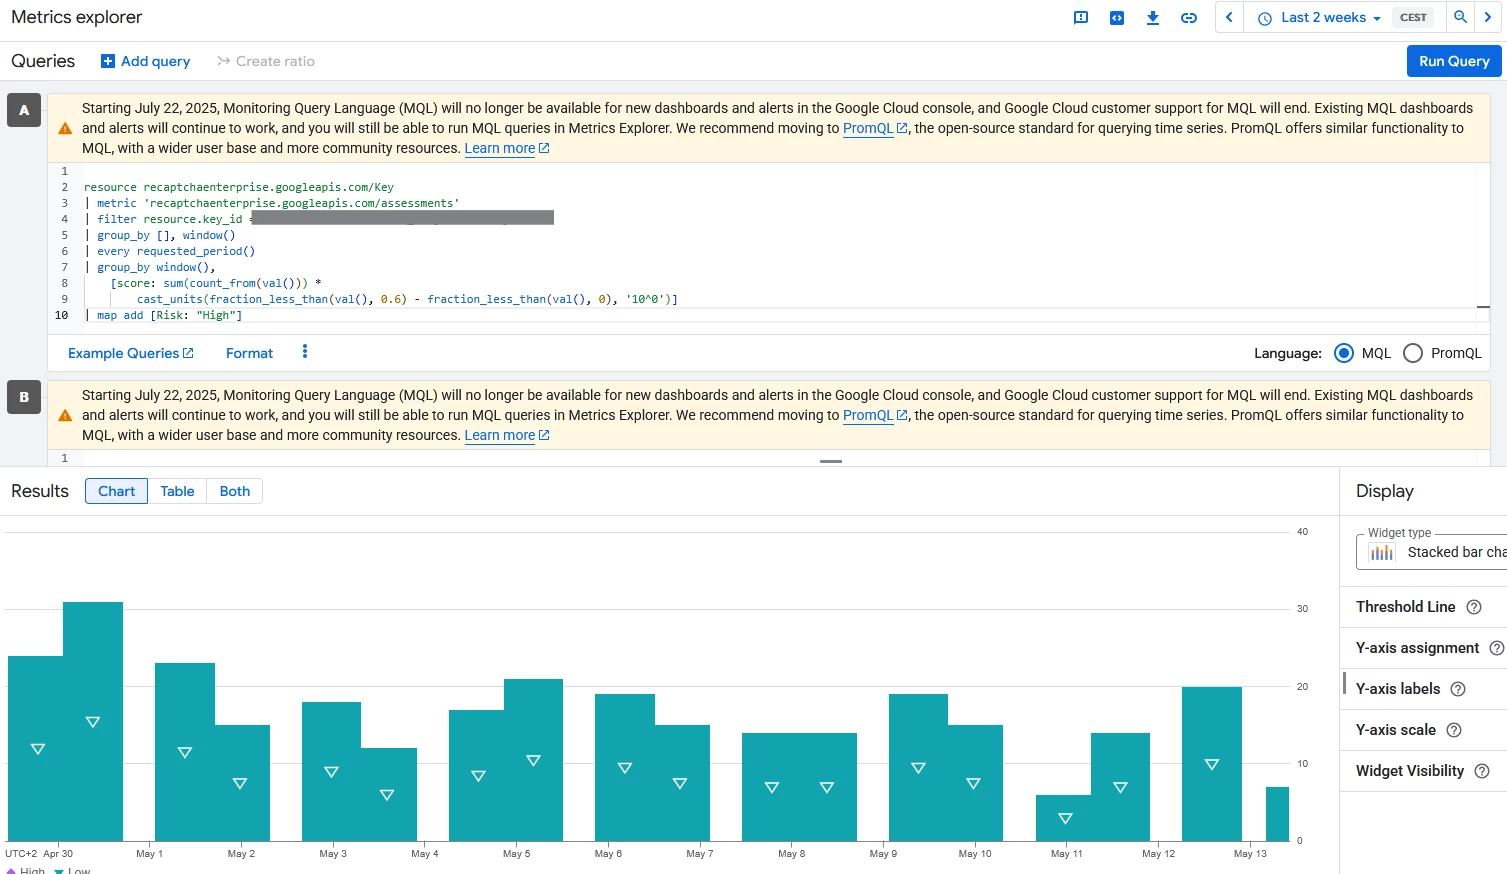
Is there a way to see how many recaptcha assessments per key were made, per day?

I love the graphs for Google Maps API usage, but I would like to see where this 80K comes from.


In Cloud Console, clicking on a key will take you to various charts for this key.


For more advanced monitoring I suggest you try Metrics Explorer


https://console.cloud.google.com/monitoring/metrics-explorer


Where you can look at reCAPTCHA Key metrics and break down by key.


Thanks for your response.

I've tried the metrics explorer, but I still can't seem to add the numbers together.

I do the following:

I go to metrics explorer and add a metric "reCAPTCAH Key - Token assesments", and "Sum by key_id".

If I understand this correctly, it shows me assesments per second (I want per day, but ok...).

Then I take the key_id of the top-result, go to my keys, click that key so it opens the "Overview" tab. Then I set it to 30 days, click on the dots-menu and click "View in Metrics Explorer".

In Metrics Explorer, I set the timespan to 2 weeks and set the Widget Type to "Stacked bar chart"

The highest scoring day in this view has 31 assessments. All other days are mostly below 20. This is the site with the most assessments according to the first table in Metrics Explorer.

Other sites seem to just be around 10 or below.

I don't see how this adds up to almost 80k in assessments. But we are getting billed for being above 10k. I would like a view with the amount of assessments per key_id, so I can take a look what is causing the sum to add up to 80k.


In Cloud Console, clicking on a key will take you to various charts for this key.


For more advanced monitoring I suggest you try Metrics Explorer


https://console.cloud.google.com/monitoring/metrics-explorer


Where you can look at reCAPTCHA Key metrics and break down by key.


Sorry, I made stand-alone reply instead of replying to your answer. 🙂

It's below.


Thanks for your response.

I've tried the metrics explorer, but I still can't seem to add the numbers together.

I do the following:

I go to metrics explorer and add a metric "reCAPTCAH Key - Token assesments", and "Sum by key_id".

If I understand this correctly, it shows me assesments per second (I want per day, but ok...).

Then I take the key_id of the top-result, go to my keys, click that key so it opens the "Overview" tab. Then I set it to 30 days, click on the dots-menu and click "View in Metrics Explorer".

In Metrics Explorer, I set the timespan to 2 weeks and set the Widget Type to "Stacked bar chart"

The highest scoring day in this view has 31 assessments. All other days are mostly below 20. This is the site with the most assessments according to the first table in Metrics Explorer.

Other sites seem to just be around 10 or below.

I don't see how this adds up to almost 80k in assessments. But we are getting billed for being above 10k. I would like a view with the amount of assessments per key_id, so I can take a look what is causing the sum to add up to 80k.


I know that MQL/PromQL syntax can be nonintuitive, but perhaps this view can let you find your most-used keys after which you can inspect the Bots tab at


console.cloud.google.com/security/recaptcha/<your_key>/bots


I know that MQL/PromQL syntax can be nonintuitive, but perhaps this view can let you find your most-used keys after which you can inspect the Bots tab at


console.cloud.google.com/security/recaptcha/<your_key>/bots


So, I've taken the time to view that 'bots' tab (set to 1 month) for EVERY key in 2 different projects. "Project A" with 84 keys and "Project B" with 30 keys.

The Recaptcha dashboard for "Project A" says:

Protected Traffic, last 30 days: 76.322

But when I add up all numbers from the "bots" view for all keys, I only come to 1.750. That is not even close, it's only 2.3%!

Same for "Project B". The dashboard says 3,273, but adding all data from the "bots" view comes to 143. Which is only 4.3%.

So where are all the other assessments comming from?


Hello, I do not have enough information about your specific case to give an answer here.


Please reach out to Google Cloud support: https://cloud.google.com/recaptcha/docs/getting-support


Reply