

Table of Contents
The Security Command Center Enterprise overview dashboard can be used to find the most severely rated findings in your organization so that you can prioritize fixes.
Actions

Threat
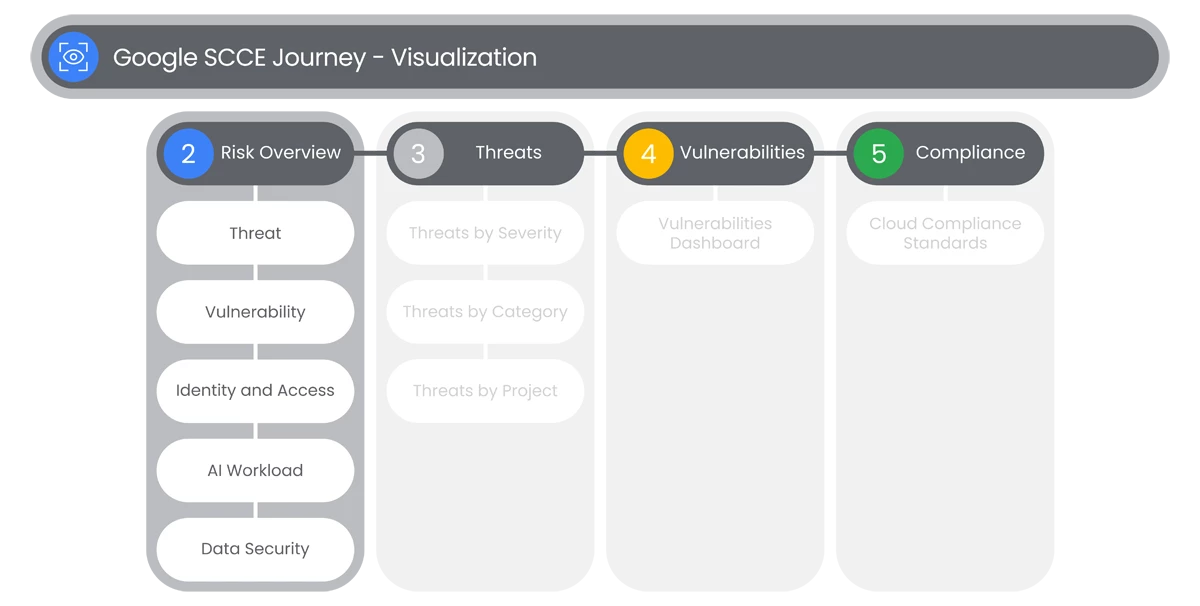
The Risk Overview dashboard highlights the most critical security findings to help you prioritize threats effectively.
- In the Risk Overview section, users will see a dashboard of the several rated findings in their organization, so the can prioritize fixes.
- There users will see the Threat Cases widget to provide visualization to Triage and Investigate the latest threats with cases.
- Users will see a graph with a count of Total Cases, and a Priority Rating Scale, listing Cases as:
- Critical
- High
- Medium
- Low
- Info
- Each Rating Scale will have the number of Cases associated with each Priority Rating Scale, where users can select to view the Cases List in the Google SecOps’ Cases feature.
- The Cases feature will be covered further in the Google SecOps Cases section of the Onboarding Journey.
- Users can click the View All Threat Cases link at the bottom-right of the Widget, to View All Threat Cases in Google SecOps, which will show the Cases. If users just click each grouping of Cases by Priority in the Widget, users will see a list of Cases by Name and ID number.
- This view gives users an overview of all cases and their associated Assignee.
- In the Threat Findings Widget users can see the list of High Risk Threats by finding Severity in a Graph. This will also list Cases by:
- Resource Type
- Category
- Project
- Users can click the View All Alerts link at the bottom-right of the Widget, to View All Alerts in Google SecOps to view the Threat Findings Alerts List in the Google SecOps Alerts & IOCs feature.
- The Alerts feature will be covered further in the Google SecOps Detection section of the Onboarding Journey.
Relevant Documentation Links

Vulnerability
The Vulnerability Cases widget provides key insights into your organization's most critical vulnerabilities, helping you prioritize fixes and track high-risk areas.
Steps
- The Vulnerability Cases widget provides visualization to Triage and Track an organization’s riskiest Vulnerabilities with Cases.
- Users will see a graph with a count of Total Cases, and a Priority Rating Scale, listing Cases as:
- Critical
- High
- Medium
- Low
- Info
- Each Rating Scale will have the number of Cases associated with each Priority Rating Scale, where users can view the Vulnerabilities List in the Google SCCE Cloud Platform’s Vulnerabilities by Case list by selecting Cases by Priority or by selecting View All Vulnerabilities by Case. This page will include Vulnerabilities Findings query results.
- Users can click the View All Vulnerability Cases link at the bottom-right of the Widget, to View All Vulnerability Cases in the Cases List in the Google SecOps’ Cases feature.
- The Cases feature will be covered further in the Google SecOps Detection section of the Onboarding Journey.
- In the Active Vulnerability Findings Widget, users will be able to visualize their highest risk Vulnerabilities by finding resource type.
- This view will provide a graph listing Vulnerabilities by:
- Findings by Attack Exposure Score
- Findings by Resource Type
- Below the graph is a list of Vulnerability Findings with an Attack Exposure Score. This list will display the:
- Category
- Attack Exposure Score
- Resource Path
- Case ID
- Resource
- Users can click the View All Findings with Attack Exposure link at the bottom-right of the Widget, to View All Findings with Attack Exposure in the Findings list of the Google SCCE Cloud Platform’s Findings feature. This page will include Vulnerabilities Findings Query Results.
- In the Top CVE Findings of your Virtual Machines, users can prioritize their highest risk CVEs by Impact and Exploitability.
- Users can click the View All CVE Findings link at the bottom-right of the Widget, to View CVE Findings in the Findings list of the Google SCCE Cloud Platform’s Risk Overview> Findings by CVE feature. This page will include Findings by CVE ID list, with an option to view in the Findings feature.
Relevant Documentation Links

Identity and Access
The Identity and Access widget highlights high-severity findings related to identity and access, enabling you to detect and mitigate security risks associated with permissions and controls.
Steps
- The Identity and Access Findings widget provides visualization of the Top Severity Identity and Access Findings by category.
- Users will see a list of Top Severity Identity and Access Findings. This list will display by:
- Severity
- Finding Category
- Cloud Provider
- Total Findings
- Users can click the View All Identity and Access Findings link at the bottom of the Widget, to View All Identity and Access Findings in the Findings list of the Google SCCE Cloud Platform’s Findings feature. This page will include Identity and Access Findings Query Results.
- Users will see an option to Review Access with Policy Analyzer for Google Cloud link at the bottom-right of the Widget. By clicking it users will be brought to the Policy Analyzer feature of the Google Cloud Console’s IAM & Admin page.
- The Policy Analyzer helps you answer "Who has access to a resource and what can they do?" It examines the user’s IAM Policy Settings, and then shows them how they affect each principal and resource.
- Users will create a Query in each section, based on the question template they have, by selecting:
- Create Query
- Create Custom Query
- After users configure their Query, users will select Analyze.
Relevant Documentation Links
- [All Steps] https://cloud.google.com/security-command-center/docs/scce-consoles-overview#gcp-console

AI Workload
AI Workload Findings allow users to review violations to secure AI policies, drift from intended AI policies, and security issues detected on AI resources.
Steps
- The AI Workload widget provides visualization of violations to secure AI policies.
- Users will see the following sections:
- Vulnerabilities
- Policy Drift
-
The Vulnerabilities section will have the following columns:- Category
- Severity
- Resource
- Users can click the View all link at the bottom-right of the widget to View All of the AI Workload Vulnerabilities Findings in the Google SCCE Cloud Platform's Findings feature. This page will include AI Workload Vulnerabilities Findings Query Results.
- The Policy Drift section will have the following columns:
- Changed Policy
- Event Time
- Resource
- Users can click the View All link at the bottom-right of the widget, to View All in the AI Workload Policy Drift Findings list of the Google SCCE Cloud Platform’s Findings feature. This page will include AI Workload Policy Drift Findings Query Results.
Relevant Documentation Links

Data Security
Data security findings displays the top severity data security findings, by finding category.
Steps
- The Data Security widget provides visualization to severity data security findings.
- The Data Security section will have the following columns:
- Severity
- Findings Category
- Total Findings
- Users can click the View All Data Security Findings link at the bottom-right of the widget, to View All Data Security Findings in the Data Security Findings list of the Google SCCE Cloud Platform’s Findings feature. This page will include Data Security Findings Query Results.
- Users can click the Review Detailed Data Posture in Sensitive Data Protection link at the bottom-right of the widget, to Review Detailed Data Posture in Sensitive Data Protection in the Sensitive Data Protection section of the Google SCCE Cloud Platform’s Data Protection feature.
- Users will be automatically be brought to the Discovery Dashboard of the Sensitive Data Protection page. This will display the following information:
- Product Coverage
- Sensitive Data Inventory Details
- Asset Locations
- InfoType Graphs
- Risk Over Time Graph
- Sensitivity Over Time Graph
- The Discovery Dashboard also allows users to view and make changes to the following sections:
- Profiles
- Scan Configurations
- Cost Estimates
- Service Connections
- Create Configurations
Relevant Documentation Links
Next Step: Security Command Center Enterprise: Step 2.2 - Visualization | Threats
Previous Step: Security Command Center Enterprise: Step 2 - Visualization Overview