



Table of Contents
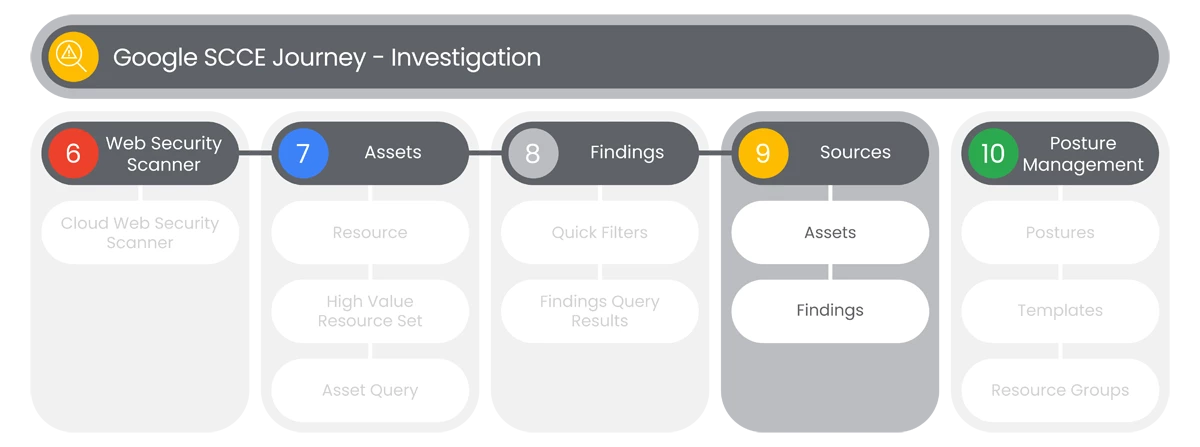
The Security Command Center Enterprise’s Sources dashboard will help you create a source to generate findings. When you add a source, Security Command Center creates appropriate sources and assigns them the relevant permissions.
Use Security Command Center's Sources display to review a summary of assets and findings from the security sources you have enabled.
Actions

Assets
Let’s explore the Sources dashboard in SCCE, which helps you manage and review security sources that generate findings. By understanding your sources, you can track assets and findings from enabled security tools.
- In the Sources dashboard, it is important to note that a Source is not visible in the Security Command Center Console until it generates Findings.
- This dashboard will have a series of Source Lists, which will display each Source in the following columns:
- Source
- Count
- Users can click any highlighted Source link in the Source selection to view Source Findings in the Google SCCE Cloud Platform’s Findings feature. This page will include Source Details Findings Query Results.
- Some of the Source Lists will have an associated Icon that will also bring users to the Source Details Findings Query Results page. Those Icons will look like the following:
 = Security Health Analytics
 = Event Threat Detection
 = Sensitive Data Protection
 = Cloud Armor
Relevant Documentation Links
- [All Steps] https://cloud.google.com/security-command-center/docs/how-to-api-create-manage-security-sources

Findings
The Sources dashboard and related findings feature allows you to manage and review security sources that generate findings. The Findings Query section helps you analyze and take action on these findings.
Steps
- At the left-side of the Findings Query dashboard, users will see a Quick Filters panel that has the following Quick Filters categories:
- State
- Category
- Findings Class
- Project ID
- Resource Type
- Severity
- Source Display Name
- Cloud Provider
- To minimize the the Quick Filters panel, users will select the Toggle Panel button.

- Users will see the Findings dashboard with Edit Query button at the top-right of the dashboard.
- Users will select to Edit Query which will display a Query Text Editor, which can be collapsed by selecting the Collapse Editor Toggle.

- To the right of the Query Text Editor is a More Actions button,
 which will contain the Edit Query button and a Time Range to select for the Findings Query.
- At the top of the Findings Query Results section, users will see five options:
- Change Active State
- Set Security Marks
- Mute Options
- Export
- Columns Display
- When users select the Selection Text link under Category, users will see a Details page appear that shows the following tabs:
- Summary
- Source Properties
- JSON
- At the top-right of the Details page, users will see the Take Action button, with the following options:
- Apply Mute Override
- Mute Findings Like This
- Copy Link
- Send Feedback
- In the Summary tab, users will see the following detail sections:
- What Was Detected
- Affected Resource
- Security Marks
- Next Steps
- Detection Service
- The Source Properties tab will display Source Properties as:
- Metadata
- Remediation
- Users can select to Filter by:
- Property
- Value
- In the JSON tab, user will see the a Text Editor, with a Copy button in the top-right corner.
Relevant Documentation Links
- [All Steps] https://cloud.google.com/security-command-center/docs/how-to-api-create-manage-findings
- [Additional Steps] https://cloud.google.com/security-command-center/docs/how-to-api-create-manage-security-sources
Next Step: Security Command Center Enterprise: Step 3.5 - Investigation | Posture Management
Previous Step: Security Command Center Enterprise: Step 3.3 - Investigation | Findings
