


Table of Contents
The Security Command Center Enterprise’s Findings dashboard is a record of security issues that the Security Command Center services trigger.
Prerequisites
- Have the following Roles:
- Security Center Findings Viewer (roles/securitycenter.findingsViewer)
- Security Center Findings Editor (roles/securitycenter.findingsEditor)
Actions

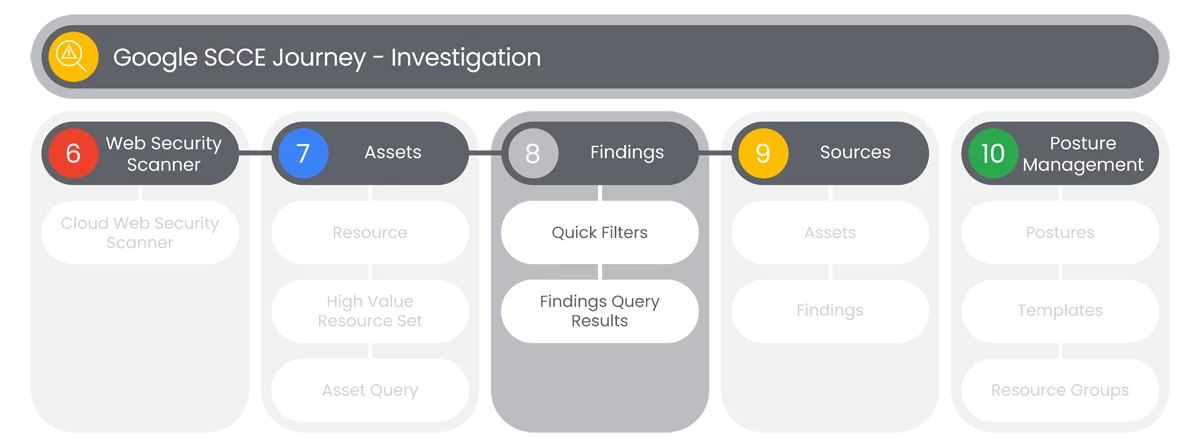
Quick Filters
This section covers the findings dashboard in SCCE. This dashboard provides a comprehensive record of security issues identified by SCCE services, helping you analyze and address potential risks in your Google Cloud environment.
Prerequisites
- Have the following Roles:
- Security Center Findings Viewer
- Security Center Findings Editor
- Users will see the Findings dashboard with the Edit Query button at the top-right of the dashboard.
- Users will select Edit Query which will display a Query Text Editor that can be collapsed by clicking the Collapse Editor Toggle.

- To the right of the Edit Query button, users will see a Time Range to select for the Findings Query.
- At the left-side of the Asset Query dashboard, users will see a Quick Filters panel that has the following Filter categories:
- State
- Category
- Findings Class
- Project ID
- Resource Type
- Severity
- Source Display Name
- Cloud Provider
- To minimize the the Quick Filters panel, users will select the Toggle Panel button.

Relevant Documentation Links
- [All Steps] https://cloud.google.com/security-command-center/docs/review-manage-findings#edit-finding-query

Findings Query Results
The Findings query results and details page in SCCE offers in-depth insights into detected security issues, with powerful tools to manage and analyze them.
Prerequisites
- Have the following Roles:
- Security Center Findings Viewer
- Security Center Findings Edito
Steps
- At the top of the Findings Query Results section, users will see five options:
- Change Active State
- Set Security Marks
- Mute Options
- Export
- Columns Display
- In the main section of the Findings Query Results section, users will have a series of Column selections to choose from, but will have Results under the following default Column selections:
- Category
- Severity
- Toxic Combination Score
- Score
- Event Time
- Create Time
- Finding Class
- Display Name
- Resource Path
- Source Display Name
- Case ID
- When users select the Selection Text link under Category, users will see a Details page appear that shows the following tabs:
- Summary
- JSON
- At the top-right of the Details page, users will see the Take Action button, with the following options:
- Apply Mute Override
- Mute Findings Like This
- Copy Link
- Send Feedback
- In the Summary tab, users will see the following detail sections:
- What Was Detected
- Affected Resource
- Security Marks
- In the JSON tab, user will see the a Text Editor, with a Copy button in the top-right corner.
Relevant Documentation Links
- [All Steps] https://cloud.google.com/security-command-center/docs/how-to-build-findings-query-console
Next Step: Security Command Center Enterprise: Step 3.4 - Investigation | Sources
Previous Step: Security Command Center Enterprise: Step 3.2 - Investigation | Assets