



Hello Google SecOps Community,
I wanted to send out a feature announcement that has been enabled for all customers in all regions. If you recall from earlier this year, we announced some improvements to “rule observability” (o11y) that labeled detections more clearly regarding event time, normalization time and detection times, as well as rule replay metadata. While we received very positive feedback, and have watched the “Rule Observability” curated dashboard rapidly grow in adoption, we are excited to let the community know we’re adding additional observability to rule state changes. Historically, when community members have asked, our guidance has been to use the existing APIs to poll this information, and folks like @Bruzz have provided toolkits to help simplify integrating with those APIs.
There are a number of reasons why a rule will be placed into a LIMITED and subsequently a PAUSED state, but most commonly it’s when a rule has consumed a large amount of cluster-wide resources and needs to be moved first to a lower tier (LIMITED) and if it persistently consumes a high amount of resources, then to PAUSED, which is functionally equivalent to the rule being “disabled”.
As of this week, we are now emitting rule state change messages directly to Google Cloud Monitoring, which can also be forwarded to your SecOps Instance. Here is an example of a rule that has transitioned to a LIMITED state:
{
  "protoPayload": {
    "@type": "type.googleapis.com/google.cloud.audit.AuditLog",
    "status": {
      "message": "Rule status automatically transitioned to LIMITED due to exceeding resource consumption or error limits."
    },
    "authenticationInfo": {},
    "requestMetadata": {
      "requestAttributes": {},
      "destinationAttributes": {}
    },
    "serviceName": "chronicle.googleapis.com",
    "methodName": "google.cloud.chronicle.v1.RuleService.UpdateRuleExecutionState",
    "resourceName": "projects/secops-pm-federation-demo/locations/us-central1/instances/7fd5be84-ff27-4eeb-9ae8-c9535a7757f9/rules/ru_8307ce31-7134-4ab6-b7a5-4f06bddfb2ce/deployment",
    "metadata": {
      "transitionReason": "Rule status automatically transitioned to LIMITED due to exceeding resource consumption or error limits.",
      "previousExecutionState": "DEFAULT",
      "executionState": "LIMITED",
      "@type": "type.googleapis.com/google.cloud.chronicle.audit.RuleGuardrailAuditMetadata",
      "displayName": "vt_relationships_file_downloaded_from_url",
      "name": "projects/secops-pm-federation-demo/locations/us-central1/instances/7fd5be84-ff27-4eeb-9ae8-c9535a7757f9/rules/ru_8307ce31-7134-4ab6-b7a5-4f06bddfb2ce/deployment"
    },
   …
To quickly orient yourself around the shape of these logs, use the following LQL query in Google Cloud Monitoring:
SEARCH("PAUSED") OR SEARCH("LIMITED")
protoPayload.methodName="google.cloud.chronicle.v1.RuleService.UpdateRuleExecutionState"
If you have any rules that have reached a LIMITED or PAUSED state you’ll see results similar to the following:
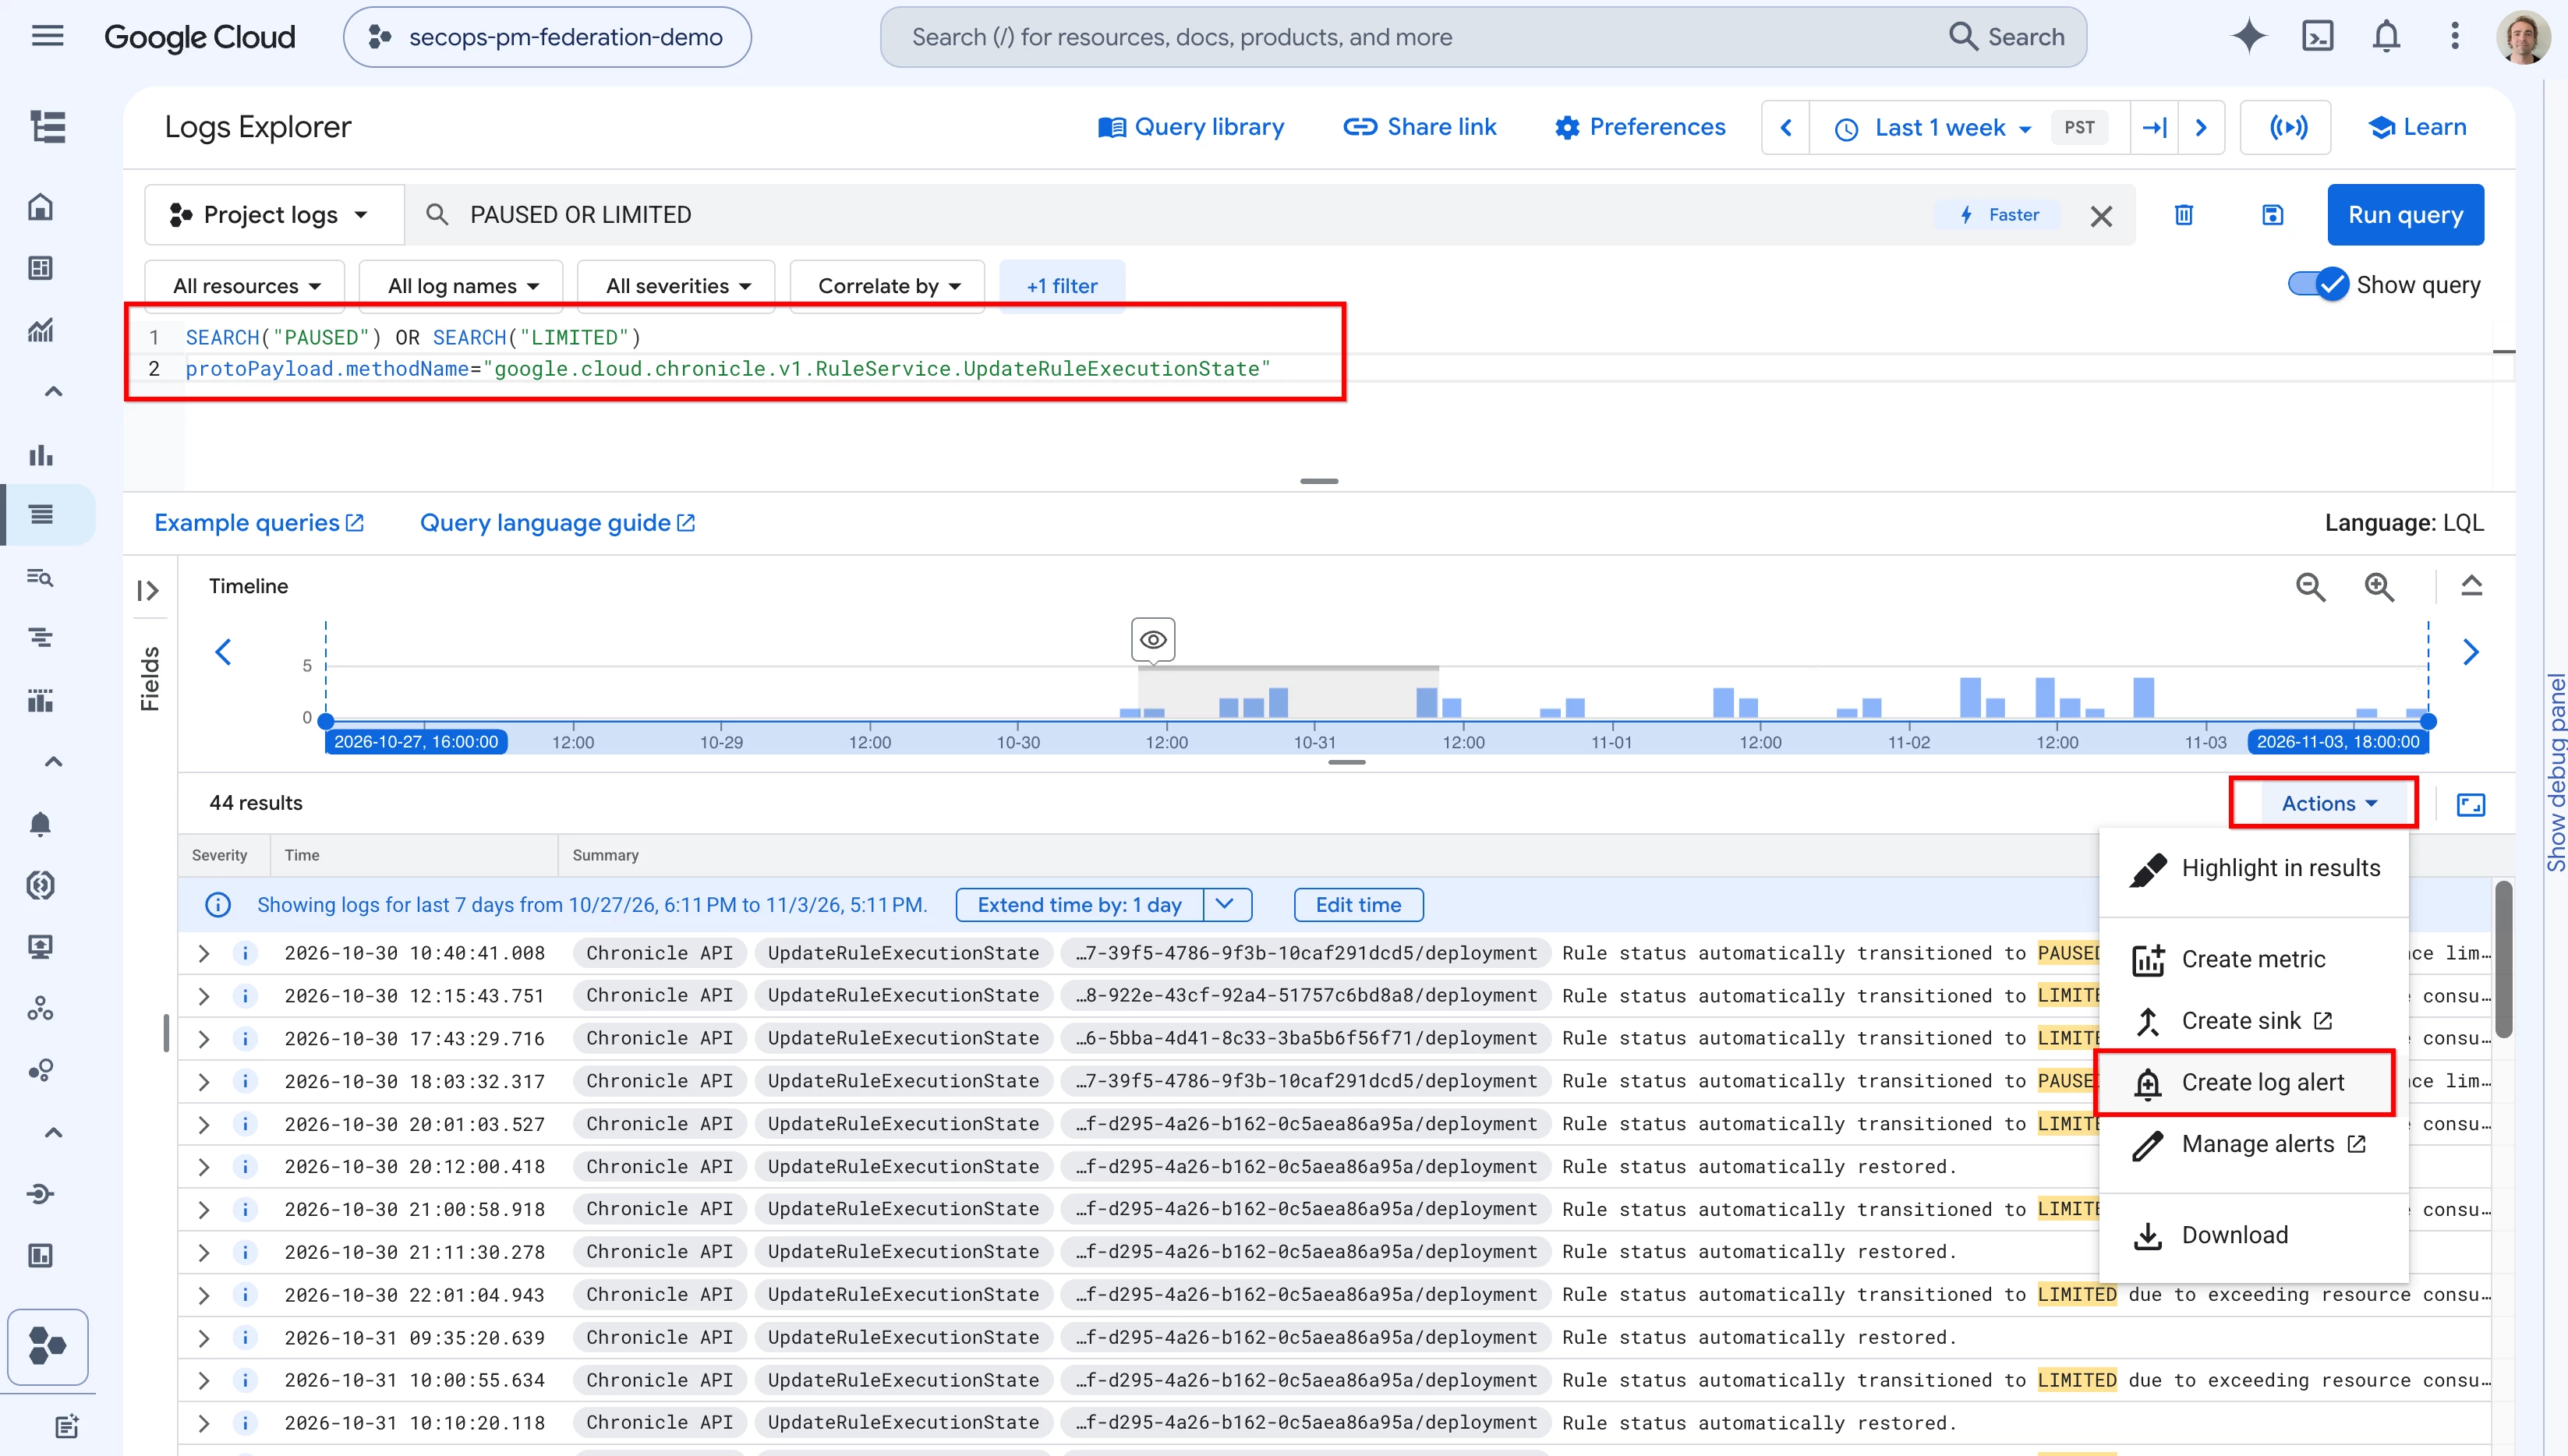
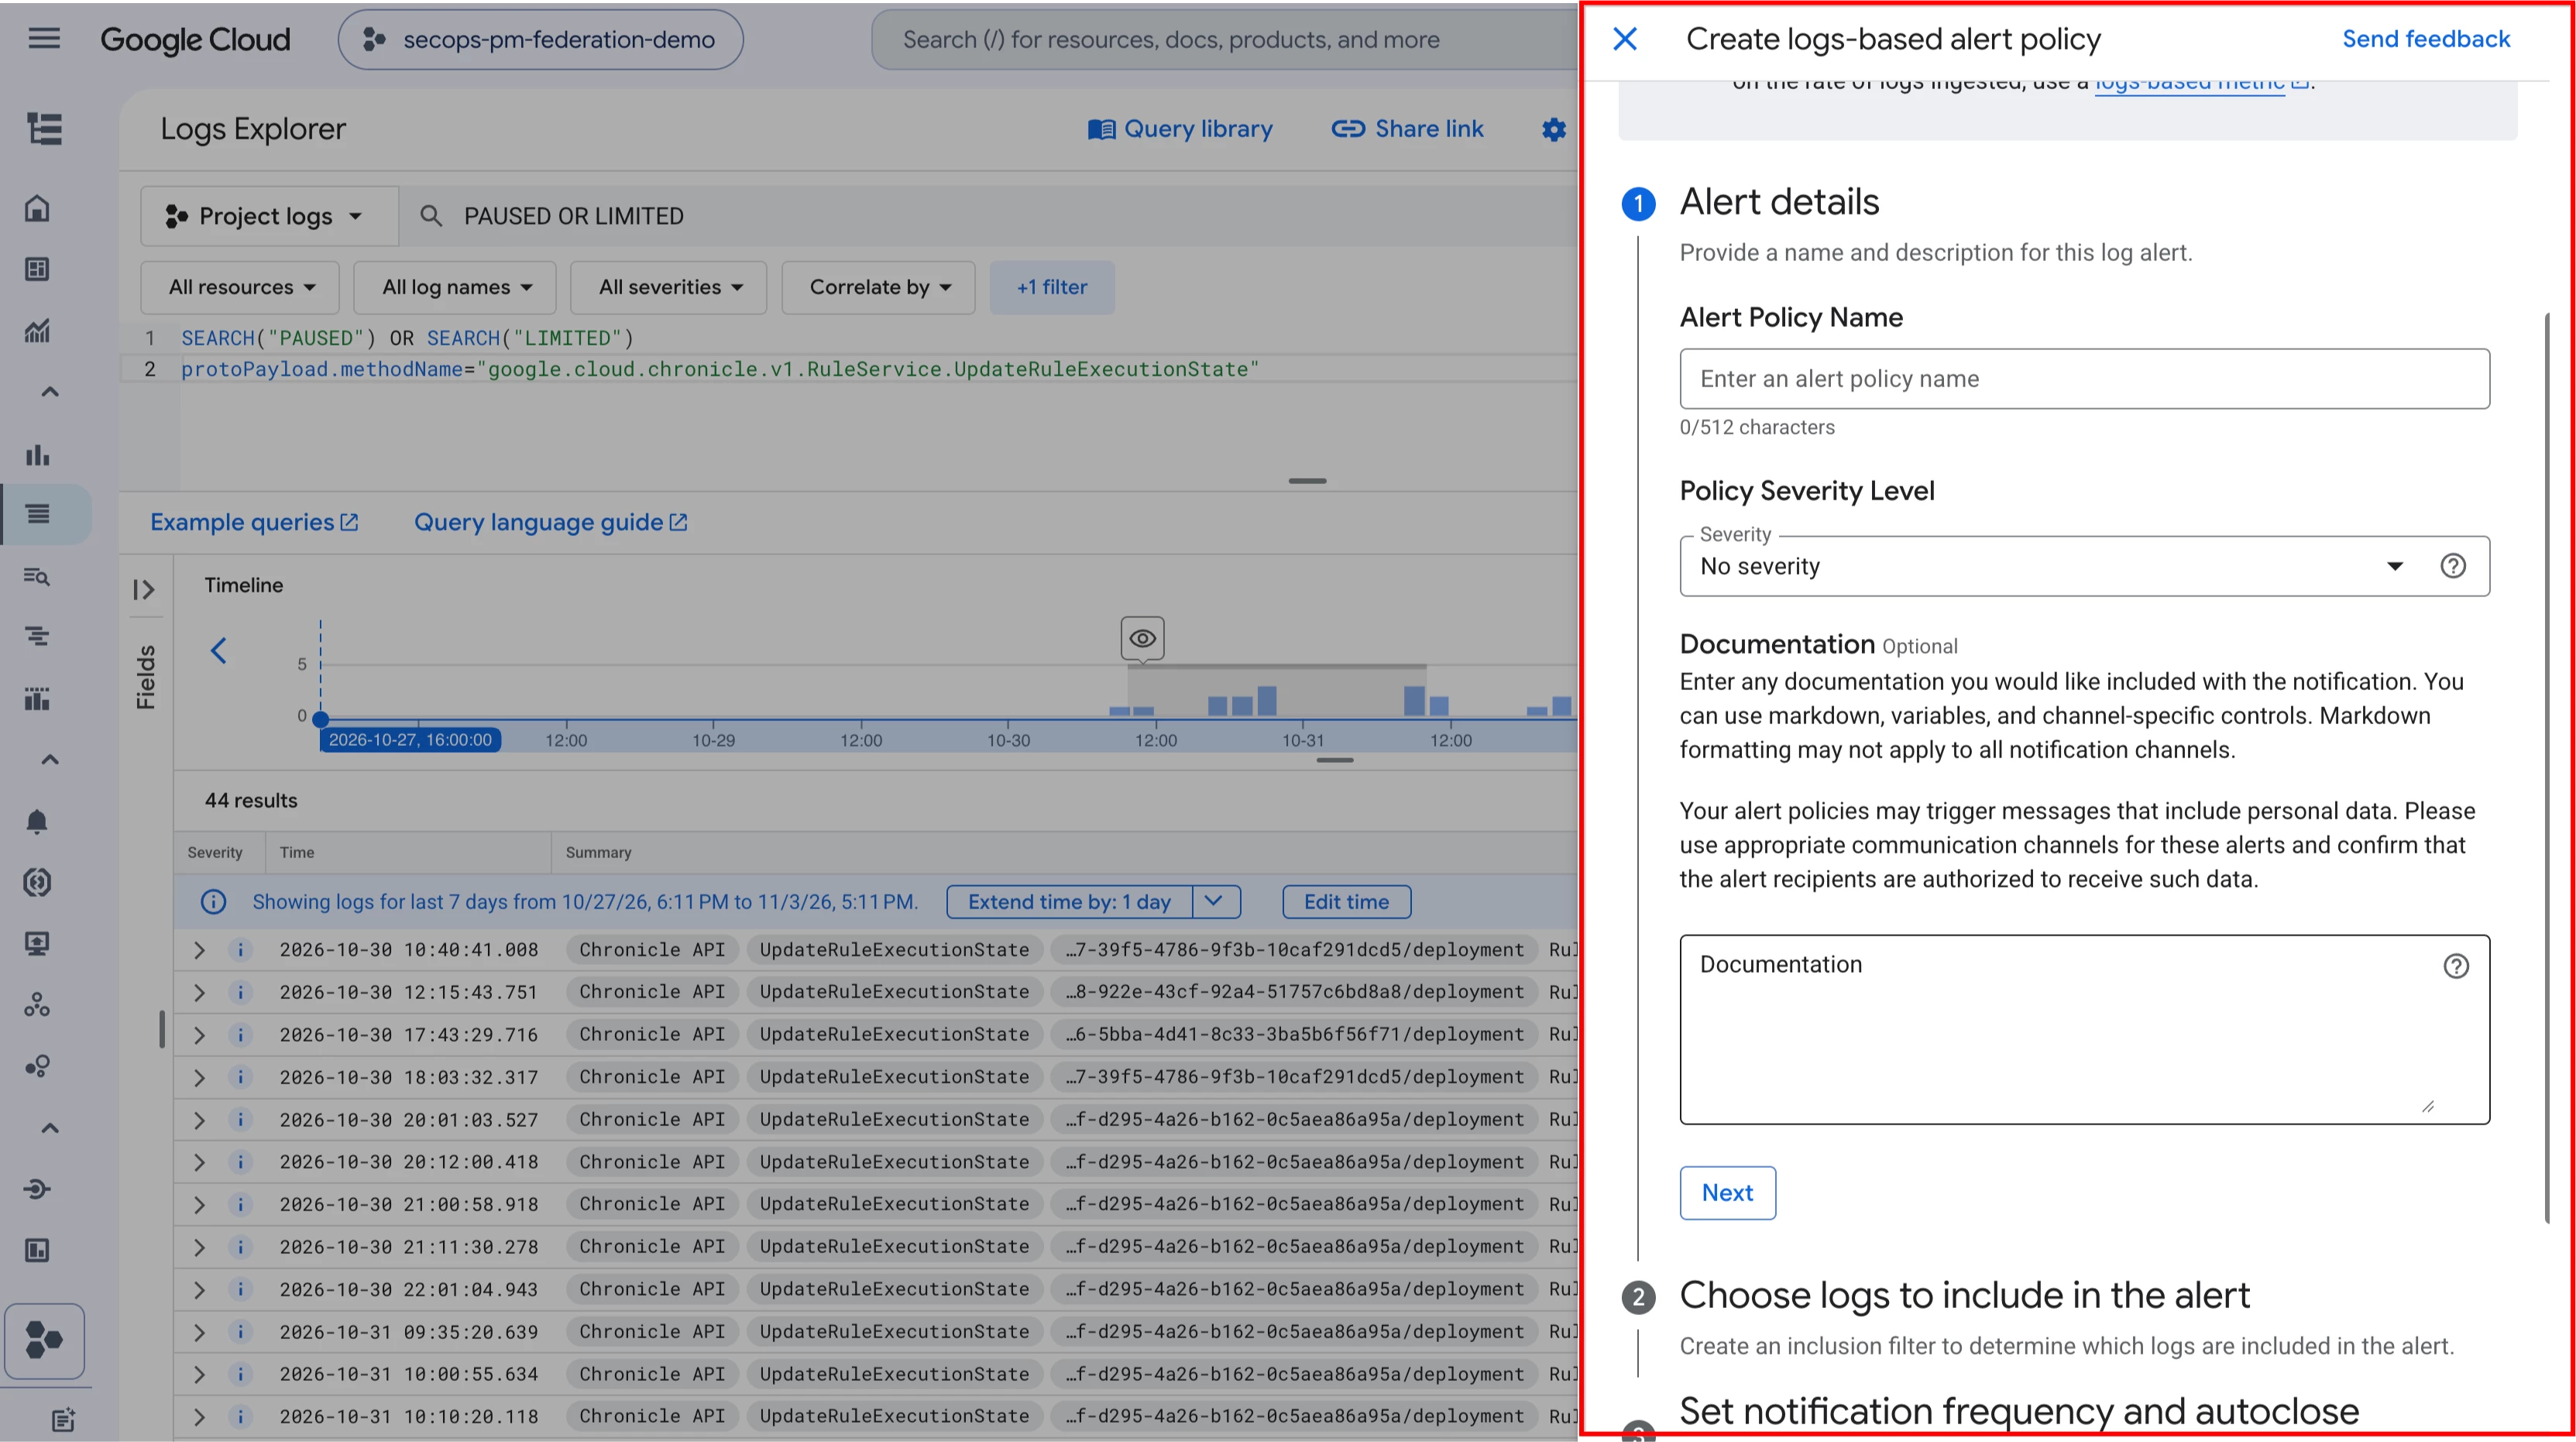
If you want to alert on these conditions, you can set up a “log alert”, and in this example, send an email.
We’re looking to add additional message types to this feature in the coming months, but would love to know what you think about this and how we can improve it.
-Kyle & the SecOps Team
